Nasdaq (US100) Analysis: Navigating a Critical Support ZoneThe Nasdaq (US100) is currently at a pivotal point, trading just above a key support zone. A comprehensive analysis of the daily chart, as depicted in the screenshot, reveals several critical factors that could influence its short term trajectory.
Key Observations and Analysis
1. Price Action and Support Zone:
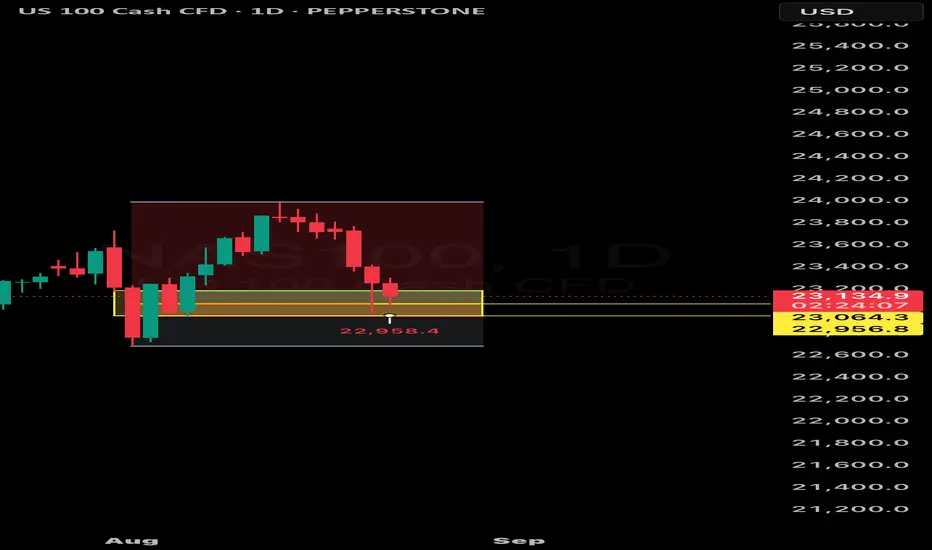
The Nasdaq has recently experienced a significant pullback from its recent highs, testing a critical support area. This zone, highlighted in the chart between approximately 22,800 and 23,000, is where buyers have previously stepped in, preventing further declines. The price has been consolidating within this range for several trading sessions, forming a potential "bottoming" pattern. The current price of 23,129.4, as shown, is hovering just above this level. This indicates a fierce battle between bulls and bears. A decisive break below this support would likely trigger further selling pressure, potentially targeting the next major support level around 22,000.
Conversely, a successful defense of this zone could provide the necessary foundation for a bullish reversal.
2. Candle Analysis (Bearish and Bullish Signals):
The chart shows a mix of bearish and bullish candlestick patterns.
* Bearish Candles: Several long red candles indicate strong selling pressure, particularly during the initial decline from the highs. These candles show that sellers were in control, pushing prices down aggressively.
* Bullish Candles: The appearance of smaller green candles within the support zone suggests that buyers are starting to show interest. These candles represent a slowing of the selling momentum and an increase in buying activity. The presence of a "hammer" or "doji"-like candle near the bottom of the range would be a bullish signal, indicating that sellers are losing control and a potential reversal is on the horizon.
3. Volume Analysis (Not Visible in Chart, but Crucial):
For a complete analysis, it is essential to consider volume.
* Declining Volume on the Pullback: If the recent decline occurred on declining volume, it would suggest that the selling pressure is weakening.
* Increasing Volume at Support: An increase in volume as the price tests the support zone would be a strong indicator of institutional buying. This would suggest that large players are accumulating positions at this level, providing a solid foundation for a potential rally.
Potential Scenarios and Future Outlook
Based on the current technical setup, two primary scenarios could unfold:
1. Bullish Reversal:
If the Nasdaq successfully holds the 22,800 - 23,000 support zone and breaks above the resistance of the current consolidation range, it would signal a potential return to its uptrend. The next key resistance level to watch would be around 23,750, a level where sellers previously entered the market. A break above this would likely clear the way for a test of the previous highs.
2. Bearish Continuation:
A decisive daily close below the 22,800 support level would be a major bearish signal. This would invalidate the current consolidation and could lead to a rapid move towards the next significant support level around 22,000. Traders would need to be cautious and consider a potential downside move in this scenario.
Conclusion
The Nasdaq (US100) is at a critical juncture. The price action within the 22,800 - 23,000 support zone will be the key to determining its next major move. A successful defense of this area could pave the way for a strong rebound, while a breach would likely signal a continuation of the downtrend. Traders should monitor price action and volume closely for confirmation of either scenario before making any trading decisions.
NAS100FT trade ideas
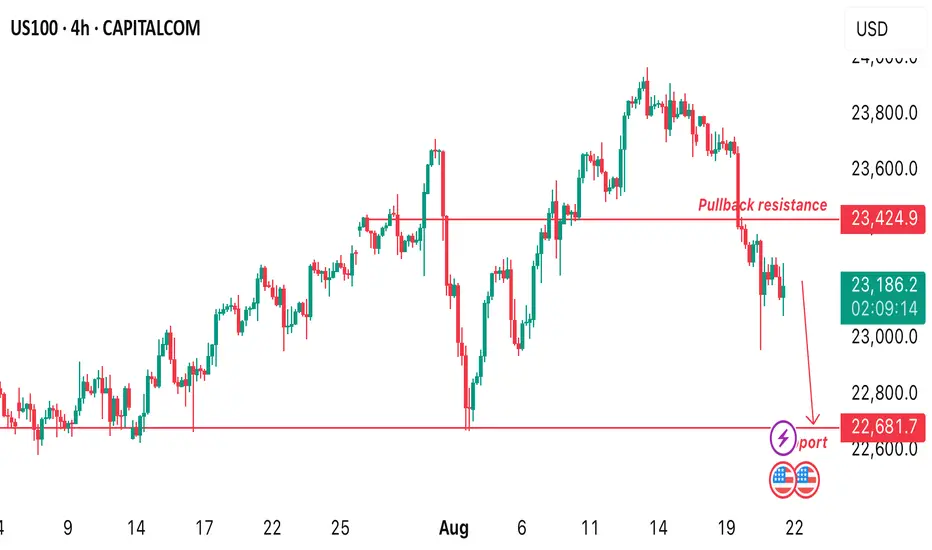
US100 MARKET OUTLOOKIf price continues to fall, the next support level would be at 22681.7 if we begin to see a pullback from the current price. The nearest resistance would be at 23518 we’d be monitoring price for a clearer price action before we begin to take trading decisions
NASDAQ Index Analysis (US100 / NASDAQ):The index shows a long-term bullish trend (daily timeframe), while the short-term trend on the hourly chart is bearish. Currently, the price is trading near 23,200.
🔻 Bearish Scenario:
If the price breaks below 23,160 and holds, it may head toward 23,000, and with continued selling pressure, it could extend to 22,800.
🔺 Bullish Scenario (Most Likely):
If buying momentum appears and the price manages to break and hold above 23,350, this could support further upside toward 23,500, and strong bullish continuation may open the way to test 23,680.

NAS100 falls slightly but conditions are still bullish!NAS100 climbed in a steep ascending trend and my expectation is for a continuation, with an upside target at around 24,000.
It is still clearly moving inside the channel, as predicted previously in my idea:
At 24.000 is where it can become a decision point, where price might correct again, or it pushes more and that’s when we might see the move start to gain more momentum.
But if price breaks below the trendline with conviction, it would invalidate the bullish scenario, suggesting that the uptrend may pause or could even reverse short-term.

“How I Trade NAS100 with 4H Order Flow + 15M Precision Entry”Here’s my step-by-step process for catching high probability NAS100 setups 👇
1️⃣ Direction from 4H Order Flow
– I only look for trades in the direction of the 4H structure.
– My key levels are 4H OBs and 4H FVGs.
2️⃣ Patience at the Key Level
– No random trades. I wait until price reacts to one of my 4H levels.
3️⃣ 15M Entry Model (MSS + IFVG)
– Once price reacts, I refine entry on the 15M chart using MSS (Market Structure Shift) + IFVG (Inverted Fair Value Gap).
– This keeps risk tight and entries precise.
4️⃣ Risk Management
– I always place stop loss at the invalidation point.
– Targeting a minimum of 1:2 Risk to Reward.
⚡ The edge is simple: Only trade what pays me. Nothing else.
Why Markets Never Move in a Straight LineHello,
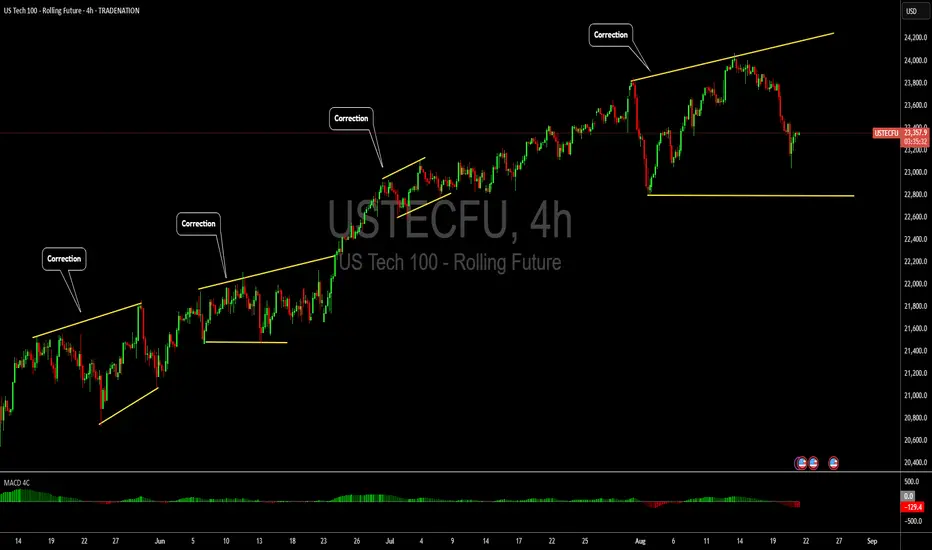
Financial markets, by their very nature, do not move in a straight line. Prices fluctuate, trends develop, and corrections occur along the way. While it is tempting to expect that an upward rally will continue indefinitely, the reality is that markets require pauses and pullbacks to remain healthy. As shown in the chart above markets will always pull back (taking breathers as they move up).
One of the primary reasons markets correct is profit-taking. Early investors, who entered positions at lower prices, often choose to lock in gains once prices rise to attractive levels. Their selling creates temporary downward pressure, leading to corrections. This cycle of entry, accumulation, and profit-taking is not a sign of weakness, but rather a natural rhythm of market activity.
Corrections also serve a vital purpose: they prevent markets from overheating. Extended rallies without pauses often create unsustainable valuations, increasing the risk of a sharp reversal. By allowing prices to retrace, corrections provide opportunities for new investors to enter at fairer levels and for existing investors to add to their positions more strategically.
History consistently shows that long-term market growth is built on a series of advances punctuated by corrections. Even in strong bull markets, prices rarely move in a linear fashion. Instead, they climb higher through a stair-step pattern—rising, correcting, consolidating, and then resuming their upward momentum.
For investors, this means corrections should not always be viewed with fear. Instead, they can be seen as opportunities. As Warren Buffett often reminds us, the key is not to follow the crowd into overbought territory but to wait patiently for value.
Recognizing that they cannot move in a straight line equips investors with patience and perspective—two of the most valuable traits in successful investing.
Disclosure: I am part of Trade Nation's Influencer program and receive a monthly fee for using their TradingView charts in my analysis.

NASDAQ | Bearish ContinuetionNASDAQ has not yet broken its descending parallel channel as well as it has not broken its lower high.Moreover there is no divergence on RSI which indicates the continuetion pattern.

NAS100 Analysis – Bullish Channel Break & Retest in Progress📌 Key Highlights:
Bullish Channel Broken: Price failed to respect the upward trend channel. Although the candle bodies held above a support zone, price wicked through to test a lower level – indicating a weakening bullish structure.
Pressure Reversal Zone: Around 23,800, price ran out of momentum. Downward pressure entered the market, shifting the trajectory and breaking the previous bullish pattern.
Confirmed Zones via Retest: Each zone was respected by a clean retest, reinforcing their validity as support/resistance areas. This is textbook price action – confirming zones before continuation.
Current Candle Behaviour: The most recent green candle has no top wick, showing strong buyer conviction. However, the bottom wick is long, meaning bears are still present and applying pressure.
Decision Point: We’re at a critical moment. Will price break above this level to reclaim the channel — or reject and fill the imbalance left behind by the last bullish move?
📉 Scenario 1 – Rejection & Continuation Down
If price fails to break and close above this resistance, we could see a bearish continuation — potentially aiming for the next key support zone around 22,677.
📈 Scenario 2 – Bullish Recovery
If bulls maintain strength and close above this level with volume, we could see price climb back toward 23,500+ to retest the upper zone.
✅ Bearish Bias
Price broke below the bullish channel structure (a major technical shift).
Retests have confirmed lower zones — typical bearish continuation behaviour.
The current green candle has no upper wick (buyers trying to push), but a long lower wick shows bears are still active.
Downward pressure has already shifted momentum, and we’re now waiting to see if the zone holds.
🟡 However – Confirmation Needed
If price fails to break above this current resistance zone, then bearish continuation becomes confirmed.
If price closes strong above this level and reclaims the channel, the bias would shift neutral to bullish again.
📌 Final Bias Statement:
Bearish bias for now — unless price cleanly breaks back above the resistance zone. Current price action suggests a possible continuation down to fill the wick and test deeper support zones.
🧭 Watching for:
Candle body closures above or below key zones
Wick reactions showing liquidity grabs
Momentum shifts in volume
🔔 Stay sharp. Trade with confirmation, not emotion.
By AutoMarkets | Built. Not Begged.

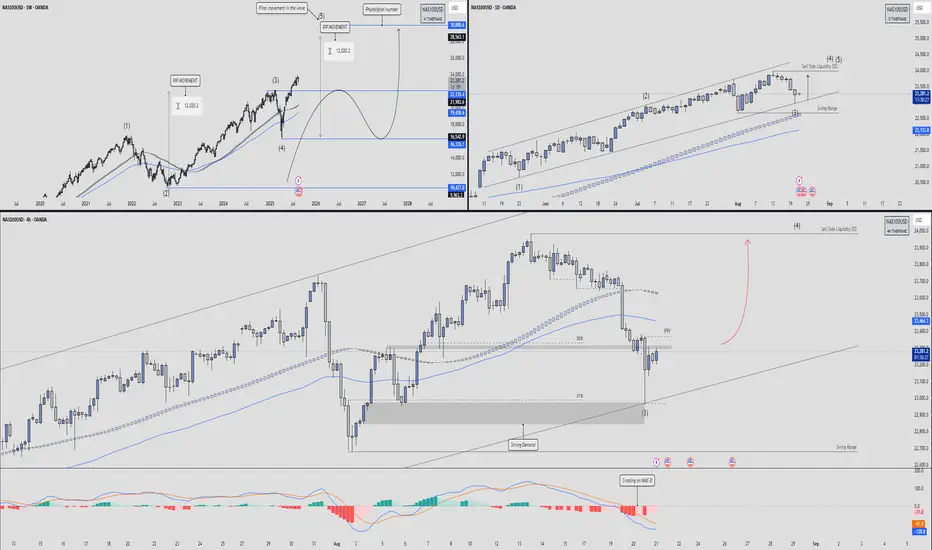
NAS100USD - Overview with Trade Idea🕰 Weekly View (Big Picture)
The Elliott Wave structure is playing out cleanly:
Wave (1) topped → Wave (2) corrective pullback.
Wave (3) extended strongly, now we’re inside Wave (5).
Price is showing final movement within the wave cycle, meaning the index is likely topping out.
A measured move of ~12,000 pips matches the symmetry between Waves (1–3) and (3–5).
Key downside retracement zones:
21,133 – 19,736 → first major support block.
16,352 – 16,351 → deeper retracement zone if momentum collapses.
Ultimate liquidity magnet sits around 10,427, but that’s long-term.
📉 Daily Structure
Market traded inside a rising channel, with the last leg forming Wave (5).
Current price action is rejecting sell-side liquidity, hinting at weakness.
Breakdown of the swing range → momentum shift underway.
Strong support rests near 22,133, aligning with the 200 EMA cluster.
Loss of that level = higher probability of completing Wave (4) retracement.
⏱ 4H Breakdown
The 4H chart shows the short-term battle:
Price wicked into the 71% retracement and tapped strong demand.
Currently consolidating inside a corrective bounce zone.
The 50% retracement and IPH level (~23,450) act as immediate resistance.
Expectation:
If supply holds, we rotate lower to re-test demand at 23,000 – 22,800.
If buyers defend, a relief push into 23,600 – 23,800 is possible before selling resumes.
🎯 Trade Plan
Bias: Short-to-mid term bearish (retracement phase of Wave (5)).
Entry Zone: Look for rejection around 23,450 – 23,600.
Target Zones:
First take profit → 23,000 – 22,800 demand.
Secondary target → 22,133 swing level.
Invalidation: A clean break and hold above 23,800 – 24,000 would re-open bullish continuation.
Risk Management: Trade within the channel structure, size down due to volatility.
NAS100 ATH or what? optimism coming back or no? Chyna CHyna CHyNAS100 ATH or what?
optimism coming back or no? Chyna CHyna CHyna? or no CHyna? let us know~~
we caught april bottom now run ATH?
🐉We value full transparency. All wins and fails fully publicized, zero edit, zero delete, zero fakes.🐉
🐉Check out our socials for some nice insights.🐉
information created and published doesn't constitute investment advice!
NOT financial advice

NAS100 BUY TECHNICAL ANALYSIS.nas100 buy technical analysis. price came down and touched support levels and now broke through this bear trend line. now the bear trend line will act as support all the way to resistance levels. gte vip breakout strategy!

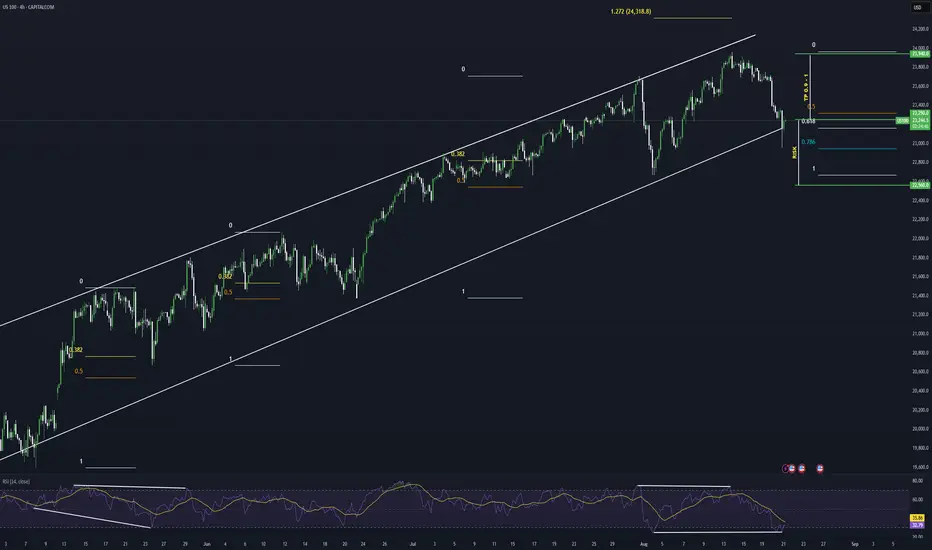
NASDAQ Potential Bullish ContinuationNASDAQ price action seems to exhibit signs of potential Bullish momentum as the price action may form a credible Higher Low with multiple confluences through key Fibonacci and Support levels which presents us with a potential long opportunity.
Trade Plan:
Entry : 23250
Stop Loss : 22560
TP 0.9 - 1: 23870 - 23940
USTEC INCOMING BEARISH MOVEMy analysis shows that there's a high chance the bearish move will continue. As we can see the price broke below our Uptrend Channel and made some sort of Double Top signifying a drop in bullish move.
Price then broke our major low, creating CHoC and confirmed a bearish move, now we see that it broke below the Previous low and made a deep retest to the zone, we can anticipate the price will continue going down but we will need candlestick confirmation for that
This is my intake of what will happen, follow for more Technical analysis and don't miss out😉

Profit-taking hits NASDAQ100: Uptrend still intact? The NASDAQ100 extended its losing streak as investors keep taking profits in tech stocks
Advanced Micro Devices and Broadcom each lost around 1%. Intel slid over 7%. Apple , Amazon , Alphabet , and Tesla also posted losses. Market volume typically falls in late August, which can lead to wilder swings.
The index has now broken below 23,600 and is trading near 23,300, marking its steepest pullback since late June. The short-term trend that began in mid-July is still possibly intact, with higher highs and higher lows. However, volume on down days suggests sellers are active, which may reinforce near-term downside pressure.

US100 Bearish Breakout!
HI,Traders !
#US100 made a bearish
Breakout of the key horizontal
Level around 23711.6 and the
Breakout is confirmed so we
Will be expecting a further
Bearish move down !
Comment and subscribe to help us grow !

Is this the top? SPY/QQQ Plan Your Trade Update For 8-20I know it has been a while since I shared a video.
This video is designed to share the downside risks I see as a potential for the markets IF this big speculative phase unwinds like I think.
Ultimately, you guys are the ones who will be making the trading decisions. I just want you to be aware that the markets are extremely volatile right now and the data is pointing to a very clean Excess Phase Peak (EPP) pattern.
As you are all aware, the EPP pattern suggests that a breakdown in price is likely where price may attempt to target the FLAG LOW.
If that happens, be prepared for a -15% to -20% breakdown in price before the end of 2025 - possibly seeing an even bigger price collapse.
In my opinion, this breakdown is the result of a broad unwinding of excesses related to the Biden economy (free money) and a move towards more reasonable US economic policies.
Overall, this pullback is necessary for the Wave 1 of Wave 5 structure to complete. Once this pullback is complete, the bigger rally phase (Wave 3 of Wave 5) will begin. And get ready for a big rally phase with Wave 3.
So, I hope this video helps you learn how to identify and plan for some of the biggest price swings in the SPY/QQQ, and prepare for even bigger moves in Gold/Silver and Bitcoin.
Get some.
#trading #research #investing #tradingalgos #tradingsignals #cycles #fibonacci #elliotwave #modelingsystems #stocks #bitcoin #btcusd #cryptos #spy #gold #nq #investing #trading #spytrading #spymarket #tradingmarket #stockmarket #silver

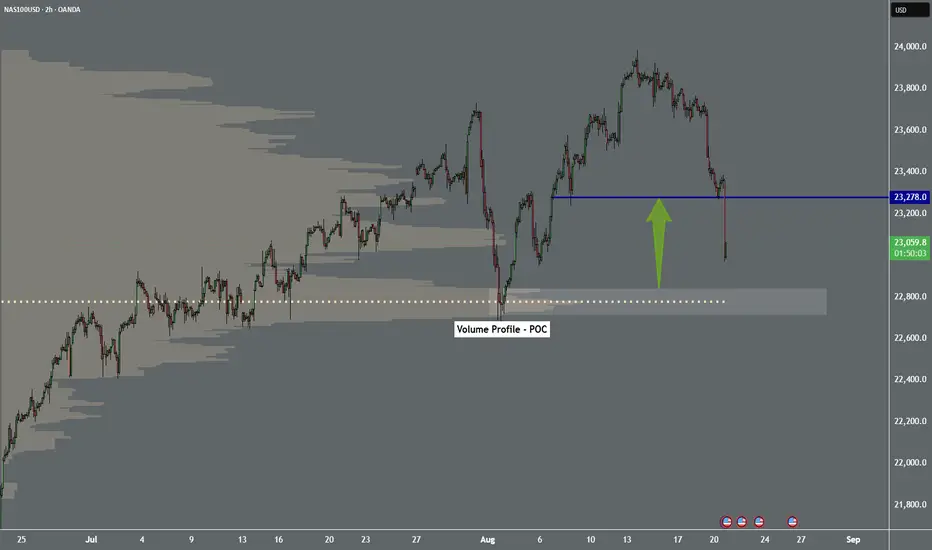
NAS100 - Volume ProfileDear Friends in Trading,
Expect a strong bounce from POC area.
I sincerely hope my point of view offers a valued insight.
Thank you for taking the time study my analysis.
NASDAQ (CASH100) – Buy the Dip or Trend ReversalThe Cash100 has been trending in an upward channel since May 2025.
Today, price has broken through diagonal support.
For confirmation that the upward channel is over, I will be looking for these signals:
✅ First signal: a 4H close below diagonal support.
✅ Second signal: a retest of the diagonal. If price fails to reclaim,
I’ll start looking for short setups if both signals above confirm.
What do you think — is the uptrend finally breaking, or will buyers step back in? 👀
Thanks for checking out my post! Make sure to follow me to catch the next update. If you found this helpful, give it a like 👍 and share your thoughts 💬 — I’d love to hear what you think!
Please note: This is not financial advice. This content is to track my trading journey and for educational purposes only.

When Could Nasdaq's Bearish Momentum Shift ?U.S. stock indices are showing slight declines as investors digest mixed corporate earnings and await key signals from the Federal Reserve, as well as a report from the Massachusetts Institute of Technology, which warned against the hype surrounding artificial intelligence, noting that this technology needs more time to clarify the extent of its reliance. Weak retail results, including a sharp drop in Target’s sales, weighed on market sentiment, while traders remain cautious ahead of the release of the Fed’s July meeting minutes and the upcoming remarks from Chair Jerome Powell on Friday, August 22, at the Jackson Hole conference, searching for clues about the future path of interest rates.
The Nasdaq Composite, dominated by the technology sector, closed Tuesday down 1.4%, marking its largest one-day drop since August 1, while maintaining its downward momentum on Wednesday, August 20.
What can be monitored from a technical perspective to anticipate a potential correction in this index?
Traders should watch the exponential moving average (5), which indicates market momentum (positive when the fast moving average (5) is below the price, and negative when it is above the price). This indicator provides short-term signals of momentum shifts in the markets. As seen in the chart above, if the price rises above the exponential moving average (5) and closes a candle above it on the four-hour timeframe, one should then watch the Relative Strength Index (RSI) to move above 50. In this case, we could see a temporary shift in Nasdaq’s downward momentum toward a short-term upward momentum.

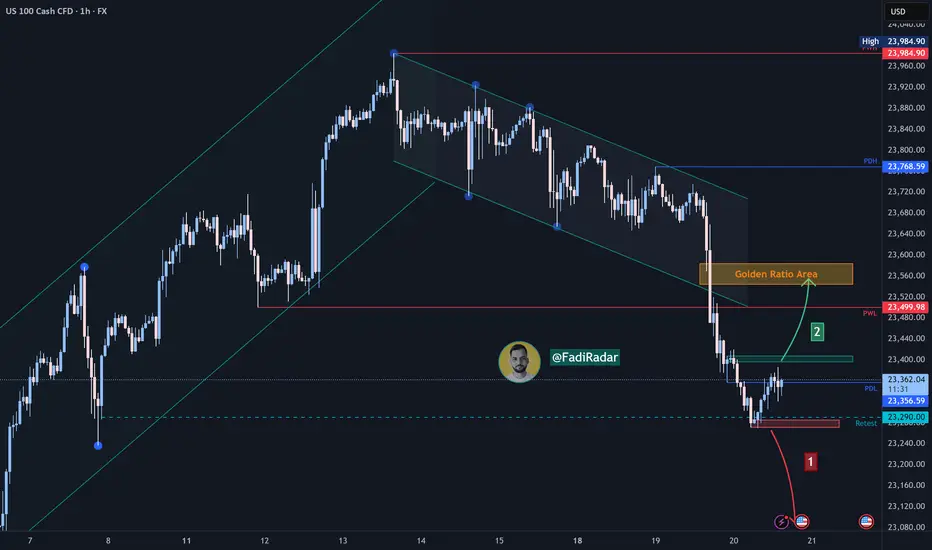
NASDAQ Index (US100 / NASDAQ) AnalysisThe index is moving in a bullish trend on the higher timeframes (Daily – H4), while showing a bearish move on the 1H timeframe. Currently, it is trading near the 23,340 area.
🔻 Bearish Scenario:
If the price breaks below 23,270 and holds, it may head to retest 23,080.
🔺 Bullish Scenario:
If the price manages to break and hold above 23,400, this could support a continuation towards 23,560 (a potential reversal zone – Fibonacci golden area). However, if buying momentum continues, the path could extend towards 23,680.
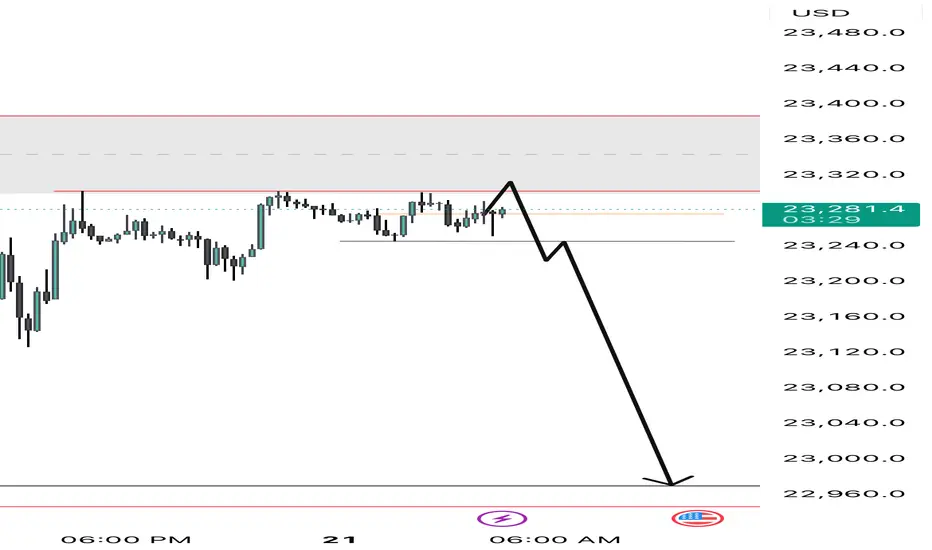
Nasdaq BSL SweepExpecting for BSL to be sweep... before the Sell continuation.
Waiting for #PPP entry model

NSDQ100 corrective pullback supported at 23233Tech drag dominates: The NASDAQ fell -1.46%, its worst day since Aug 1, led by the Magnificent 7 (-1.67%). Nvidia (-3.5%) was the biggest loser and set the tone for semis and AI-linked names.
Index divergence: Despite the cap-weighted S&P falling (-0.59%), the equal-weighted S&P rose (+0.45%), showing the selloff was tech-concentrated rather than broad. That highlights rotation into cyclicals/defensives away from mega-cap tech.
Stock specifics:
Intel (+6.97%) surged on the $2bn SoftBank stake, bucking the chip weakness.
Home Depot (+3.17%) outperformed on earnings, showing consumer/housing resilience—positive for broader equities but less relevant for tech.
Rates backdrop: 10yr UST yields fell -2.7bps to 4.31% after S&P affirmed the US AA+ rating. Lower yields normally support growth/tech, but today’s positioning and rotation outweighed rate relief.
Fed/policy watch:
Treasury Sec. Bessent hinted at Fed Chair decision timing (Powell’s replacement watch).
Markets remain priced for a jumbo cut in September, with focus shifting to Jackson Hole this week—key risk event for Nasdaq given rate-cut sensitivity.
Geopolitics: Noise around Ukraine security guarantees and Switzerland’s peace-talk stance was not market-moving for tech.
Relevance for NASDAQ100 traders:
Yesterday’s selloff was tech-specific, not broad market weakness, implying concentration risk in mega-caps.
Intel’s rally shows idiosyncratic catalysts can break correlation.
Watch Jackson Hole & Fed rate-cut pricing → likely main driver for Nasdaq100 short-term.
Rotation risk: If the equal-weighted S&P keeps outperforming, the Nasdaq may underperform further unless big tech regains leadership.
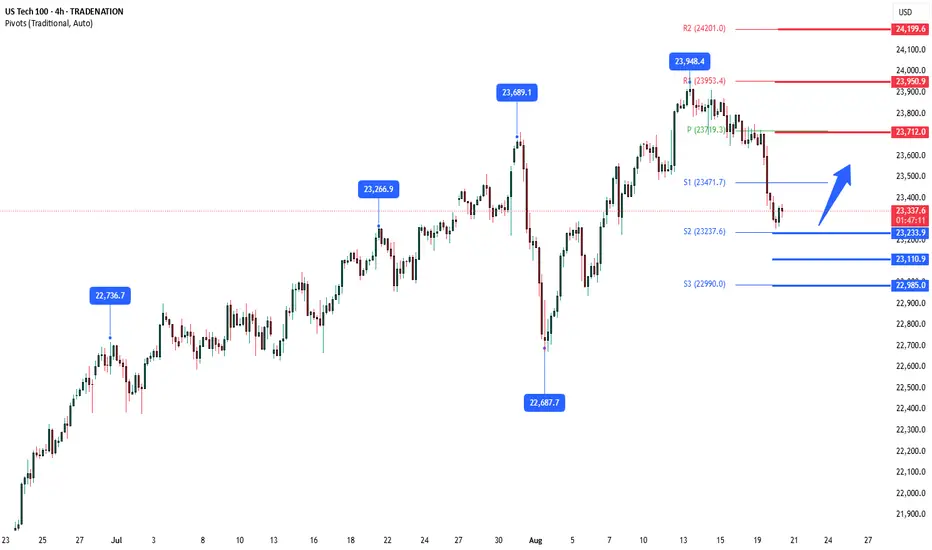
Key Support and Resistance Levels
Resistance Level 1: 23710
Resistance Level 2: 23950
Resistance Level 3: 24200
Support Level 1: 23233
Support Level 2: 23110
Support Level 3: 22985
This communication is for informational purposes only and should not be viewed as any form of recommendation as to a particular course of action or as investment advice. It is not intended as an offer or solicitation for the purchase or sale of any financial instrument or as an official confirmation of any transaction. Opinions, estimates and assumptions expressed herein are made as of the date of this communication and are subject to change without notice. This communication has been prepared based upon information, including market prices, data and other information, believed to be reliable; however, Trade Nation does not warrant its completeness or accuracy. All market prices and market data contained in or attached to this communication are indicative and subject to change without notice.