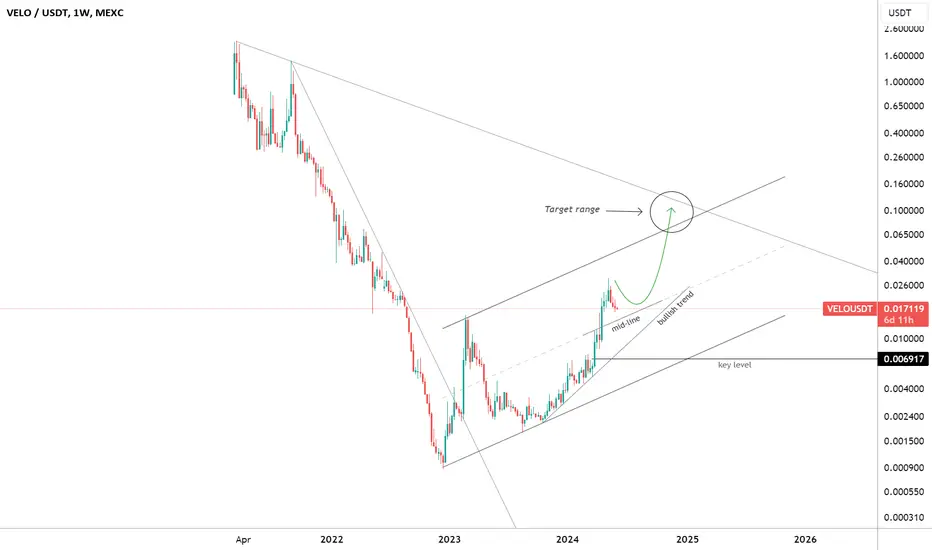
✴️ Velo Update (700% Potential Growth Mapped)I am using the same chart used in July.
For VELOUSDT, I am using an internal trendline to remove the excesses.
The "May support" broke down in August but now VELOUSDT is trading back above it, regaining the bullish bias.
The breakdown ended in a higher low compared to January 2023, a very strong bullish signal.
👉 The August drop is literally an extension of the correction that started in February. As volume can be clearly seen going lower and lower as the correction extends, it signals that the bears are losing strength. With Velo now trading back above its May support, we can expect the next wave to develop within this or next month.
This is an easy one... Patience is all that is needed, potential is huge.
👉 We are looking at 200%+ easy/fast and over 700% mid-term.
Namaste.
Trade ideas

✴️ Velo One Month Later & 940% PotentialThis is the exact same chart, I only moved the green arrow a little bit to the right.
You know what I keep on saying, "Patience is key".
This pair continues consolidating, going sideways with a downward bent; This is normal and bullish or we can say neutral.
The bullish bias described in previous trade ideas remains valid, the chart technicals are the same.
As long as VELOUSDT trades above the orange trend lines, we can expect prices to go up... Notice the trading volume becoming weaker and weaker... The lower it goes, the closer we get to the bullish breakout and a bullish breakout will definitely take place; When?
The breakout can happen within hours just as it can take weeks or days.
We can't predict the exact date as to when a certain move will show up but we can predict with a very high level of accuracy the direction of the move and the target, so all we need is patience to trade these charts.
Some charts will breakdown and the analysis will fail, that's ok.
The majority will move just as the chart shows.
We have a bullish chart and so we expect additional growth.
Namaste.

$velo Expecting Velo to pump really hard if breaks strongly 0.0030$ , next stop would be 0.0060 , long term could get to 0.25$ , enjoy the ride folks

4 reasons to invest in #VELO??!1-The first reason (weekly time frame):
Approaching its own support levels means the last uptrend and weekly pivot level
Moreover, it is located in an BULLISH channel and it started to fall before reaching the HIGH of this channel. And maybe IT wants to move again towards the HIGH of the channel or at least his previous HIGH.
2- The second reason (daily time frame):
The downward movement has taken more time compared to its previous growth
And it has reached the 50% level of S1 and S2 of the pivot indicator, which is a very important level for forming a bottom
Be pessimistic about another drop, the S2 level of the daily time frame pivot is suitable for growth
3- The third reason (time frame of 4 hours)
Reaching the bottom of the BEARISH channel as well as the S2 level of the pivot indicator in the 4-hour time frame emphasizes the possibility of making a bottom from this area.
4- The fourth reason (time frame of 4 hours)
Seeing high red volumes during the recent DROP, which can then turn into an upward movement (pump).
Targets in order from short term to long term:
Target 1: 0.01405 (+40%)
Target2: 0.01845 (+80%)
Target3: 0.026 (+150%)
This analysis and reasons are my personal opinion and you make the final decision yourself
Comment your opinion

VELO ON Weekly Dear Traders,
i expect velo to reach this target on the weekly 0.00184
lets see how it can play

VELO.USD Bullish Bat PatternVelo a token on Stellar Blockchain.
Bullish Harmonic Pattern in a Bullish Market.
This is on the 1Hr timeframe.
▪ tp1 = 27%
▪ tp2 = 44%
▪ tp3 = 69%
Stops just below the previous low
Should price move to tp3 stops trail
▪Be Well
▪This has huge upside potental should price choose to break the previous high.
{target would be $1.3}

VELO | Support Vs ResistanceVELO is getting support on its previous resistance
If the selling pressure resumes and buyers gets active the optimum target will be 0.028

#VELO/ the most accurate roadmap!!Hello everyone
To grow from this dynamic support, it must be able to break the key resistance of 17,750 to the upside.
If this does not happen and on the contrary, it closes below 16600: it will fall to the support range of 15502-14578 and grow from there.
The targets are indicated in the figure

#VELO / the best buying levels in the long term.Hello everyone
In the figure, 3 levels
2 dynamics
and 1 static
I determined that in case of falling, #VELO can make a LOW from them and grow.
The long-term target range is shown in the figure
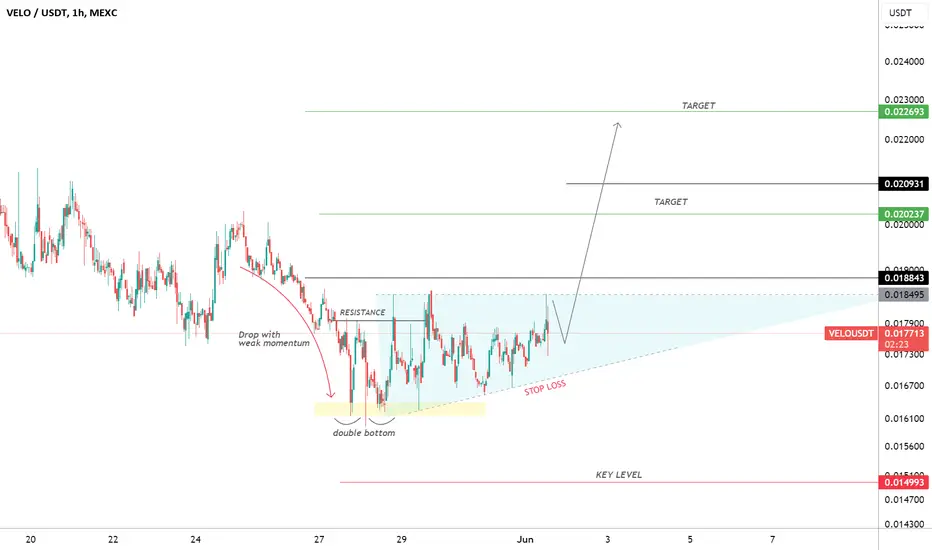
A growth of at least 30% is expected by #VELOHello everyone
A drop with weak momentum
In the continuation of the formation of the double bottom
And finally forming a triangle
This can be the foundation of a good growth
Do you agree?
VELO / Incredible buying opportunity!!Hello everyone
This currency is highly recommended for BUY
Details are shown on the FIG
Follow me to introduce you the best currencies

VELO USDTKUCOIN:VELOUSDT
At the request of friends...
This is a long-term analysis. I am very much looking forward to the price correction and I expect the price to fly upwards from 0.0105.
So we don't buy now!

trade based on price action on falling wedges this is one of my favourite paterns of price action in this case it took like 16 days to consolidate I expect now a movement for the upside also based on what VELO is. A good proyect based on AI with little Mcap.

VELO,bullishBuying some velo here , targeting that upper part of trendline at 3 cents.
This week might see velo at that target.


VELO PUMP IS COMINGVELO is perfectly following my plan and it's giving us a good opportunity to accumulate longs before it will pump hard. It's forming a nice range in the accumulation zone, and i expect a pump in the coming days. I think it will reach new local top before mid June.

VELO Approacing buy zoneVELO hit an important daily buy zone, perfect to accumulate longs and add to the spot bag. This is a liquidity support zone, where i want to see the price to range to give me enough time to buy. VELO is a strong coin to have in portfolio, and i i have as minimum target $1

Velo first target - second Buy2 weekly doji
Top side liquidity taken and closed below
Down side liquidity needs to be taken
target to trend line 0.005
5k investment x 60 = 300k

VeloOverbought/oversold with impulse MACD for bell on a 1 week chart. Sideways market on the chart. Wait for impulse mace line and signal line to cross over on the oversold line and that will signal a buy.

Velo/usdt. one direction Seems to have one direction.
Obviously uptrend.
Iam not a financial advisor.
Trust your thoughts

VELOUSDTSince its inception, it has created a very large falling wave, and now there are only three corrective upward waves that end in the region from the two above, and then the decline will continue to test its historical bottom or break it.
The data is placed on the chart


Velo Price Surge Alert! 📈 - Your Path to Wealth Starts Here**Technical Analysis Chart Description:**
Welcome to my Technical Analysis charts on TradingView! Before we dive into the analysis, it's essential to understand some important warnings:
1. **Subjectivity Alert:** Technical analysis involves interpreting market data and chart patterns, which can be subjective. Different analysts may interpret the same data differently, leading to varied conclusions.
2. **Historical Performance Doesn't Guarantee Future Results:** Past price movements do not guarantee future price movements. While historical data can provide insights, it's crucial to consider other factors that could influence price action.
3. **Risk of False Signals:** Technical indicators and chart patterns can produce false signals, leading to potential losses if relied upon blindly. Always cross-verify signals with other indicators or fundamental analysis.
4. **Market Volatility:** Crypto markets are highly volatile and can experience rapid price fluctuations. Be prepared for sudden and unexpected price movements, which may invalidate previously identified patterns.
5. **Risk Management:** Proper risk management is essential. Never invest more than you can afford to lose, and consider using stop-loss orders to mitigate potential losses.
6. **Emotional Bias:** Avoid emotional decision-making based on short-term price movements. Stick to your trading plan and strategy, and don't let fear or greed influence your decisions.
**Disclaimer for Crypto Trading:**
Trading cryptocurrencies carries inherent risks, and it's important to understand the following:
Cryptocurrency markets are highly speculative and can be subject to extreme volatility. Prices can fluctuate significantly within short periods, leading to substantial gains or losses.
Investing in cryptocurrencies involves the risk of total loss of capital. Unlike traditional assets, cryptocurrencies are not backed by any tangible assets or central authority, making them inherently risky.
Regulatory uncertainty and market manipulation are additional risks associated with cryptocurrency trading. Regulatory changes or negative news can have a significant impact on prices.
This analysis is for informational purposes only and should not be construed as financial advice. It's crucial to conduct thorough research and consult with a qualified financial advisor before making any investment decisions in the cryptocurrency markets.
By using this analysis, you acknowledge and accept the risks associated with cryptocurrency trading and agree to trade at your own discretion. The author of this analysis shall not be held responsible for any losses incurred as a result of using the information provided.
