Relative Strength Tipped Off AAPL’s Rally Before Price DidAbove is a 5-minute chart of AAPL, and in the lower pane, I’ve plotted the ratio line of AAPL versus SPY. What really caught my attention this morning was what happened around 10:00 ET. While AAPL itself had only opened slightly higher, the ratio line had already broken out to a new high. That was the early clue, the relative strength line was quietly signaling that AAPL was outperforming the market before the actual price move confirmed it.
TheRelativeStrengthTrader
Trade ideas

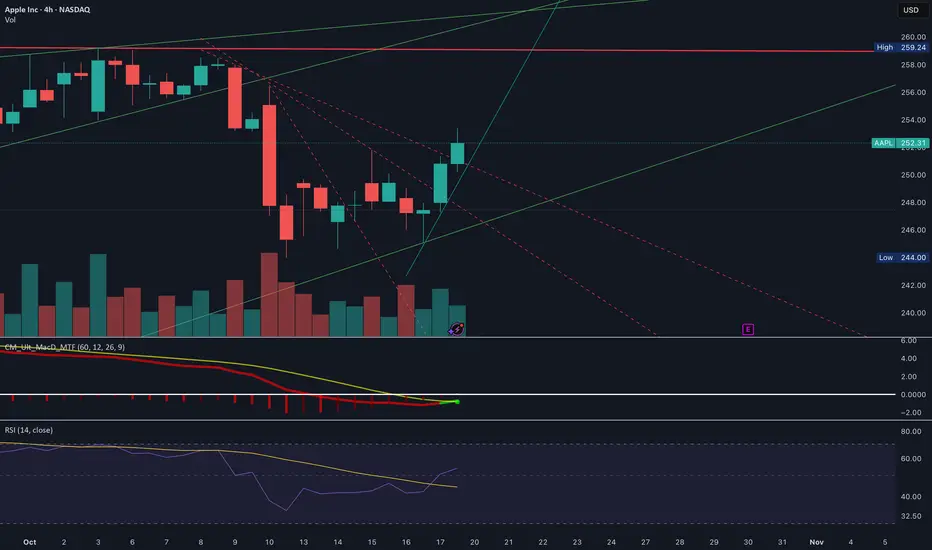
Apple (AAPL) – Potential Short-Term UpsideOn the 4-hour chart, Apple began a noticeable downward trend around October 8. That trend appears to have shifted around October 16, when the stock hit a low of $245. Since then, it has rebounded to approximately $252.
The strength of this bounce suggests the possibility of continued upward momentum in the short term, potentially lasting through the week leading up to earnings on October 30. Traders may want to watch for support near $245–$248 and resistance near $255–$257, which could indicate the next potential price moves.
AAPL Gamma Battle Zone - Oct 21–25AAPL Gamma Battle Zone – Bulls Testing the $255 Ceiling Ahead of Earnings 🔥
🟩 Daily Timeframe – Macro Market Structure
AAPL continues to ride within a clean ascending channel, maintaining higher highs and higher lows since the August reversal. The daily trend remains bullish overall, with price currently hovering near the upper midline of the channel.
Last week’s rejection near $259–$260 showed short-term exhaustion, but the stock found solid support at $244–$247, a key demand area tested multiple times since September. This zone coincides with the previous CHoCH and liquidity sweep, where institutional buyers likely accumulated positions before the next leg up.
If AAPL can sustain above $252, bulls may attempt another push into the $258–$260 supply zone — a critical decision area where we could see either renewed breakout momentum or another round of distribution.
🟦 1-Hour Timeframe – Structure, Momentum, and Volume
The 1-hour chart shows a clear BOS (Break of Structure) following last week’s CHoCH near $247, confirming the transition back to a short-term bullish structure. The move from $247 → $252.5 came with increasing volume and clean EMA alignment, suggesting solid intraday demand.
Price is now coiling under $253–$255, the first major resistance level in this new leg. Expect some chop here as liquidity builds before the next impulsive move.
* 9 EMA crossed above 21 EMA and both are pointing upward — short-term bullish momentum intact.
* MACD histogram remains positive but flattening, showing early signs of momentum cooling.
* RSI sits around 60–65, leaving room for another push before overbought territory.
As long as AAPL stays above $250.5, the bias remains bullish. A break below that would weaken short-term structure and could trigger a retest of the $247 zone.
🟨 15-Minute Timeframe – Intraday Precision Zones
The 15-min structure gives the clearest roadmap for intraday traders. AAPL formed multiple BOS and CHoCH swings between $247–$253, with the latest impulse leg rejecting just below $254, a minor liquidity pocket inside the daily supply zone.
We’re now seeing consolidation just above $250–$251, an important area where micro-liquidity is stacking. This zone may serve as an intraday pivot — break below it, and bears can drag the price to $248.5–$247.5. Hold above it, and bulls could reload for another retest toward $255.
Momentum indicators show a cooling phase:
* MACD histogram has started to fade, hinting at short-term consolidation or pullback.
* Stoch RSI has cycled down from overbought but hasn’t yet reset fully — watch for crossovers near the lower band as early reentry signals.
Expect liquidity sweeps around $251–$252.5 early in the week before any meaningful direction confirms.
🟥 GEX (Gamma Exposure) & Options Sentiment – The Dealer Map
Gamma data paints a textbook pinning setup for the week:
* Highest positive GEX / Call resistance: around $255–$260 — heavy dealer hedging pressure could cap upside.
* Strong Put walls: $245–$242, directly aligning with the key daily demand.
* Max Pain: near $250, often acting as a gravitational anchor when volatility compresses.
* IVR 25.9, slightly under the 30-day mean, suggests option premiums are cooling, favoring range compression early week before a potential directional breakout.
Dealer positioning currently supports a neutral-to-slightly-bullish gamma environment, meaning dips may find hedging support, but large rallies will likely face dealer sell pressure near $255+.
Trade alignment thoughts:
* Scalpers: Favor quick long scalps above $251.5 with targets $254–$255, keeping tight stops.
* Directional traders: Watch for daily close over $259 to confirm breakout continuation.
* Options players: Debit spreads or neutral iron condors between $250–$255 align with current GEX pin zone.
🎯 Trade Scenarios
Bullish Setup 🟢
* Entry: Above $252.5–$253 after a confirmed candle close.
* Targets: $255, then $259.
* Stop-loss: Below $249.8.
* Bias confirmation: MACD expansion and RSI > 60 on both 15M and 1H.
Bearish Setup 🔴
* Entry: Rejection from $255–$257 or break below $250.5.
* Targets: $247 → $244.
* Stop-loss: Above $258.5.
* Bias confirmation: MACD bearish crossover + RSI < 45 with EMA slope turning down.
🧭 Closing Outlook – Week of Oct 21–25
AAPL starts the week near equilibrium between demand ($247) and supply ($255). Expect early-week compression as dealers pin around $250–$252, followed by a potential gamma-driven breakout later in the week.
If bulls defend $250, the structure favors another push toward $258–$260. Failure to hold that zone, however, could trigger a controlled pullback into the $247 support block.
I’ll be watching closely for liquidity traps near $251–$252 — if price sweeps that zone and reverses with volume, it could mark the next momentum ignition for bulls.
Disclaimer:
This analysis is for educational purposes only and does not constitute financial advice. Always perform your own due diligence and manage risk accordingly.

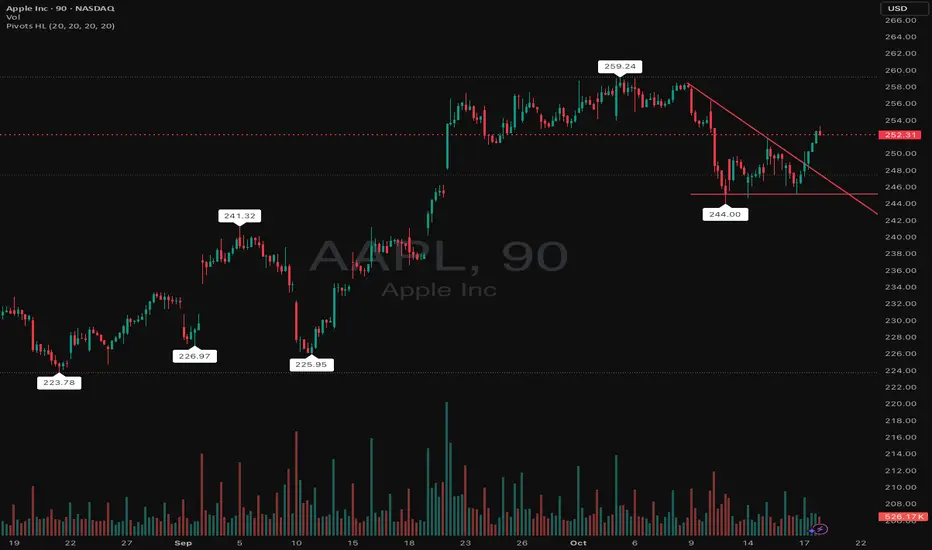
AAPL - A true breakout toward ER or BULL TRAPHappy Sunday.
On High Watch of this week is AAPL.
It has kinda formed a triple bottom here. The bounce from $244 forms a higher low, showing buyers stepping in. Breaking above the trendline resistance shifts the short-term structure to BULLISH. Next target if momentum continues is $256-$259 zone, which was the previous resistance cluster. However, if the price falls below $250 then this breakout is a bull trap. Below $244 then Bearish continue.
Trade Alert: $AAPL NOV 07 2025 $255 CALLS – 128% ROI Target inEnter: NASDAQ:AAPL NOV 07 2025 $255 CALLS
Buy in Price: $6.70 - $6.75
Take Profit: $15.28
Stop Bleeding: $5.90
ROI Potential: 128%
Exit Within: 2 Weeks
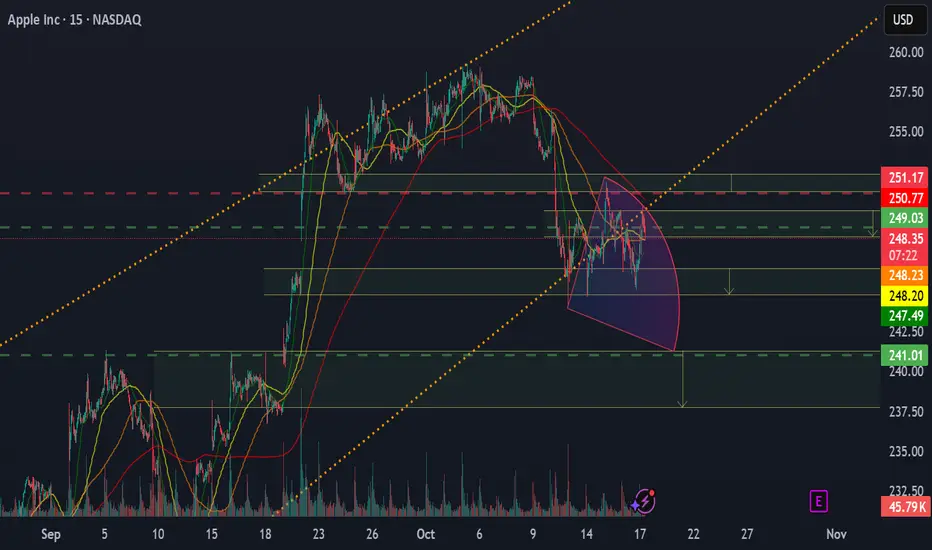
Apple short ideaApple looks overextended after the recent rally, showing signs of exhaustion near resistance. Price momentum is slowing, and volume confirms reduced buying pressure. I expect a short term correction as the market takes profits and sentiment cools down.
I am opening a short position with a target at 241. After that, I’ll review the situation and reassess the direction, but it’s very likely that we’ll correct deeper.
A break below the recent local lows could accelerate the move toward that level.
⚠️ Not financial advice.
$AAPL Buy levelUnlike NASDAQ:META , NASDAQ:AAPL is strong. If, however, NASDAQ:AAPL starts to come down, $225 offer a good level to go long off. $225 is also a level to sell puts against.
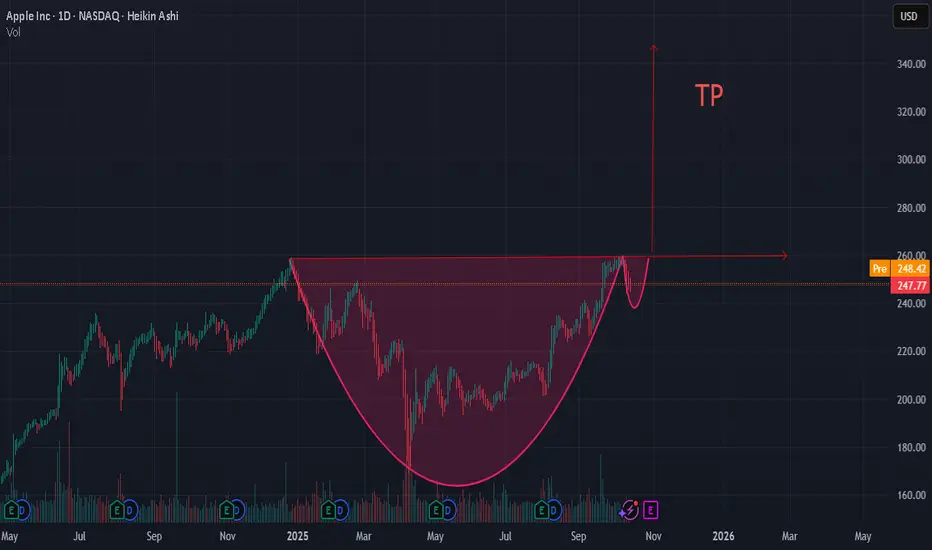
CUP AND HANDLE ON AAPL TP 340 LONGApple moves in a 10-15% range for years!
With lowering interest rates, and with quite low P/E ratio (32), compared to other companies in this industry, a new wave can begin!
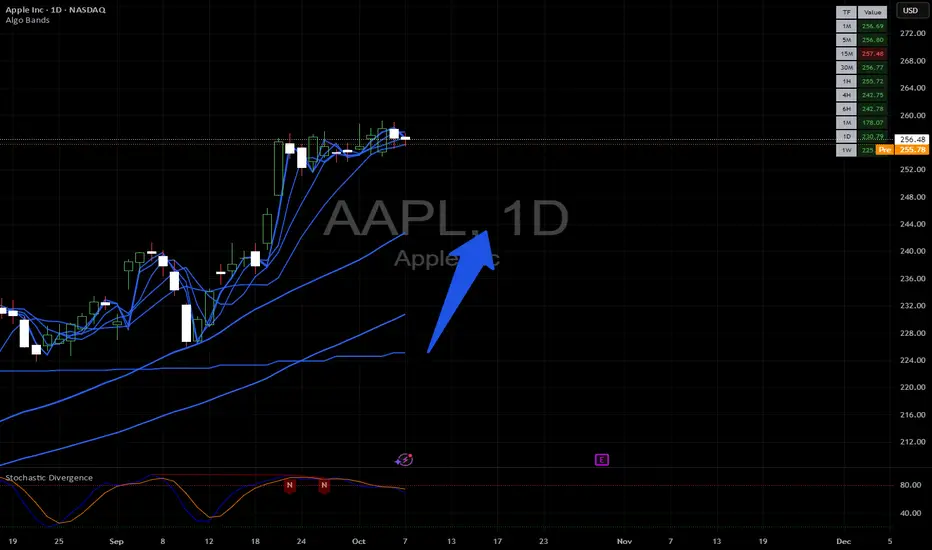
AAPL (Apple Inc.) on a 4-hour timeframe.AAPL (Apple Inc.) on a 4-hour timeframe.
Here’s what the chart shows:
The current price is around $247.80.
There is an uptrend line supporting the price.
Two target levels are marked on the chart with arrows pointing upward.
The Ichimoku cloud shows bullish momentum (price above the cloud).
📈 Marked Target Levels on Chart:
1. First Target: Around $256
2. Second Target: Around $268
📝 Analysis Context (from the chart)
The trend is bullish, supported by higher highs and higher lows.
Price is riding the trendline, and the cloud provides support.
First target seems to be a short-term breakout level, second is more medium-term.
⚠ Important Note:
These are technical analysis targets, not guaranteed future prices. Real market movement can differ due to macroeconomic news, earnings, or broader market sentiment.

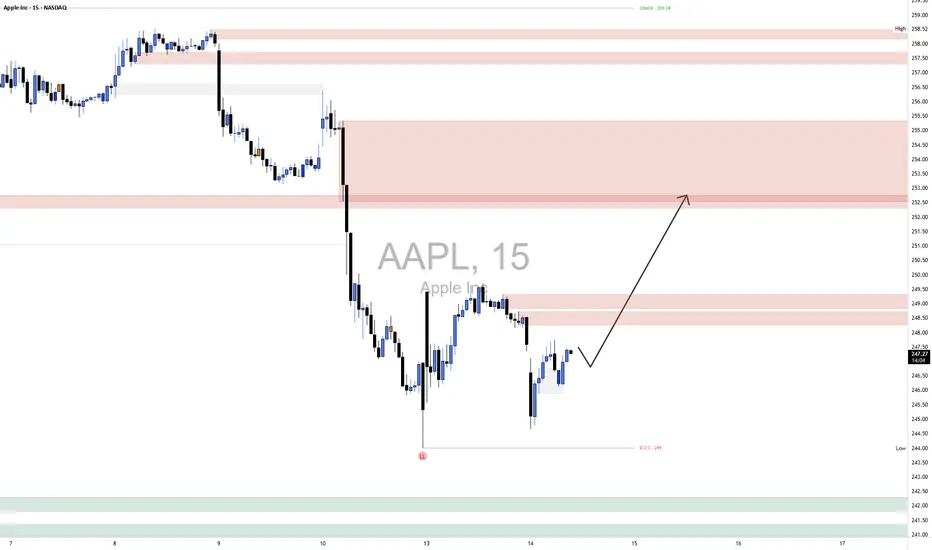
AAPL LongMarket Structure:
Apple remains in a short-term downtrend, following a clear Break of Structure (BOS) to the downside around $244, confirming bearish continuation from the prior lower high near $254. However, the recent candle formation suggests a possible Change of Character (CHoCH) as price begins to stall and form higher lows around the $246–$247 area, indicating early signs of accumulation.
Supply & Demand Zones:
The demand zone between $244 and $246 has shown a decent reaction—buyers stepped in with strength after a deep sweep of lows, suggesting that liquidity has likely been collected from resting stops below $245. The nearest supply zone lies between $248.5 and $249.5, where price previously dropped sharply, confirming the presence of aggressive sellers. The larger, more significant supply region sits higher between $252.5 and $254, the origin of the recent impulsive drop, making it a strong area for potential short setups if price reaches it.
Current Price Action:
Price is consolidating just above local demand, with small-bodied candles showing indecision but higher lows forming. The market appears to be preparing for a retracement move back into the $248–$253 range. The arrow path on your chart suggests a likely bullish correction toward the upper supply before sellers potentially re-enter.
Bias & Outlook:
The short-term bias is bullish, expecting a retracement toward $252–$253 before potential rejection. The key invalidation level for this scenario is below $244—a clean break beneath that would confirm bearish continuation and invalidate the recovery structure.
Momentum & Candle Behavior:
Momentum is neutral-to-slightly bullish, with shorter wicks on the downside and volume compressing near demand, indicating seller exhaustion. A bullish engulfing or strong breakout candle above $248 would confirm short-term momentum shift.
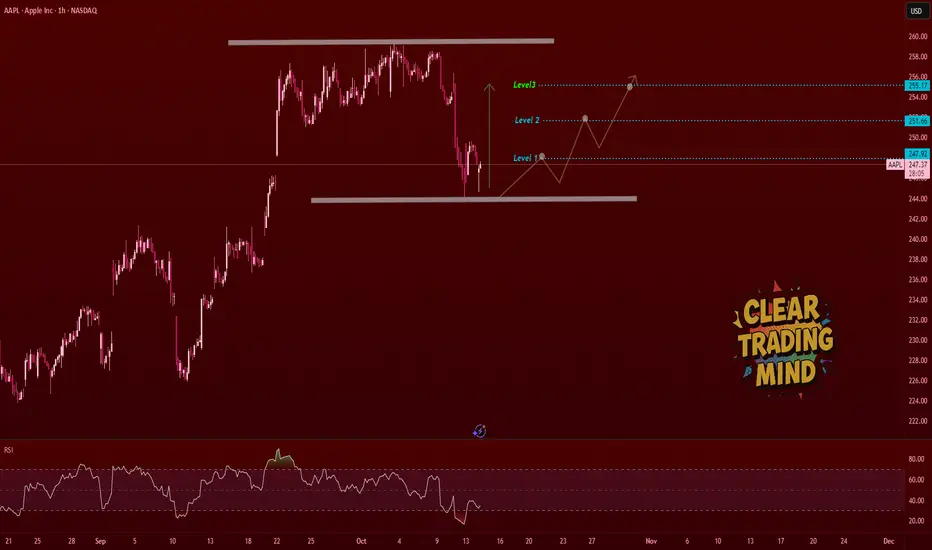
AAPL Bullish Outlook – Level-by-Level Breakout PlayApple is showing a potential bottom structure after rejecting the demand zone at the lower range.
Price bounced from the base and looks ready for a step-by-step move upward.
🔍 My Bullish Plan (1H Chart):
- As long as price holds the bottom range, I expect a recovery move.
- Watching price break each resistance step clearly:
🟢 Level 1 → 247.92
🟢 Level 2 → 251.66
🟢 Level 3 → 255.17
Once Level 1 breaks with strong momentum, I will look for intraday HL (higher low) or consolidation for continuation.
This zone looks good for scaling into bullish structure .
💡 Support Zone:
Marked demand base around 244.50 – strong previous reaction area.
⚠️ Invalidation:
If price fails to hold the demand zone and closes below the base, I’ll cancel the bullish bias.
🧠 Outlook Summary:
- RSI showing slight divergence hinting reversal strength
- Price at range low
- Multiple clean upside levels to work with
- Patience for breakout confirmation = key
Mean Reversion Setup: AAPL1. RSI in oversold region
2. Price likely to rebound back the the mean
Trade Rules:
Entry Trigger - RSI has cross below oversold region, enter limit buy at close price
Exit Trigger - Close at market when close price cross above exit trigger (Red Line)

AAPL Gap FillLooks like they got their gap fill after all... could push through ath now.
Also someone just bought $334.5 million in shares today
Will Apple’s Q4 Growth Send Shares Above $260? Current Price: $245.27
Direction: LONG
Targets:
- T1 = $252.00
- T2 = $260.00
Stop Levels:
- S1 = $240.00
- S2 = $235.00
**Wisdom of Professional Traders:**
This analysis synthesizes insights from countless professional traders and market experts, leveraging collective intelligence to identify high-probability trade setups for Apple. The wisdom of crowds suggests that aggregated perspectives from seasoned investors tend to yield more accurate predictions by reducing cognitive biases and uncovering consensus opportunities. Apple remains a favored investment among traders, with its strong fundamentals, consistent performance, and robust demand for its hardware ecosystem and services driving positive sentiment.
**Key Insights:**
Apple has consistently demonstrated remarkable revenue performance, even amid global challenges such as inflationary pressures and muted consumer sentiment. The company’s diversified product mix, including iPhones, Macs, wearables, and services, shields it from reliance on a single growth stream. The upcoming holiday season is likely to boost iPhone sales, particularly the higher-margin Pro and Max models introduced during the September 2025 event. Additionally, Apple’s services revenue, which encompasses subscription-based offerings like Apple Music, iCloud, and Apple TV+, continues to grow at an impressive pace, contributing significantly to profitability.
The company’s strong brand loyalty and pricing power uniquely position it as a premium player in the consumer electronics market. Moreover, signs of expanding gross margins in Q3 2025, driven by efficiencies in supply chain management and product mix optimization, enhance its outlook heading into Q4. With Apple thriving in the premium consumer segment globally, traders are eyeing further upside in its stock, fueled by strong fundamentals and seasonal tailwinds.
**Recent Performance:**
Apple’s share price has climbed steadily from the $230 mark in early September 2025, propelled by optimism surrounding its latest iPhone lineup and services growth. October has seen subdued volatility yet consistent buying pressure, lifting the stock to $245.27. Analysts have noted Apple’s resilience, as the broader market grapples with inflation concerns and interest rate hikes. With the company delivering a solid Q3 2025 earnings beat, traders have been increasingly confident about its prospects during the last quarter of the fiscal year.
**Expert Analysis:**
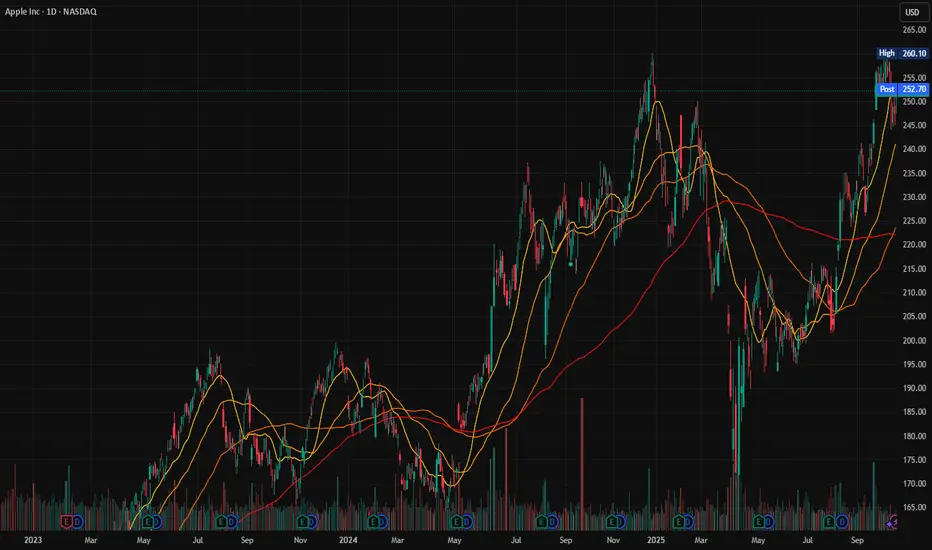
Technical indicators reveal bullish momentum for Apple. The stock is trading above its 50-day and 200-day moving averages, signaling strong upward momentum. Furthermore, a Golden Cross pattern emerged recently, confirming the positive trajectory. The Relative Strength Index (RSI) suggests the stock is not yet overbought, leaving room for further gains. Volume trends indicate a growing interest from institutional investors, while option activity shows bullish positioning heading into Q4 2025.
Fundamentally, Apple benefits from an expanding margin profile and record-breaking iPhone pre-orders, particularly for premium models. Experts believe macro conditions, like stabilizing interest rates, may boost consumer activity during the holiday season, aiding Apple's Q4 sales. Several analysts have reaffirmed their price targets, ranging between $260 and $280, citing continued strength across both hardware and services divisions.
**News Impact:**
Recent headlines surrounding Apple have been predominantly positive, focusing on strong demand for its newest iPhone lineup and expanding its ecosystem through innovative features like satellite connectivity and AI-enhanced camera technology. Additionally, Apple’s performance in the services business remains a key growth driver, with reports showing an uptick in paid subscriptions across multiple platforms. Q3 earnings revealed both gross and net margin expansion, signaling efficiency gains. The company’s ability to deliver consistent growth, even in challenging economic conditions, reinforces bullish sentiment heading into 2025’s final quarter.
**Trading Recommendation:**
Take a long position on Apple, targeting upside moves to $252 and $260 over the upcoming weeks. Seasonal demand trends coupled with bullish technical indicators provide a foundation for continued gains. Apple’s strong fundamentals and brand resilience make it a solid investment as the holiday spending season ramps up and the company further capitalizes on its services revenue growth. Protect downside risk with stops at $240 and $235, ensuring prudent risk management.
Do you want to save hours every week? Register for the free weekly update in your language!

A New iPhone Is Coming. Should You Upgrade or Just Fix Your Old This year, your best iPhone upgrade might be a fresh battery, a clean screen and some new software tricks. Plus, the extra cash you get to keep in your pocket.
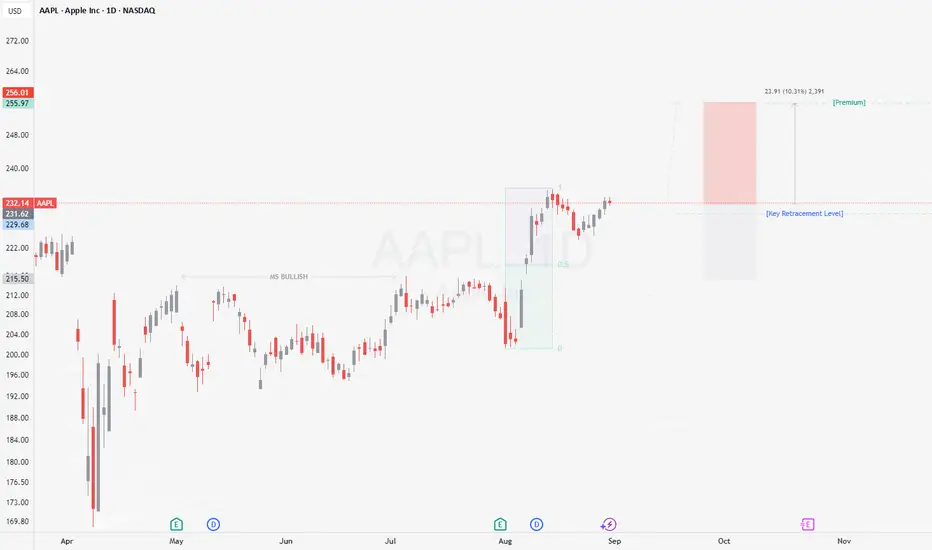
Is Apple still a buy?If we take a closer look, we can see that we could still enter around the $240–245 range and take profits at around $260. From a fundamental perspective, the numbers also look solid for the coming quarters. Although the fair value is estimated to be around $230 per share, we have to keep in mind that we’re talking about Apple — a company with high liquidity and strong cash flow.
Therefore, a difference of around +$15 (at $245) is not a major concern. The recent drop was mainly caused by the announcement of new tariffs, which pushed the price down artificially. We expect the stock to reach around $260 within the next two weeks. There is also strong support in the lower box area.

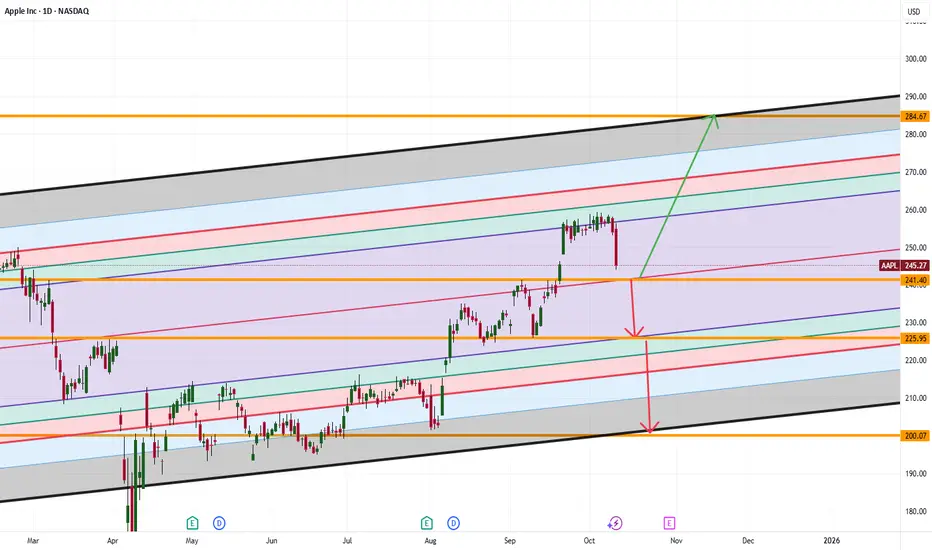
Apple’s $241 Bounce or Breakdown: Is This the Next Big Move?Apple’s stock price is moving down toward $241. This is an important zone. If Apple can stay above $241, it could jump up to $284. But if it falls below $241, the price might drop even more; maybe to $225 or even $200.
What do you think will happen next? Would you buy Apple if it drops to $241, or would you wait for a bigger move?
If you’re not sure what to do or have questions, ask me! Sometimes asking the right question gives you the answer you need to trade smarter. What’s your question about Apple right now?
Mindbloome Exchange
Trade Smarter Live Better
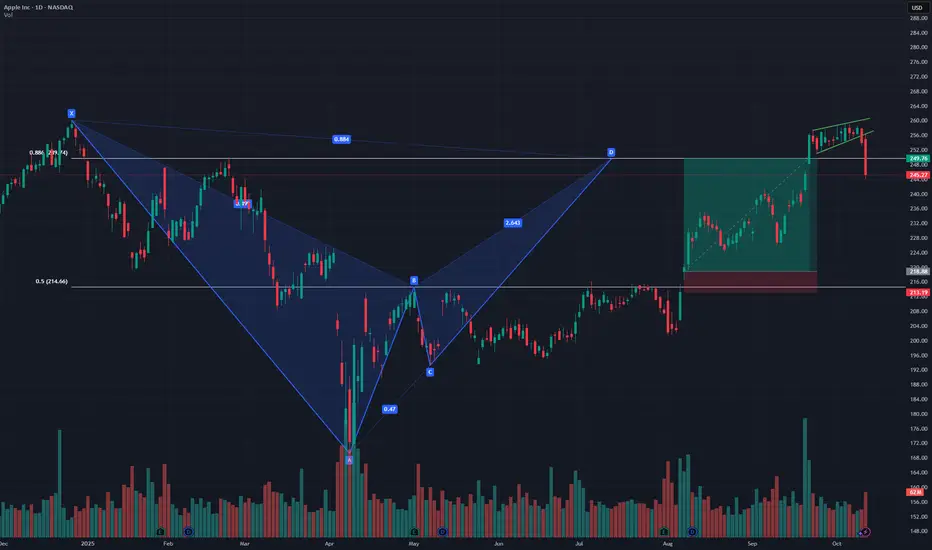
$AAPL bearish crabNASDAQ:AAPL reached target (0.886 Fib level) consolidated near all time highs then broke down. will wait for further discount.
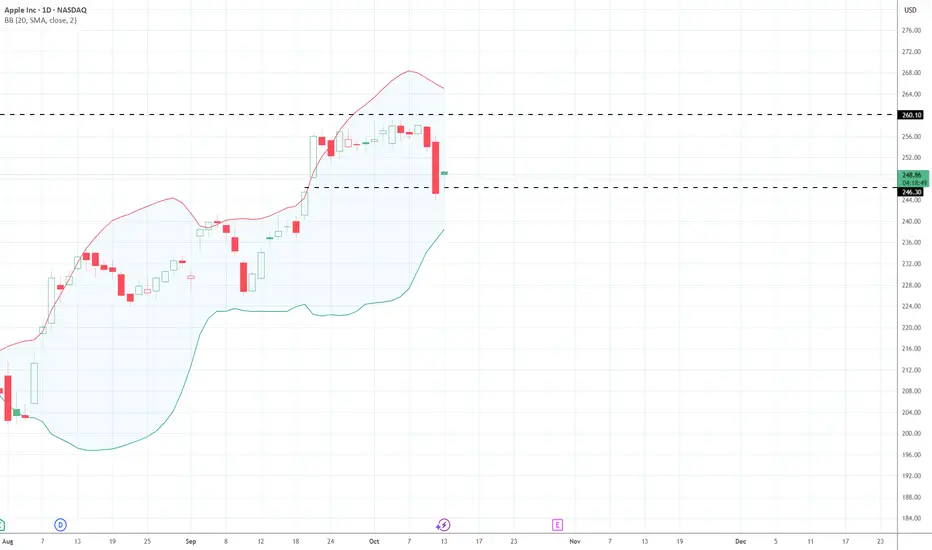
Daily BB reached, expect some flagging A quick one before the close. The Daily BB has been reached, so I expect a pause here. If we do drop over the weekend, this area should get tested before we drop further.
AAPL is hinting at a possible ABC on the weekly chart.

$AAPL Call Alert – Oct 31 ’25 $250 Calls | 119% ROI PotentialEnter: NASDAQ:AAPL OCT 31 2025 $250 CALLS
Buy in Price: $6.27 - $6.35
Take Profit: $13.73
Stop Bleeding: $5.52
ROI Potential: 119%
Exit Within: 354 Minutes
Hello trader, for tomorrow, AAPL: 254.04 10/10/25One thing we should keep in mind is the stock's location. We could have a quick first bullish entry above 254.00/252.00 up to 258.00. It depends on where it is in the pre-market. If it is near the 258.00 pre-market zone, it could encounter rejection. We only enter bullish above 260.00/262.00.
Our bearish entry should be below 250.00/248.00. Stops should be above the VWAP if it is bearish, or below it if it is bullish.

Apple $AAPL - SELL | Orbis InvestmentApple NASDAQ:AAPL - SELL | Orbis Investment
Entry: 258.21
TP: 227.11
SL: 267.22
RR: 3.45
#Apple #AAPL #NASDAQ #Stocks #Equities #TradingView #AnálisisTécnico #StockMarket #Investments #Trading #OrbisInvestment

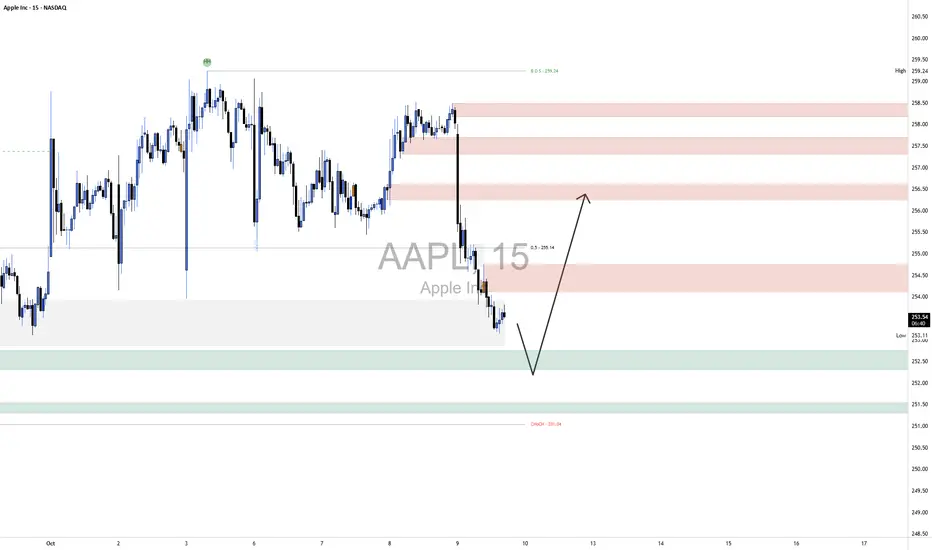
AAPL LongThe broader market structure shows that AAPL recently transitioned from a bullish leg to a clear short-term bearish phase after a strong Break of Structure (BOS) at 259.24, which confirmed a shift in control from buyers to sellers. Price failed to make a new high after the last rally, and the subsequent drop formed a decisive lower low, reinforcing bearish intent. The Change of Character (CHoCH) sits lower at 251.04, and if price were to breach that level, it would signal deeper downside continuation and confirm that higher-timeframe buyers have lost momentum.
The supply zones between 254.5–258.5 show layered resistance, where price previously dropped sharply, suggesting aggressive selling pressure from institutional participants. These zones remain strong as price has not yet retested them after the initial rejection. The demand area around 252–251 is the most immediate zone of interest, as it was the origin of the last bullish impulse that temporarily interrupted the down move—buyers stepped in with some strength there, though the overall context still favors sellers. A deeper secondary demand around 250–249 aligns with the CHoCH, representing the last structural defense before a full breakdown.
Currently, price action within the marked region shows a corrective pullback after a strong impulsive decline. Price is hovering just above the 252 demand zone, and momentum is beginning to slow—suggesting short-term exhaustion from sellers. The most probable scenario is a small sweep into the 251.5–252 range to tap liquidity before a relief rally back toward 255–256, where the first supply zone awaits. If that rally occurs and fails to reclaim above 256.5, sellers are likely to re-enter and drive price back toward 251.
The trade bias for now is short-term bullish (counter-trend), expecting a corrective move upward, but within a larger bearish structure. The key invalidation for any bullish scenario would be a clean break below 250.90, which would confirm continuation to the downside.
Momentum currently favors sellers overall, but short-term candles are showing smaller bodies and lower wicks—signs of absorption from buyers around demand.