Exelon Chart Fibonacci Analysis 092425Trading Idea
1) Find a FIBO slingshot
2) Check FIBO 61.80% level
3) Entry Point > 44/61.80%
Chart time frame:B
A) 15 min(1W-3M)
B) 1 hr(3M-6M)
C) 4 hr(6M-1year)
D) 1 day(1-3years)
Stock progress:A
A) Keep rising over 61.80% resistance
B) 61.80% resistance
C) 61.80% support
D) Hit the bottom
E) Hit the top
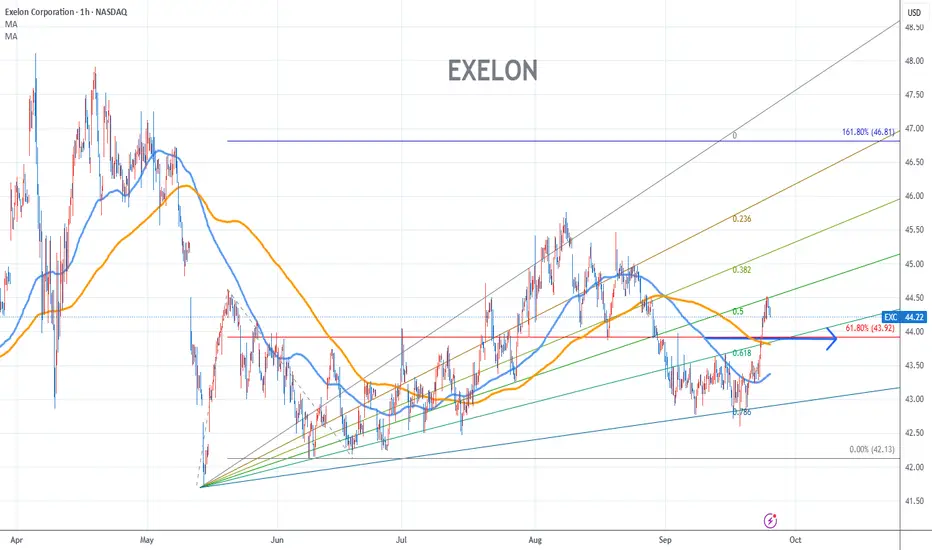
Stocks rise as they rise from support and fall from resistance. Our goal is to find a low support point and enter. It can be referred to as buying at the pullback point. The pullback point can be found with a Fibonacci extension of 61.80%. This is a step to find an entry-level position. 1) Find a triangle (Fibonacci Speed Fan Line) that connects the high (resistance) and low (support) points of the stock in progress, where it is continuously expressed as a Slingshot, 2) and create a Fibonacci extension level for the first rising wave from the start point of the slingshot pattern.
When the current price goes over the 61.80% level, that can be a good entry point, especially if the SMA 100 and 200 curves are gathered together at 61.80%, it is a very good entry point.
As a great help, TradingView provides these Fibonacci speed fan lines and extension levels with ease. So if you use the Fibonacci fan line, the extension level, and the SMA 100/200 curve well, you can find an entry point for the stock market. At least you have to enter at this low point to avoid trading failure, and if you are skilled at entering this low point, with the fibonacci6180 technique, your reading skill of to chart will be greatly improved.
If you want to do day trading, please set the time frame to 5 minutes or 15 minutes, and you will see many of the low points of rising stocks.
If you prefer long-term range trading, you can set the time frame to 1 hr or 1 day
EXEC trade ideas
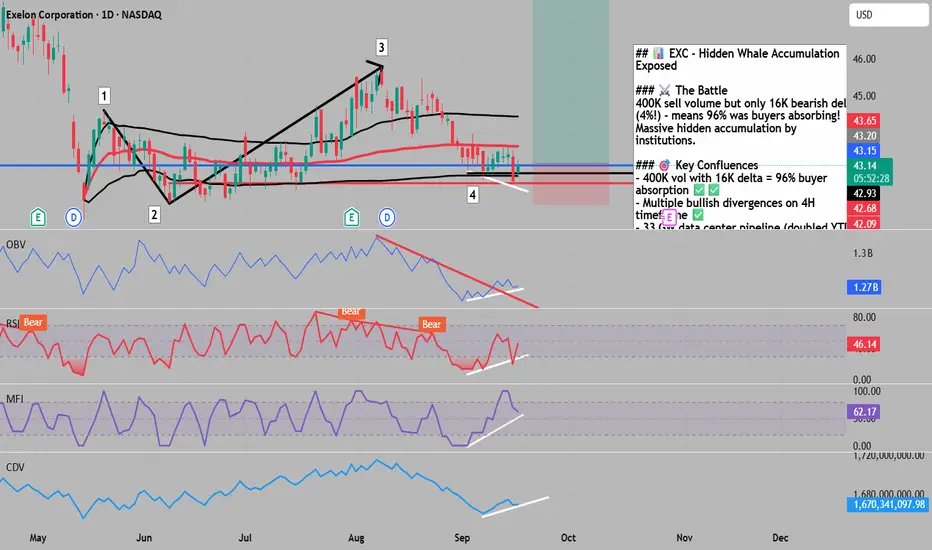
Massive Hidden Buying in 400K Volume - Bears Trapped⚡ EXC: Massive Hidden Buying in 400K Volume - Bears Trapped
The Market Participant Battle:
The 4-hour volume footprint reveals an extraordinary deception: Despite 400K volume on the previous massive sell bar, only 16K was actually bearish delta - meaning 384K volume was BUYERS absorbing the selling! This represents one of the most extreme cases of hidden accumulation, where institutional buyers have been aggressively absorbing every attempt to push price lower. The big red bar to the left also shows bullish delta divergence, confirming that what appears as selling is actually massive buying in disguise. Bears who think they're winning are actually being systematically trapped by smart money accumulation.
Confluences:
Confluence 1: Extreme Bullish Delta Divergence (400K vs 16K)
The footprint data exposes the truth: Out of 400K total volume on the major sell bar, only 16K (4%) was actual bearish delta. This means 96% of the volume was buyers stepping in to absorb the selling pressure. This is an extraordinarily rare setup showing massive institutional accumulation disguised as selling. The delta numbers don't lie - buyers are in complete control despite the red candles.
Confluence 2: Multiple Bullish Divergences Across Timeframes
The big red bar to the left shows another bullish delta divergence, confirming this is a systematic pattern of accumulation. Multiple divergences stacking up on the 4-hour timeframe indicate this isn't random - it's coordinated institutional buying at specific price levels. The consistency of these divergences across multiple bars confirms smart money is building a massive position.
Confluence 3: Data Center Mega-Catalyst at Triple Support
Exelon's data center pipeline has exploded to 33 GW (doubled from 17 GW), representing unprecedented growth opportunity. With AI driving insatiable power demand and Exelon positioned in key markets, the company is at the epicenter of a multi-decade growth story. The stock is sitting at crucial support levels while fundamental catalysts are accelerating.
Web Research Findings:
- Technical Analysis: Current sentiment is Neutral with Fear & Greed Index at 39 (Fear), suggesting oversold conditions ripe for reversal
- Recent News/Earnings: Data center pipeline at 33 GW with 17 GW already connected, expecting 10% online by 2028, 33% by 2030, and 75% by 2034
- Analyst Sentiment: 11 Wall Street analysts average target $48.30 (9.80% upside) with high target $52.00, showing strong institutional conviction
- Data Releases & Economic Calendar: Fed expected to cut rates Wednesday, first cut of 2025, with potential for additional cuts given weak labor market
- Interest Rate Impact: Utilities advanced 10% since September 2024 rate cut, trading near record highs as bond proxy investments gain favor
Layman's Summary:
Think of this like watching a tug-of-war where it looks like one side is winning, but secretly the "losing" side is just letting out rope while getting stronger. The volume data shows that when sellers tried to push the stock down with 400,000 shares, buyers absorbed 384,000 of them (96%!). This is like a whale quietly accumulating shares while making it look like selling. The company is seeing explosive growth from AI data centers needing massive power, and the Fed is about to cut rates which historically sends utility stocks higher. Wall Street analysts see 10-20% upside from here.
Machine Derived Information:
- 4H Volume Footprint: 400K volume with only 16K bearish delta (4%) - Significance: Extreme hidden accumulation with 96% buyer absorption - STRONGLY AGREES ✔✔
- Left Red Bar: Shows additional bullish delta divergence - Significance: Confirms systematic accumulation pattern across multiple periods - AGREES ✔
- Delta Totals: Multiple zones showing positive delta on down bars - Significance: Institutional buyers defending every dip aggressively - AGREES ✔
Actionable Machine Summary:
The 4-hour footprint reveals one of the most extreme accumulation patterns possible - massive volume with minimal bearish delta proves institutions are absorbing every share offered. The 96% buyer absorption rate on 400K volume is extraordinarily bullish. Multiple divergences confirm this isn't coincidence but coordinated accumulation. This setup suggests an explosive move higher once selling exhausts and trapped shorts are forced to cover.
Conclusion:
Trade Prediction: SUCCESS
Confidence: Very High
This is an exceptional setup where the volume footprint exposes massive hidden buying that's invisible on regular charts. The 400K volume with only 16K bearish delta is a smoking gun of institutional accumulation. Combined with data center growth catalysts and imminent Fed rate cuts, this creates a perfect storm for upside. The risk/reward is outstanding with such strong buyer support proven by the delta data.
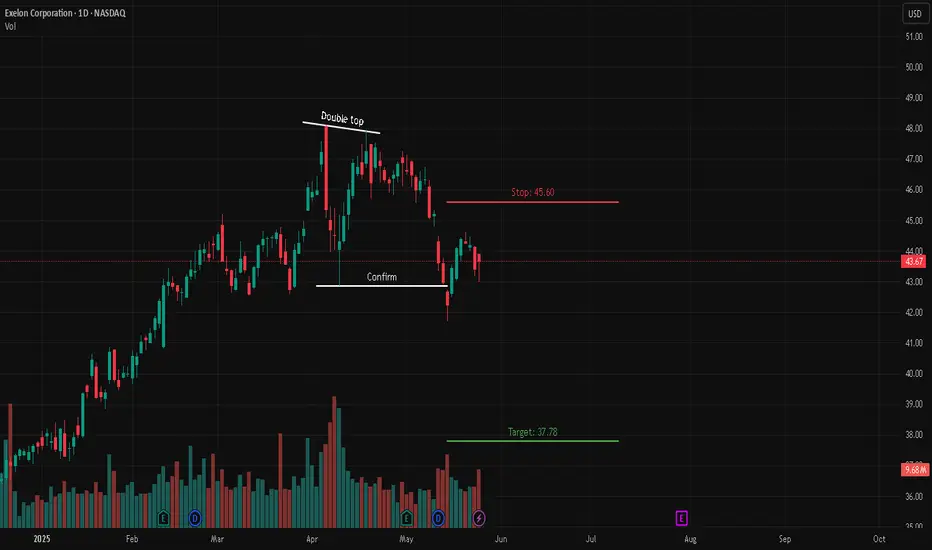
Exelon Corporation (EXC) – Double Top Breakdown📉 Short Setup
🔍 Description:
Exelon Corporation (NASDAQ: EXC) has formed a Double Top pattern , signaling a bearish reversal. The price has broken below the neckline, confirming downside pressure. Current consolidation below the breakdown point suggests continuation lower, with a clear risk-defined setup.
📊 Trade Details:
🔹 Entry: Below neckline confirmation
🔴 Stop Loss: 45.60
🟢 Target: 37.78
📌 Confirmation:
Neckline break on increased volume confirms bearish intent. If price reclaims and holds above the neckline, the setup could be invalidated.
Trade safe! 📉🚨
$EXCGreen: Entry Point
Blue: Start of Week
Red: End of Week
Thumbs Up: Trade Available for Week
Numbers: Price Targets
*For share traders only. Not meant for options.

EXC LONG POSITIONHi traders,
As we can see from the chart on a weekly basis , there is a formation of a falling wedge starting from middle of 2022 . The price is inside the falling wedge formation and we are expecting the break out . The target is shown on the chart .Enter the long position only if the breakout occurs.

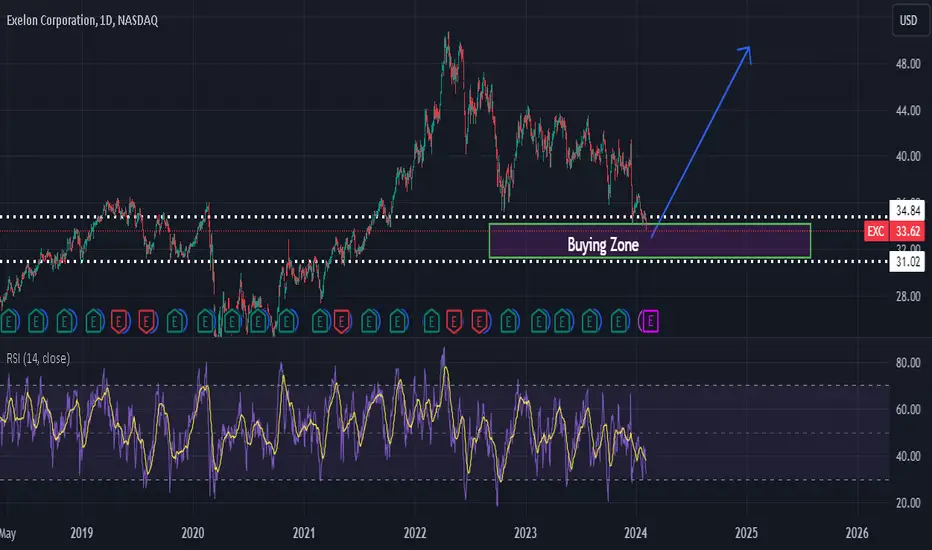
EXC - EXELON - time to look for long nowDear traders,
Id like to share this idea in order to take long positions
30- 33$ is is a good price range to look for buying opportunities.
Additionally RSI is clearly oversold and prices already went down quite aggressive.
best,
EXC - Exelon - longDear traders,
Looking for buying positions in Exelon are a good option if you are up to hold them in your portfolio, is is in a nice price area around 30 -35$.
buy and hold
best all,

Exelon CorporationExelon Corporation is one of the nation's largest electric utilities. The company has one of the industry's largest portfolios of electricity generation capacity, with a nationwide reach and strong positions in the Midwest and Mid-Atlantic.
Exelon (Nasdaq: EXC) is a Fortune 250 company and the nation’s largest utility company, serving more than 10 million customers through six fully regulated transmission and distribution utilities:
1. Atlantic City Electric (ACE)
2. Baltimore Gas and Electric (BGE)
3. Commonwealth Edison (ComEd)
4.Delmarva Power & Light (DPL)
5. PECO Energy Company (PECO)
6. Potomac Electric Power Company (Pepco).
More than 19,000 Exelon employees dedicate their time and expertise to supporting our communities through reliable, affordable, and efficient energy delivery, workforce development, equity, economic development, and volunteerism
Exelon is a critical company that contributes to the prosperity of all sectors of the American economy through connecting and powering businesses.

EXC: completing the V-shape correction?1. V-Shape Correction:
A standout feature in the recent price movement is the V-shape correction. This formation often indicates a sharp reversal in trend. After a swift drop, the price has recovered with equivalent vigour, suggesting a possible change in sentiment among traders and investors.
2. 200-Day Moving Average:
The stock has had significant interactions with the 200-day moving average, a vital indicator for gauging long-term trends. Currently, the price is below this average, which could act as a resistance level in the immediate term.
3. Fibonacci Retracement Levels:
Currently, the stock is oscillating near the 50.0% retracement level. The area around the 61.8% retracement is marked as "increase exposure around 41.00," indicating that this could be a strategic level to monitor for trade entries or adjustments.
4. Target and Stop Levels:
A bullish target is set at $42.00, presenting a potential upside of +5.4%. On the flip side, a stop is suggested at $39.00, indicating a potential risk of -2.1%. With a win/loss ratio of 2.8:1, the potential reward outweighs the potential risk by nearly threefold, presenting a favourable scenario for those with a bullish outlook.
Conclusion:
Exelon Corporation's chart paints a picture of recovery following a sharp decline. The V-shape correction, combined with interactions at key Fibonacci levels, suggests potential opportunities for traders. However, the 200-day moving average might act as a near-term resistance.

Excelon Corporation longExcelon Corporation (EXC) is traded bellow down slopping resistance, however horizontal support is being respected since beginning of 2023. Price is approaching a support line marked on a chart.
Entry point: Consider entering a long position when the price reach recommended entry price: 39.35.
Stop loss: Place stop loss below support line. Recommended stop loss value : 38.70.
Take Profit 1: 42.70.

Exelon Complex Inverted H&S PatternExelon is seeing gains with the energy sector as oil moves higher this week. Price has formed a complex inverted H&S pattern with price recently coming up off a second right shoulder and is currently testing the neckline. Price is currently trading above all MAs(8,21,34,50,100,200) and the shorter MA's are crossing above the longer MAs indicating a shift to bullish price trend.
The lower PPO indicator is showing the green PPO line rising above the purple signal line which is also rising, and indicates short-term bullish momentum. Both lines trending above the 0 level indicates intermediate to long-term bullish momentum.
The lower TDI indicator shows a rising green RSI line which just recently crossed above the 60 level and indicates a short-term bullish trend. The green RSI line is above the purple signal line and is currently trading outside of the upper Bollinger Band which is a bullish signal and you want to stay long while the RSI line is above the upper Bollinger Band... but caution is warranted because price tends to correct after the RSI falls back below the upper band.
Should price break up above the neckline it would be bullish going forward and start to validate the complex inverted H&S pattern. At current levels we'd be watching for a close and open above the neckline around the $43 area. Taking a measured move from the head to neckline we get $11. This $11 would then be added to breakout level of $43 which gives us a projected price target near $44.
My buy price on this trade is $42.17.
My stop-loss is currently set at $39.55.
Risk/loss on the trade is roughly -4%.
Potential gain is roughly +22%.

EXC Long after huge down momentumNASDAQ:EXC is coming to a strong resistance level at about 39.00. In the past, we often had reversals in this zone. After the big momentum, the probability of a correction is high.

EXC 40 WMA and resistance rejectionHey folks, Merry Christmas! Here is a nice little present for you :)

Exelon/ComED/ConED: Targeting 1.618 Completion of Bearish AB=CDComED is on the edge of completing the 1.618 extension of this Perfect Bearish AB=CD:
So long as it can hold above the 1.13 everything should be fine. I will be playing this via options by buying some calls in the $40s that are a couple months out and when the 1.618 is hit i will consider flipping my position.

$EXC (30 Minute Levels)We can see if $EXC goes down it is headed for weekly support...potential pressure point.

$EXC (Weekly Timeframe)Leader from the Utilities Group (strongest downtrending group today) - The moving averages appear what I like to call "stacked" in the bears favor. A look at the volume shows it extremely low at this time with recent major points of inflection to favor the short side of volume.

$EXC with a Bullish outlook following its earnings #Stocks The PEAD projected a Bullish outlook for $EXC after a Negative over reaction following its earnings release placing the stock in drift C with an expected accuracy of 100%.

$EXC with a Bullish outlook following its earnings #Stocks The PEAD projected a Bullish outlook for $EXC after a Positive over reaction following its earnings release placing the stock in drift B with an expected accuracy of 60%.


$EXC with a Bullish outlook following its earnings #Stocks The PEAD projected a Bullish outlook for $EXC after a Positive over reaction following its earnings release placing the stock in drift B with an expected accuracy of 75%.

Long On EXCThe upper timeframe Trend is bullish
I should have bought the stock 4th of March as it has broke out the previous high, but i think now I have a better price and a better stop loss.
The pre-market price is at 44.07 so i will put a stop order at 44.08
My stop loss is at 42.2 under the 50 SMA, my take profit will be at 51 a weekly major resistance

US Stock In Play: $EXCUtilities name are usually not a go-to for swing traders as there is tendency of choppy price action around its MA, and low ATR%
$EXC however, behaves superbly as an utility stock with history of trading consecutive up days on several occasion in 2021 alone. ATH currently

Exelon Making New HighsExelon has room to run upwards and shows bullish momentum. New highs are being made, I bought some $55 calls expiring Nov 19, costin 17c per contract.
