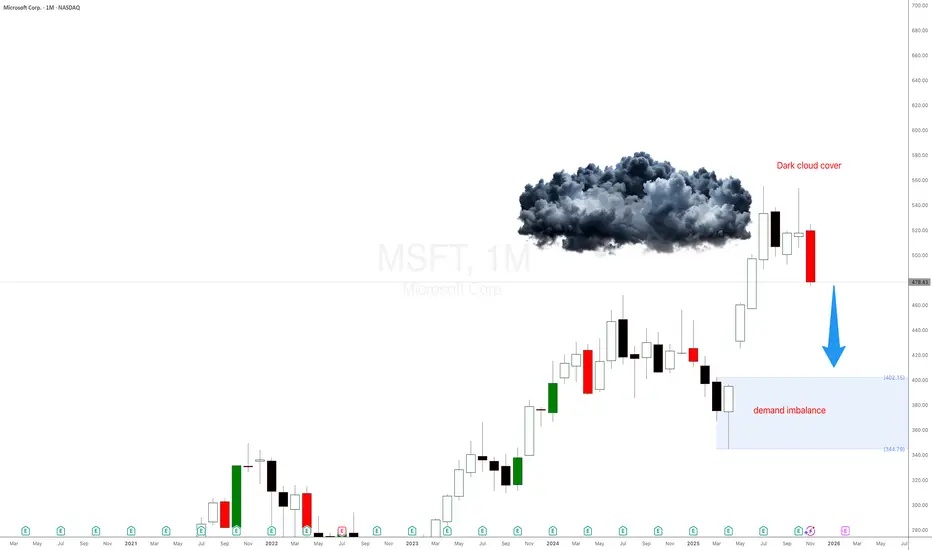
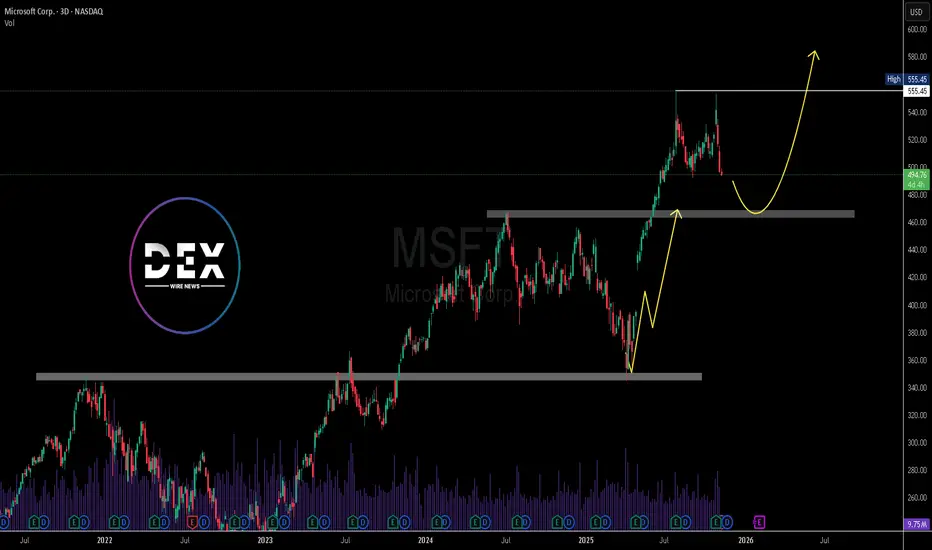
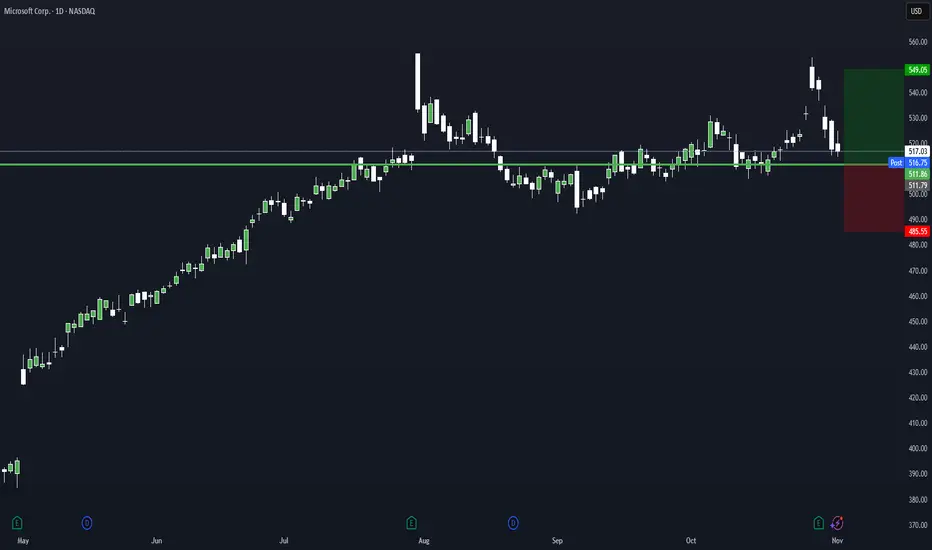
Why is Microsoft Stock $MSFT dropping hard?Microsoft just did what every impatient trader hates… after a massive rally, the candles are shrinking, emotions are rising, and here comes the correction everyone said ‘couldn’t happen.’ Today I’ll show you—using pure supply and demand—why MSFT is being magnetically pulled back into the monthly demand imbalance like a toddler to a candy shop. No fundamentals, no drama… just price action, imbalances, and patience. Let’s dive in.
Microsoft Monthly Supply & Demand Analysis
After Apple’s strong monthly correction setup, Microsoft (MSFT) is showing the exact same pattern — but even cleaner.
This is what I love when I teach traders to learn to trade stocks using pure price action and supply and demand imbalances. You don’t need news, earnings, or any guru opinion — everything is already priced in at the higher timeframes. Just like I explained in the Supply and Demand Free Course , the bigger timeframes tell you what the professionals already did months ago.
Let’s break it down.
Candles Shrinking = Momentum Weakening
Fast-forward to mid/late 2025:
- The wide-bodied candles disappeared
- Small-bodied candles appeared
- Then came the big bearish candle
This is classic momentum decay. This is exactly when most traders start acting emotionally:
- They zoom into 5-minute charts
- Their IQ drops by 50 points
- They forget the trend
- They forget the imbalance
- They become chart zombies
But price action never lies — we’re simply seeing exhaustion after a massive markup.
Trade ideas
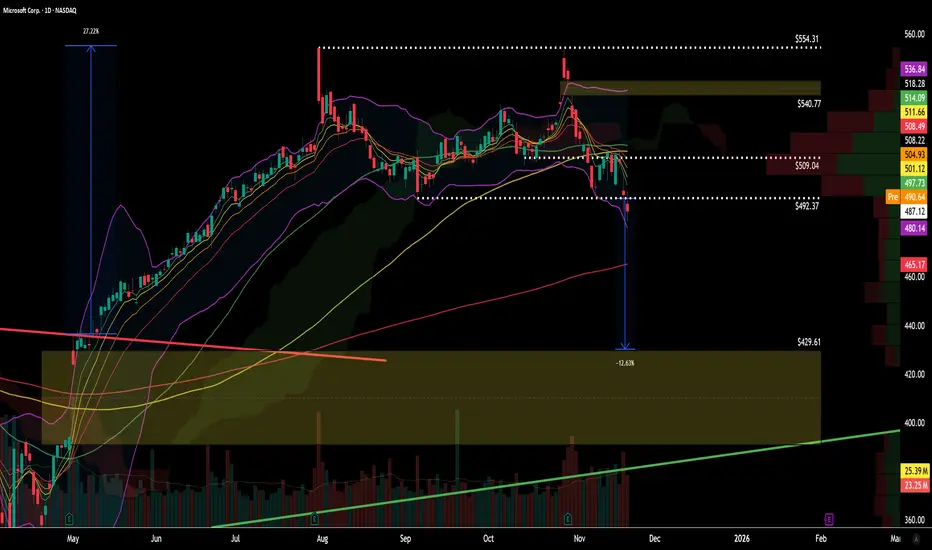
MSFT — Daily & Weekly Structure Check (20 Nov 2025)Context
Price failed to clear $554–$555, the 1:1 measured move from the May flag.
A bearish double top formed on the daily; the downswing was kicked off by an island reversal.
Daily Structure
Today price lost $493–$492 (valley/neckline), confirming the double-top breakdown.
Volume confirms: heavier on down days, lighter on bounces.
Price is below the 5-day MA; the 21-day MA is acting as dynamic resistance.
The 50-day and 100-day MAs have also been lost, reinforcing intermediate weakness.
Weekly Context
The major trend remains intact above the longer MA, but the 21-day MA is now broken, aligning the weekly picture with daily weakness.
Key Levels
Resistance: $493–$492 (now breakdown/neckline); $554–$555 (measured-move cap).
Supports on the path lower: intermediate help from the 50/100-day MAs; the 200-day sits beneath the gap.
Target on confirmation: $430–$429 (top of the FVG) via a 1:1 measured move from the double-top.
Scenarios
Bearish continuation (primary): A weekly close below $493–$492 keeps momentum pointed to $430–$429. Expect potential pauses at the 50/100-day MAs; failure there leaves the FVG magnet in play with the 200-day below.
Bullish repair (secondary): A swift reclaim of $493–$492 followed by acceptance back above the 21-day MA would neutralize the breakdown and defer the measured-move path.
Triggers
Downside trigger: Friday close < $493–$492 → activates the 1:1 toward $430–$429.
Upside repair trigger: Daily close back > $493–$492 and back over the 21-day MA → negates immediate breakdown risk.
Risk & Invalidation
Bearish view invalidates on sustained closes back above $493–$492 with the 21-day MA reclaimed as support.
Until then, trend-following bias favors lower highs / lower lows on the daily.
Summary
Rejection at $554–$555, a double-top breakdown through $493–$492, confirming volume, and loss of the 5/21/50/100-day MAs all align bearish in the intermediate term.
The weekly trend is still up overall, but breaking the 21-day brings it into agreement with the daily.
Watch $493–$492 into the weekly close; it’s the pivot between a measured-move drive to $430–$429 and a repair back into range.
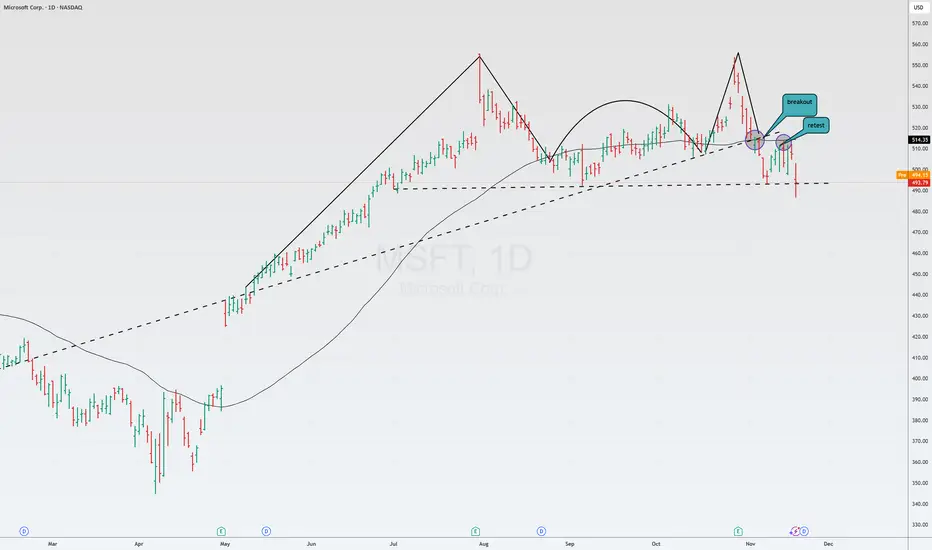
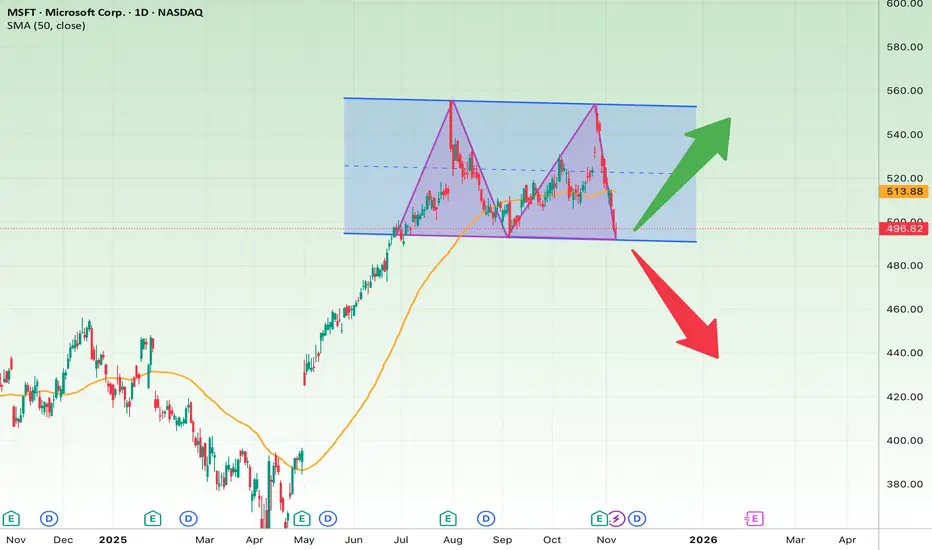
MSFT USMicrosoft is currently playing out a beautiful Batman pattern : having broken through the sloping trendline, retested, and also retested at 50 SMA.
However, yesterday, the market pulled the stock above the support level of 490-493, and traders may attempt a rebound after seeing a false breakout.
At the very least, going long in such a situation is very dangerous.
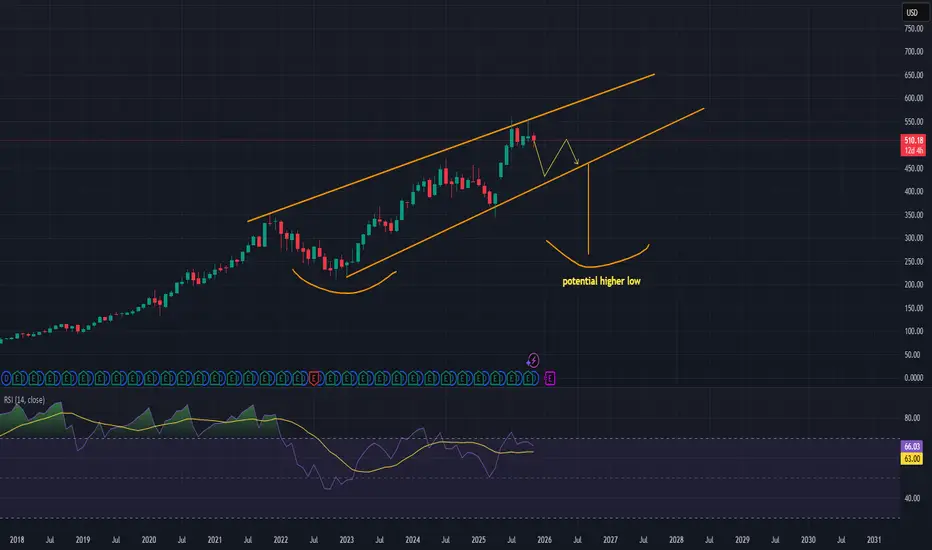
Microsoft (MSFT) Macro Correction Aheadhi traders,
This analysis of the Microsoft ( NASDAQ:MSFT ) monthly chart identifies a bearish technical pattern that suggests a significant correction is imminent, likely forming a necessary higher low before the continuation of the macro bull market.
Key Technical Observations
Rising Wedge Pattern: The price action over the last several years has formed a clear Rising Wedge pattern (marked by the two converging orange trendlines). This pattern is defined by a series of higher highs and higher lows, with the momentum decreasing as the price moves up and the trendlines narrow.
Interpretation: The Rising Wedge is a bearish reversal pattern. It typically resolves with a sharp break below the lower trendline. The recent move upward suggests the price is currently retesting the upper boundary of the wedge.
Momentum Check (RSI): The Relative Strength Index (RSI) is currently trending in the bullish zone (above 50.00), but it has recently turned down after failing to make strong new highs, indicating a loss of upward momentum. The current reading is 66.83, which still suggests some overbought condition relative to the previous range.
Projected Correction Path: The chart suggests the price will face resistance near the top of the wedge, leading to a breakdown below the current price level. The projected path (yellow arrows) targets a drop towards the lower trendline of the wedge.
Strategic Outlook: Forming the Macro Higher Low
The most important feature of this setup is the concept of the potential higher low (labeled on the chart).
Necessity of Correction: For any healthy, long-term bull market to continue, corrections are needed to reset indicators and shake out weaker hands.
The Higher Low: The projected support at the lower trendline is expected to form a Higher Low relative to the previous major swing low (the curved yellow line at the bottom of the wedge, seen around 2023).
Trade Idea: A break below the current level and a move towards the lower trendline would establish this higher low, completing the bearish phase of the pattern and providing a prime long-term accumulation zone for the next leg of the macro bull market.
Conclusion:
While the short-to-medium term outlook is bearish, targeting a move down to the lower boundary of the Rising Wedge, this correction is viewed as a necessary and healthy event. The key level to watch is the lower trendline, as its defense will confirm the creation of a macro higher low and signal the continuation of Microsoft's secular bull trend.
PERFECT MSFT SHORTWe have a really strong timeframe alignment on NASDAQ:MSFT , presenting us with a great shorting opportunity.
Weekly
If we start top down from the weekly, MSFT had a strong and fast rally but has faced strong rejection on the upper side of its long term upward channel. Price may now look to retrace to its previous long-term swing high after this rejection. We also see volatility constriction through Bollinger Bands, indicating potential for large price moves and volume to occur soon.
Daily
On the daily chart we see a strong rejection of the daily 50 ema and resistive levels after a downside breakout.
Hourly
For the entry on the 1hr timeframe we are looking at a large head and shoulder formation, with a trend rejection and a strong rejection of the 1hr 100ema.
I am targeting the previous long-term swing high at 470 as my singular TP.
Goodluck-nfa.

Microsoft has formed a textbook double-top pattern on the dailyMicrosoft NASDAQ:MSFT has formed a textbook double-top pattern on the daily chart, a sign that the recent rally may be losing steam.
Price is now testing the neckline around $492, a crucial level that could decide the next major move.
If this support breaks, the door opens for a deeper pullback. But if it holds and buyers step back in, it could mark the start of a powerful recovery.
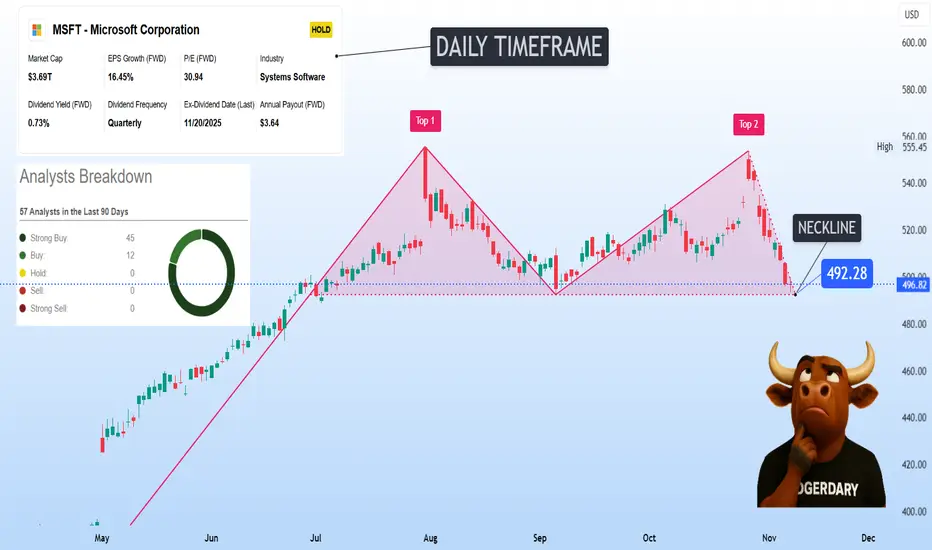
Microsoft on the Edge — Double Top or Beginning of a Rebound?The daily chart of Microsoft (MSFT) shows that the stock is moving within a horizontal range between approximately 495 and 540 dollars, with a potential bearish Double Top pattern forming. The price is currently testing a critical support area that could determine the next major move.
Structure and Trend Analysis
After a strong rally from early 2025, Microsoft entered a consolidation phase with sideways movement. Two clear peaks near 540 dollars indicate a possible Double Top pattern, which is often a signal of a trend reversal. The 50-day moving average, located around 488 dollars, has started to flatten, confirming the loss of short-term momentum. At the moment, the price is trading slightly above the key horizontal support at 495 dollars, which aligns with previous reaction lows.
Bullish Scenario
If Microsoft can hold above 495 dollars and bounce from this level, it will likely retest the upper boundary of the range near 540 dollars. Final confirmation comes if the price breaks above 540 with strong momentum. In this case, the short-term target would be between 525 and 540 dollars, and the mid-term target between 565 and 580 dollars. A reasonable stop loss for this setup would be a close below 490 dollars. A rebound from this area would indicate accumulation and the potential continuation of the long-term uptrend.
Bearish Scenario
If the price breaks below 495 dollars with increased selling volume, the Double Top pattern would be confirmed. In that case, the price could fall toward the 430 to 440 dollar range. The short-term target would be around 465 dollars, and the long-term target near 430 dollars, while the stop loss would be set above 510 dollars. A decisive close below the support zone would confirm a change in direction and could trigger a deeper correction.
Timeframe Outlook
In the short term, over the next one to three weeks, the stock may continue moving sideways between 495 and 520 dollars as traders wait for a breakout or breakdown signal. In the medium to long term, over the next two to four months, a breakout above 540 dollars could lead to a rally toward 580 dollars, while a breakdown below 495 dollars could open the path to 430 dollars, aligning with the Double Top pattern’s projected target.
Globalization and Its Impact1. Understanding Globalization
Globalization can be described as the process by which national economies, societies, and cultures become integrated through a global network of trade, communication, immigration, and transportation. It is not a new phenomenon—it has existed in some form for centuries. The Silk Road, which connected Asia, the Middle East, and Europe, was an early form of globalization through trade and cultural exchange.
However, the modern phase of globalization began after World War II, especially with the establishment of international institutions such as the United Nations (UN), World Bank, and International Monetary Fund (IMF). The late 20th and early 21st centuries witnessed an explosion of globalization due to technological progress, digital communication, liberalized trade policies, and advancements in transportation.
2. Drivers of Globalization
Several factors have fueled globalization:
Technological Advancements: Innovations in communication (like the internet, mobile phones, and satellites) and transportation (like jet aircraft and container shipping) have made global interactions faster and cheaper.
Trade Liberalization: The removal of trade barriers, formation of free trade agreements (like WTO, NAFTA, and ASEAN), and economic reforms have opened markets across borders.
Foreign Direct Investment (FDI): Multinational corporations (MNCs) invest in foreign countries to expand production and reach new markets.
Global Financial Markets: Integration of global banking and stock markets allows capital to move freely across nations.
Migration: People move across countries for education, work, and better living standards, leading to cultural exchange and remittance flows.
3. Economic Impact of Globalization
The economic impact of globalization is profound and multifaceted.
a. Economic Growth and Development
Globalization has accelerated economic growth in many developing countries. Access to international markets has allowed nations like China, India, and Vietnam to industrialize rapidly, lifting millions out of poverty. Global competition has encouraged innovation and efficiency in production.
b. Job Creation and Opportunities
By opening new markets and expanding industries, globalization has created jobs in manufacturing, technology, and services. The outsourcing and offshoring industries, particularly in countries like India and the Philippines, have provided employment to millions.
c. Inequality and Job Displacement
While globalization benefits some, it disadvantages others. Low-skilled workers in developed countries often lose jobs to cheaper labor markets abroad, leading to income inequality. Similarly, not all regions in developing countries benefit equally, creating an urban-rural divide.
d. Rise of Multinational Corporations (MNCs)
MNCs have become powerful players in the global economy. They drive innovation, create employment, and bring investment. However, they can also exploit cheap labor, avoid taxes, and influence local policies to suit their interests.
4. Social and Cultural Impact
Globalization has reshaped social structures and cultural identities.
a. Cultural Exchange and Diversity
Global media, tourism, and the internet have made it possible for people to share music, movies, food, and traditions across borders. This cultural exchange fosters mutual understanding and tolerance.
b. Cultural Homogenization
On the other hand, globalization can lead to cultural homogenization, where local traditions and languages are overshadowed by dominant global cultures, particularly Western ones. For example, global brands like McDonald’s and Hollywood films influence lifestyles worldwide, sometimes at the expense of local customs.
c. Education and Knowledge Sharing
Globalization has expanded access to education. International universities, online learning platforms, and research collaborations promote knowledge exchange. Students can now study abroad, gaining global perspectives.
d. Migration and Social Integration
The movement of people across borders leads to multicultural societies. However, it also poses challenges such as identity conflicts, racism, and immigration tensions in some regions.
5. Political Impact of Globalization
Globalization affects the sovereignty and power of nation-states.
a. Interdependence Among Nations
Countries are now more interdependent for trade, energy, and technology. This interdependence encourages peace and cooperation, as conflicts disrupt economic stability.
b. Influence of International Institutions
Organizations like the United Nations, World Trade Organization (WTO), and World Health Organization (WHO) play major roles in shaping global policies on trade, security, and health. However, smaller countries sometimes find themselves at a disadvantage against powerful nations or corporations.
c. Spread of Democracy and Governance Standards
Globalization has encouraged democratic values, transparency, and human rights awareness. Information flow through social media helps citizens hold governments accountable. Yet, some authoritarian regimes use globalization’s tools for surveillance and propaganda.
6. Environmental Impact
The environmental consequences of globalization are increasingly visible.
a. Industrialization and Pollution
As production expands globally, energy consumption and industrial pollution have increased. Developing countries, in particular, face environmental degradation due to lax regulations and exploitation of natural resources.
b. Climate Change
Globalization-driven industrial activity contributes to carbon emissions, deforestation, and loss of biodiversity. Climate change has become a global challenge that requires collective action through international agreements like the Paris Accord.
c. Environmental Awareness and Cooperation
On a positive note, globalization has spread environmental awareness. NGOs and international organizations collaborate on issues like renewable energy, conservation, and sustainable development.
7. Technological Impact
Globalization and technology are mutually reinforcing.
Digital Transformation: The digital revolution has connected people and markets globally. E-commerce platforms, fintech, and social media enable even small businesses to operate internationally.
Innovation Sharing: Global collaboration accelerates research in medicine, science, and artificial intelligence.
Digital Divide: However, unequal access to technology between rich and poor nations creates a “digital divide,” limiting participation in the global economy.
8. Globalization and Health
The COVID-19 pandemic highlighted both the strengths and vulnerabilities of globalization.
Rapid Spread: Global travel accelerated the spread of the virus.
Global Cooperation: On the other hand, scientific collaboration enabled the rapid development of vaccines.
Health Inequality: Access to healthcare and vaccines remains unequal across nations, showing the need for global solidarity in health policy.
9. Challenges and Criticisms of Globalization
While globalization brings progress, it also faces criticism:
Economic Inequality: Wealth is concentrated in a few countries and corporations.
Cultural Erosion: Local traditions and languages may decline.
Environmental Damage: Industrial growth often comes at the cost of sustainability.
Loss of Sovereignty: National governments sometimes lose control over economic policies due to global institutions or MNCs.
Dependency: Developing countries can become overly dependent on foreign markets or investments.
10. The Future of Globalization
The future of globalization is evolving. The rise of protectionism, geopolitical conflicts, and technological changes are reshaping global dynamics. However, complete deglobalization is unlikely. Instead, a new form of “smart globalization”—one that balances economic growth with social equity and environmental sustainability—is emerging.
Global cooperation on issues like climate change, digital governance, and global health will define the next phase. Nations must work together to ensure that globalization benefits all, not just a privileged few.
Conclusion
Globalization has been a powerful driver of economic, social, and cultural transformation. It has connected the world like never before, enabling progress, innovation, and prosperity. Yet, it also presents serious challenges—inequality, cultural loss, and environmental threats. The key lies in managing globalization responsibly—by promoting inclusive growth, respecting cultural diversity, protecting the environment, and ensuring fair governance. Ultimately, globalization is not just an economic phenomenon; it is a human one that reflects our shared destiny in an interconnected world.
Microsoft Corp.($MSFT) Pullback Forms as AI Momentum Face Test Microsoft Corp. (Nasdaq: NASDAQ:MSFT ) stock slipped 0.34% to $495.43 on Thursday, extending its recent decline from October highs near $555. The retreat reflects broader consolidation in large-cap tech after months of AI-driven gains, with investors reassessing valuations ahead of the company’s next earnings release expected in late January 2026.
The pullback comes as Microsoft’s AI ecosystem continues to evolve rapidly. The company has integrated OpenAI-powered tools across its product lineup, including Microsoft 365, Azure, and GitHub, solidifying its leadership in enterprise AI solutions. However, concerns over slowing cloud revenue growth and competition from Amazon and Google have sparked short-term caution among traders.
Microsoft’s Intelligent Cloud segment remains a core growth driver, generating over $26 billion last quarter. Yet analysts have warned that enterprise clients may delay large-scale AI spending as they evaluate efficiency gains from early deployments. That has prompted expectations for slightly softer Azure revenue growth in the coming quarters.
From a technical perspective, the MSFT chart indicates a potential corrective phase after a strong two-year rally. The price has retreated from resistance around $555, with the next significant support seen near $460, a level that previously acted as a breakout zone. The projected yellow path on the chart suggests a possible retest of that support before a renewed advance toward $580.
Overall, Microsoft’s long-term trend remains bullish, driven by its expanding AI infrastructure, consistent cash flow, and dominant software ecosystem. However, near-term volatility could persist as the market digests regulatory updates and adjusts to a more moderate growth outlook in the AI sector.
$NASDAQ:MSFT Nice Area to Long or Accumulation !NASDAQ:MSFT Nice Area to Long or Accumulation !
Price Action Tells Every thing !
Cooled already here.
Accumulation place.
nice support area.
Boost if you agree !
Microsoft (MSFT)It's very important that the double top's neckline not be broken. It's hovering around $500.
The market may take a breather, even though the outlook is good and earnings are growing, it has risen too much, too quickly. OpenaAI has created enormous expectations that, based on current figures, will take longer to materialize.

Don’t Rush the AI Infrastructure Arms Race: Waiting Could Win### Don’t Rush the AI Infrastructure Arms Race: Why Patience Could Win
In the tech sector, the urge to invest heavily in GPUs and data centers is strong—to capture market share before competitors do. However, early movers risk a dangerous trio: skyrocketing capital expenditures (capex), fast hardware obsolescence, and inflexible financing. A wiser strategy for many investors and operators? Pause non-essential spending, secure options on emerging technologies like photonic and optical computing, and wait for innovations to mature before locking in major commitments.
#### 1. Hyper-Capex Meets Power Shortages
Big tech firms are projected to spend $350–$400 billion on capex in 2025, mostly for AI infrastructure, with global AI investments potentially hitting $1–2 trillion by 2029 (Goldman Sachs, 2025 forecast). U.S. data center power demand is expected to triple by 2030, surging 22% in 2025 alone (Electric Power Research Institute). Governments, including the U.S. DOE, are already considering power rationing for data centers amid grid strain—echoing overbuild risks in resource-limited sectors like semiconductors (WIRED, Oct 2025).
#### 2. The Hardware Treadmill Accelerates Obsolescence
NVIDIA's high-end GPUs now launch annually (e.g., Blackwell in 2024 to Rubin in 2025), with power draw rising to ~1,200W per unit (NVIDIA Q3 2025 earnings). This shortens cluster lifespans from 3–5 years to 1–2 years, stranding investments in cooling systems and networks. AMD and Intel follow suit, per CUDO Compute's 2025 analysis, amplifying depreciation costs by 40–50% for outdated setups.
#### 3. Financing Shifts to Debt at Peak Cycle Risk
AI projects increasingly rely on debt: Over $200 billion in AI-related bonds issued in 2025, including $30 billion single deals for data centers (Bloomberg). Off-balance-sheet financing for mega-campuses adds leverage, but with hardware depreciating rapidly, any ROI dip could erode equity value—mirroring the 2022 crypto mining debt crisis (Financial Times, Nov 2025).
#### 4. Photonic and Optical Computing Gains Traction
Silicon photonics and optical interconnects offer 10x bandwidth with 50–70% less energy use for AI workloads (Lightmatter whitepaper, 2025). Firms like Lightmatter and Celestial AI are deploying optical I/O in pilots, targeting full photonic accelerators by 2027. Locking into copper-based systems now could leave investors with inefficient "thermal walls," as optical scales to exascale computing (MIT Technology Review, Sep 2025).
#### 5. Ternary Logic: A Disruptive Wild Card
Ternary (base-3) computing, using three states per bit, could boost efficiency 30–50% over binary for AI inference (IEEE Spectrum, 2025). Revived via neuromorphic chips from startups like Mythic, it's lab-proven but not scaled—yet it highlights the peril of over-investing in binary ecosystems, much like quantum's threat to classical bits (Wikipedia; arXiv preprints, 2025).
#### 6. Even Leaders Strain for Capacity
OpenAI has tapped $10 billion in credit lines and chip-leasing deals in 2025 to hoard GPUs, per Reuters. This cash-burn approach ties firms to current tech paths; a photonic pivot could disadvantage debt-laden players, favoring agile newcomers with cleaner sheets.
#### Actionable Steps for Investors and Operators
- **Pause Legacy Builds**: Limit GPU/data center capex to projects with >20% IRR under obsolescence/power stress tests. Opt for modular, 18-month depreciation (The Next Platform, 2025).
- **Secure Future Options**: Sign pilot MOUs with photonics leaders; reserve optical upgrades in contracts for penalty-free swaps (Lightmatter, 2025).
- **Flexible Financing**: Use staged debt, pay-as-you-go leases, and vendor rebates tied to milestones—avoiding the leverage traps seen in recent $50B+ issuances (Financial Times).
- **Co-Develop for Priority**: Invest small in non-recurring engineering (NRE) for optics trials; offer AI datasets for faster validation and queue-jumping (IDTechEx report, Q4 2025).
- **Mitigate Power Risks**: Hedge via futures; site builds near renewables with PPAs expandable to 500MW+ to dodge allocation caps (S&P Global Ratings, 2025).
**Bottom Line**: Amid trillion-dollar AI bets, optionality trumps haste. Wait for photonics and advanced logic to commercialize—delivering cooler, cheaper compute—without the drag of obsolete, debt-fueled infrastructure. Patience positions winners for the next curve.
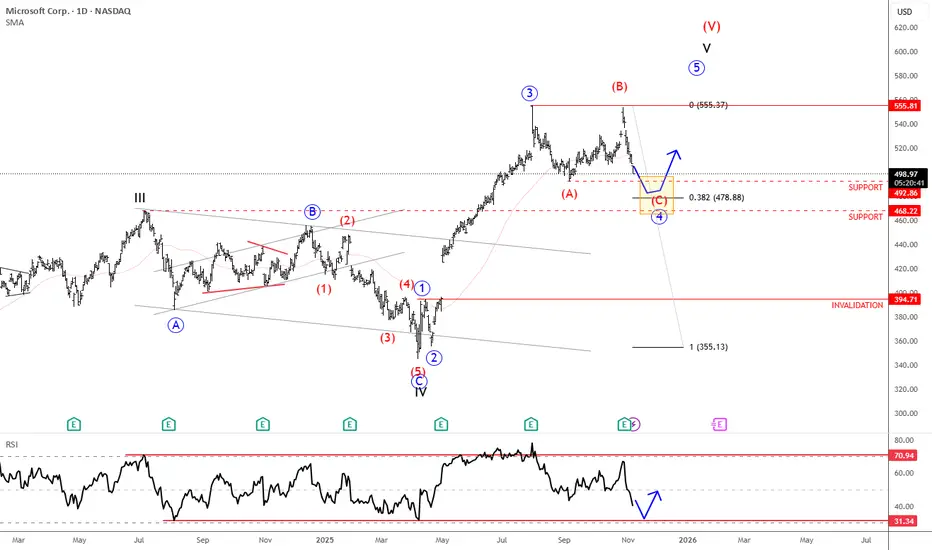
Microsoft Is Finishing Wave 4 CorrectionMicrosoft is in a wave 4 correction, and once it's fully completed, it can extend the rally within wave 5 from a technical point of view and according to Elliott wave theory.
Microsoft is a global technology company founded by Bill Gates and Paul Allen in 1975. It’s best known for its Windows operating system, Microsoft Office suite, and cloud platform Azure. Over the years, Microsoft has expanded into gaming (with Xbox), professional networking (LinkedIn), and AI (through partnerships like OpenAI). Today, it’s one of the world’s most valuable and influential companies, shaping software, hardware, and cloud computing industries.
Microsoft reported earnings last Wednesday after the close, with the price turning lower after reaching new highs. The structure still appears to be a wave four in progress — a flat correction where the current drop likely represents wave C. Wave C often stabilizes near wave A levels, suggesting support around 492 and 468 (the former 2024 high). Holding this zone could set up the next rebound into the final higher-degree wave five.
Highlights:
Trend: Corrective phase, wave C of flat in progress
Potential: Rebound toward new highs once support holds
Support: 492 / 468
Invalidation: Below 394
Note: Watch for stabilization at support before potential wave five continuation
MICROSOFT may fall to $450 if this Support breaks.Microsoft (MSFT) has been trading within a 4-year Channel Up since the November 22 2021 High. Last week it got rejected exactly on its July 28 2025 Resistance (which was a Higher High for the Channel Up) and formed a Double Top, which continues to decline this week as well.
With its 1W RSI also displaying a Bearish Divergence (since the July High) similar to past sell alerts within this Channel Up, it is possible for the stock to correct to at least $450, which represents the 0.5 Fibonacci level where the previous July 2024 - March 2025 correction found Support. That was just above the 1W MA200 (orange trend-line), which also priced the bottom of the October 31 2022 Low but that correction was -38.69%, considerably stronger that -26.54%, which is also plausible if 2026 is a Bear Cycle.
The level that has confirmed those two correction Sell Signals within this Channel Up has been the 1D MA150 (red trend-line). On both occasions, Microsoft closed a 1W candle below the 1D MA150 and confirmed the correction, something that hasn't happened at any other time during these 4 years.
-------------------------------------------------------------------------------
** Please LIKE 👍, FOLLOW ✅, SHARE 🙌 and COMMENT ✍ if you enjoy this idea! Also share your ideas and charts in the comments section below! This is best way to keep it relevant, support us, keep the content here free and allow the idea to reach as many people as possible. **
-------------------------------------------------------------------------------
💸💸💸💸💸💸
👇 👇 👇 👇 👇 👇

MSFT Bearish: H&S Breakdown Eyes 455–465 SupportMicrosoft (MSFT) just cracked lower from a three-month range. After topping near 560 in early August, price chopped between 500 support and 530 resistance before breaking beneath the 20/60-day MAs and the neckline at 510–515. It’s now pressing the 120-day MA around 502 with expanding volatility and heavy sell volume—classic signatures of a confirmed head-and-shoulders top.
Primary path: favor fades into resistance and breakdowns. A weak bounce that stalls inside 515–525 (neckline retest) keeps the short idea intact; a break-and-daily-close below 502 unlocks 490 first, then the 455–465 demand zone. Tactically, shorts can also lean on an intraday trigger (e.g., 1H close below 512) with stops tightened if momentum accelerates. Invalidation for shorts is clean: a daily close back above 531, which would neutralize the breakdown.
Alternative: if 502 holds and buyers reclaim the range, a daily close above 530–531 would negate the bearish structure and open a squeeze toward 555–560. Bulls still have work to do while price sits below the falling 20/60-day MAs and the 530 ceiling.
This is a study, not financial advice. Manage risk and invalidations

MSFT QuantSignals V3 Weekly 2025-11-05MSFT QuantSignals V3 Weekly 2025-11-05
MSFT Weekly Signal | 2025-11-05
• Direction: BUY PUTS | Confidence: 65%
• Expiry: 2025-11-07 (2 days)
• Strike Focus: $507.50
• Entry Range: $3.88
• Target 1: $6.08
• Stop Loss: $2.71
• Weekly Momentum: NEUTRAL (-0.56% 1W)
• Flow Intel: Bearish (High P/C Ratio) | PCR 2.54
• Max Pain: $517.50 (+2.2% vs spot)
• ⚠️ MODERATE RISK WARNING: Consider reducing position size due to moderate confidence level.
⚖️ Compliance: Educational commentary for QS Premium members only. No financial advice.
🎯 TRADE RECOMMENDATION
Direction: BUY PUTS
Confidence: 65%
Conviction Level: MEDIUM
🧠 ANALYSIS SUMMARY
Katy AI Signal: The AI shows a neutral stance with HOLD signal, but provides a bearish bias with target at $517.30 (above current $506.20) and stop loss at $498.61. However, the weekly directional guidance strongly indicates BUY PUTS with composite score of -2.5 and STRONG signal strength.
Technical Analysis: Current price at $506.20 shows -4.13% intraday decline with bearish EMA alignment. Stock is trading below session open ($524.50) and VWAP ($518.66), indicating selling pressure. Weekly momentum is neutral but multi-week trend shows -1.46% decline, confirming bearish bias.
News Sentiment: Bearish with tech sector sell-off led by Palantir affecting AI-focused stocks. OpenAI's CFO comments about break-even and government backstop needs may reduce investor enthusiasm for AI infrastructure plays like Microsoft.
Options Flow: Extremely bearish with Put/Call Ratio of 2.54 indicating heavy put buying. Unusual activity at $560 put strike shows institutional bearish positioning. Max pain at $517.50 suggests upward pressure potential is limited.
Risk Level: MEDIUM-HIGH due to short time frame (2 days to expiry) and potential for short-term reversal in tech stocks.
💰 TRADE SETUP
Expiry Date: 2025-11-07 (2 days)
Recommended Strike: $507.50
Entry Price: $3.80 - $3.95
**Tar
Image
QS Analyst
APP
— 5:43 PM
get 1: $6.08 (60% gain from entry)
Target 2: $8.54 (120% gain from entry)
Stop Loss: $2.71 (30% loss from entry)
Position Size: 3% of portfolio (cautious allocation due to short expiry)
⚡ COMPETITIVE EDGE
Why This Trade: Combines Katy AI's technical bearish bias with overwhelming options flow confirmation and sector weakness catalysts
Timing Advantage: Mid-week positioning with only 2 days to expiry maximizes time decay benefits for put positions
Risk Mitigation**: Conservative strike selection with -0.555 delta provides balanced risk-reward for weekly expiration
🚨 IMPORTANT NOTES
Only 2 days until expiration - time decay will accelerate rapidly
VIX rising to 18.01 may increase option premiums but also volatility
Tech sector sell-off could reverse quickly on positive news
Position size should be conservative due to binary event risk
📊 TRADE DETAILS 📊
🎯 Instrument: MSFT
🔀 Direction: PUT (SHORT)
🎯 Strike: 507.50
💵 Entry Price: 3.88
🎯 Profit Target: 6.08
🛑 Stop Loss: 2.71
📅 Expiry: 2025-11-07
📏 Size: 3.0
📈 Confidence: 65%
⏰ Entry Timing: N/A
🕒 Signal Time: 2025-11-05 20:43:48 EST
⚠️ MODERATE RISK WARNING: Consider reducing position size due to moderate confidence level.

Rebound Setup: Limit-Buy after Short-Term Exhaustion (MSFT)Hi Traders
This is a systematic mean-reversion setup I use across liquid ETFs and large-cap equities.
The goal is simple: enter weakness into exhaustion, not falling knives.
I will place a limit order for MSFT at $511.86. If the order remains unfilled, I will cancel it at the close of trading tomorrow.
Key Concepts:
Oversold short-term conditions
Price deviation vs recent mean
Volume/volatility context
Limit order for the next session only when criteria align
Exit next session open (or rules-based exit, depending on version)
I don’t chase dips — I predefine levels and only enter when price comes to me. This trade idea triggered a limit buy level for today on EFA at 93.55.
General notes:
Works best in mean-reverting environments
Avoid news catalysts & low-liquidity names
This is not a signal service — just a research-based framework
If you like data-driven, rule-based setups, follow along —
I will share more systematic edge ideas like this.
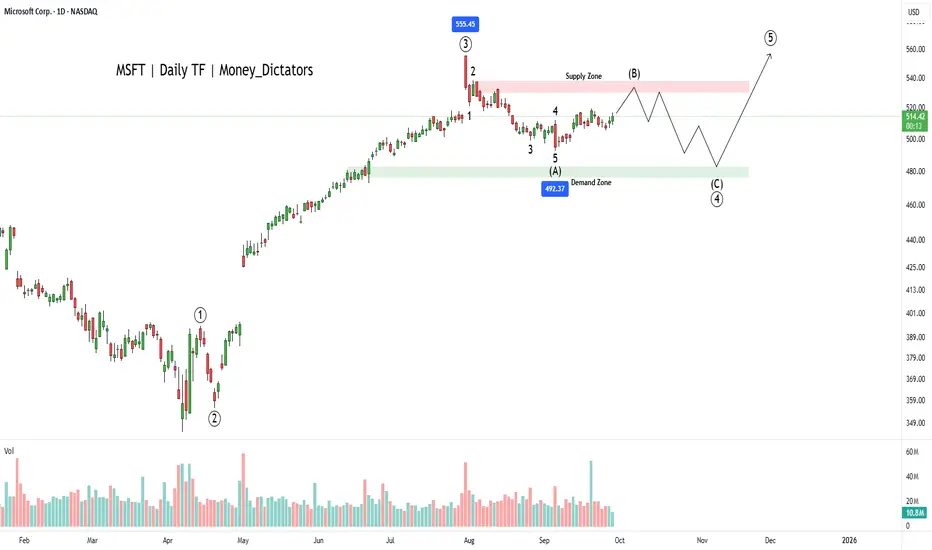
Why MSFT Could Be a Smart Pick in 2025?MSFT has bullish signals from the multiple moving averages, RSI and volume analysis. However, wave principle asks evidence from the buyers. The wave count suggests that the corrective wave (B) is ongoing, and bears will control the final wave of the primary wave 3.
Wave C will start falling nearby the supply zone and high of the 2nd wave of wave intermediate wave A. Wave C can fall up to 476 which will be the strength for wave primary wave 5. As per the chart, breakout above 540 will be a good signal for bulls to take charge back.
Zones:
Supply zone: 538 - 528
Demand zone: 482 - 476
I will update the chart and details shortly.
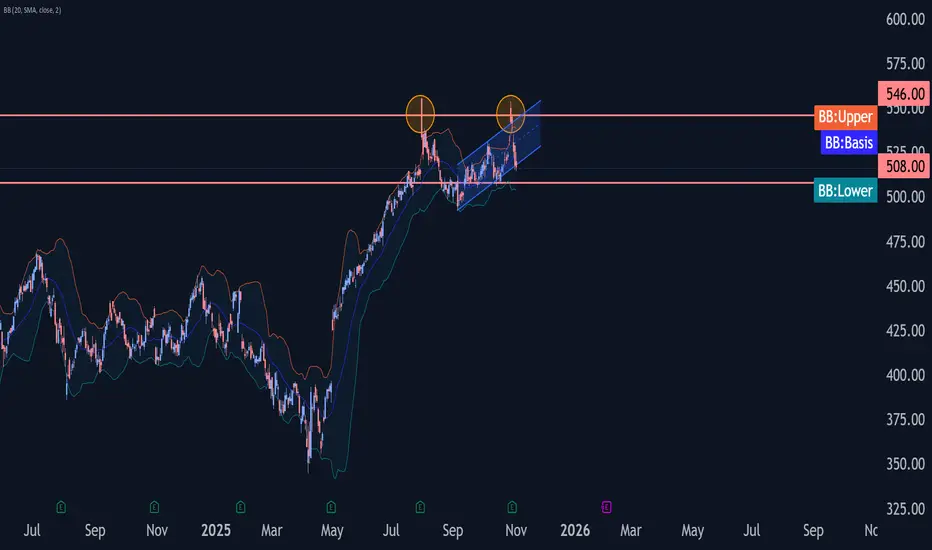
Microsoft Wave Analysis – 3 November 2025- Microsoft reversed from resistance zone
- Likely to fall to support level 508.00
Microsoft recently reversed down from the resistance zone between the key resistance level 546.00 (which stopped impulse wave (1) in July), resistance trendline of the daily up channel from September and the upper daily Bollinger Band.
The downward reversal from resistance level 546.00 started the active short-term ABC correction 2.
Having just broken the aforementioned up channel from September, Microsoft can be expected to fall to the next support level 508.00, target price for the completion of the active ABC correction 2.
Microsoft: Wave X Top Confirmed! As primarily anticipated, Microsoft shares recently reached the high of turquoise wave X just below resistance at $562.17 before quickly reversing lower. This decline, part of the same-colored wave Y, is likely to bottom within our magenta long Target Zone between $477.87 and $451.84, where we also expect the low of magenta wave (4). In our view, this range presents attractive opportunities for long positions, as we anticipate a renewed upward move during magenta wave (5) to follow. This rally should push price above the $562.17 resistance and complete the larger blue wave (I). Alternatively, we see a scenario in which the high at $562.17 marked only the end of beige wave alt.III (probability: 36%). In this case, a drop below the $392.97 support would be expected to form the low of wave alt.IV.

Microsoft Corp, poised for 550?On daily TF, Microsoft looks positive. Currently trying to break neckline of C&H pattern at 531, if sustains 550 would be next destination

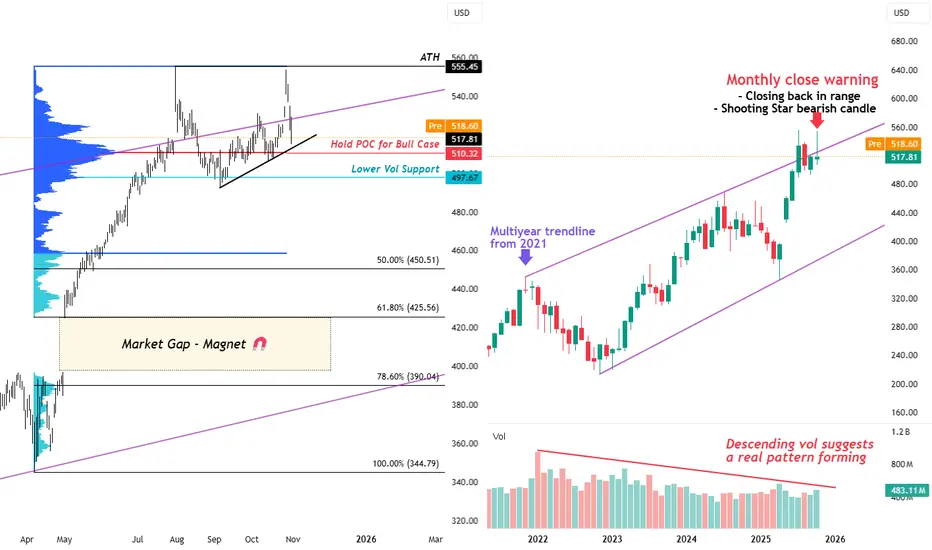
Warning: Microsoft closes BACK under Multiyear Range TrendlineMicrosoft has printed a significant bearish candle in October, and this is a major red flag for technical traders.
This candle not only aligns with a Shooting Star formation — a classic bearish reversal signal — but also closes back under a MULTI-YEAR rising trendline that’s been in play since 2021.
On the monthly timeframe (right chart), we can clearly see a rising channel forming over the past few years. The descending volume adds weight to this structure, suggesting true consolidation or distribution, not just a pause in trend.
📉🐻 Bias: Bearish - Monthly Rejection Candle
Unless buyers step back in soon, the risk of a deeper correction grows.
MONTHLY TIMEFRAME CONTEXT
Shooting Star rejection right at prior channel top
Closing back inside range after brief breakout attempt
Volume trending lower since 2021 — confirms pattern maturity
Interpretation: This kind of rejection after a breakout attempt usually signals exhaustion. Unless volume reverses sharply, the next few months could retrace toward mid-channel support (Around VAL at 50% Fib retracement).
DAILY TIMEFRAME ANALYSIS
MSFT’s recent volume profile highlights $510.32 as the point of control - price with the highest recorded traded volume.
Hold above $510–518 → bulls can still grind higher along the rising trendline
Break below $510 → opens room to test $497.67 (~$500 psychological support)
Below that, we enter the deeper retracement zone:
50% Fib at $450.51 → midpoint of the 2024–2025 rally
61.8% Fib at $425.56 → aligns with top of mid-2025 market gap
78.6% Fib at $390.04 → confluence with multiyear lower trendline, potential 2026 projection target
Market structure note: Losing the Point of Control (POC) at $517.81 would confirm the short-term trend shift and make the $450–$425 zone a strong liquidity magnet.
Closing Thoughts:
Microsoft’s fundamentals have started flashing caution too — not because growth is gone, but because expectations are stretched.
Last quarter’s cloud and AI segments still showed strength, but CapEx guidance surged, margins tightened, and investors didn’t love the tone of the forward outlook. Add to that a hawkish Fed backdrop , slowing enterprise spend, and rotation out of mega-cap tech, and you’ve got a setup that could easily unwind a bit of premium.
For now, it’s a “wait and see” moment — if bulls can defend $510 and the broader market stabilises, this may just be a cooling-off phase. But if we keep closing under the multiyear trendline, that’d confirm a shift from momentum to mean reversion, and the next few months could get interesting.
AI and Big Data Driving Market PredictionsIntroduction: The Rise of Data-Driven Markets
In today’s digital economy, markets are no longer just driven by human instincts, experience, or traditional financial models. Instead, they’re increasingly influenced by artificial intelligence (AI) and Big Data analytics — two powerful technologies that are reshaping how investors, institutions, and even governments understand, predict, and act in financial markets.
Every second, terabytes of data flow through global markets — from social media posts and trading volumes to corporate earnings, satellite imagery, and even weather patterns. This explosion of information is too vast for human analysts to process. That’s where AI and Big Data step in — together, they transform raw, unstructured data into actionable intelligence, allowing for faster, smarter, and more accurate market predictions.
The Data Revolution in Financial Markets
To understand the power of AI in market prediction, we must first understand the foundation it stands on — Big Data.
Financial markets generate massive volumes of data every millisecond — including:
Market data: Price movements, trading volumes, bids and asks.
Economic data: GDP growth, inflation rates, employment reports.
Alternative data: Social media sentiment, news headlines, online reviews, weather updates, and even satellite images of shipping ports.
Traditionally, analysts would rely on limited financial metrics like P/E ratios, earnings reports, or macroeconomic indicators. But Big Data allows analysts to incorporate millions of non-traditional data points, creating a far more detailed and dynamic picture of the market.
For example, an AI model can analyze millions of tweets about a company to gauge public sentiment before its earnings release. It can track credit card spending patterns to anticipate retail sales or use satellite images to estimate oil stockpiles — all in real time.
This shift has given rise to a new era of quantitative and algorithmic trading, where AI-powered systems can detect micro trends, predict price movements, and execute trades faster than any human could.
How AI Transforms Market Prediction
AI (Artificial Intelligence) acts as the “brain” that interprets and learns from Big Data. In financial markets, AI algorithms process data to identify patterns, correlations, and anomalies — and then make predictive models based on these insights. Here’s how it works:
1. Machine Learning (ML)
Machine learning enables systems to learn from past data and improve predictions over time.
For example:
Supervised learning models use historical market data (inputs) and price outcomes (outputs) to predict future price changes.
Unsupervised learning models cluster similar assets or traders based on hidden relationships in the data.
Reinforcement learning helps algorithms “learn by doing” — just like human traders testing strategies.
Through millions of iterations, these models refine themselves and make predictions with growing accuracy — predicting stock prices, volatility, or macroeconomic shifts.
2. Natural Language Processing (NLP)
Financial markets are highly sensitive to language — especially in news headlines, analyst reports, and central bank statements.
NLP allows AI to read, interpret, and quantify human language to assess market sentiment.
For example:
Detecting positive or negative tones in company news.
Monitoring Twitter or Reddit for crowd sentiment (as seen in meme stock movements like GameStop).
Parsing Federal Reserve speeches to predict interest rate decisions.
This gives traders a real-time sentiment score that influences trading decisions and market predictions.
3. Neural Networks and Deep Learning
Neural networks mimic the human brain by processing data through layers of interconnected nodes.
Deep learning models can detect highly complex, non-linear patterns that traditional models miss.
For instance, they can analyze minute-by-minute changes in trading volumes, market depth, and volatility to predict short-term price fluctuations — something essential for high-frequency trading firms.
Applications of AI and Big Data in Market Predictions
The integration of AI and Big Data isn’t theoretical — it’s already transforming multiple areas of the financial ecosystem.
1. Stock Price Forecasting
AI models analyze historical stock data alongside alternative data — like social sentiment, macroeconomic news, and global supply chain metrics — to forecast price movements.
For example, hedge funds like Renaissance Technologies or Two Sigma use AI-driven predictive models to manage billions of dollars, often outperforming traditional funds.
2. Risk Management
Predicting market trends also involves anticipating risks.
AI can detect early signs of market stress, liquidity crises, or systemic shocks by continuously monitoring thousands of variables.
It can forecast volatility spikes, credit defaults, or currency fluctuations — giving traders and institutions the foresight to manage risks proactively.
3. Algorithmic and High-Frequency Trading
AI has revolutionized algorithmic trading. Modern algorithms can execute thousands of trades per second, adjusting instantly to new information.
They analyze real-time data, predict micro-trends, and make split-second decisions that exploit even tiny inefficiencies in the market.
In fact, AI now accounts for nearly 70–80% of trading volume in developed markets like the U.S.
4. Portfolio Optimization
AI tools also help investors construct better portfolios.
They consider not only traditional financial metrics but also alternative data, market sentiment, and macroeconomic conditions to balance risk and return dynamically.
AI-driven robo-advisors like Wealthfront or Betterment use these techniques to provide personalized, automated investment strategies for retail investors.
5. Predicting Macroeconomic Trends
AI systems can forecast larger market cycles by analyzing data on global trade flows, inflation trends, commodity prices, and geopolitical news.
By recognizing long-term correlations between macro indicators and market behavior, AI can predict recessions, bull runs, or sector rotations well in advance.
6. Sentiment and Behavioral Analysis
Markets are driven by human psychology as much as numbers.
AI-powered sentiment analysis tracks the emotional tone of market participants — from optimism to panic — across millions of online conversations.
This behavioral data helps institutions anticipate potential rallies, sell-offs, or bubbles before they become visible on charts.
Big Data: The Fuel Behind AI Predictions
While AI provides the intelligence, Big Data provides the fuel.
Here’s how Big Data enhances market prediction accuracy:
1. Volume
Financial markets produce petabytes of data daily. The more data AI has, the better it can identify rare but powerful patterns that drive market movements.
2. Variety
Data isn’t limited to price charts anymore. It includes text, audio, video, geolocation, and even biometric signals.
For example, hedge funds use satellite images to count cars in retail store parking lots — predicting sales before official earnings reports.
3. Velocity
Markets move in milliseconds, so real-time data streams are crucial.
AI systems continuously ingest and analyze live feeds from exchanges, news outlets, and APIs to deliver up-to-the-second predictions.
4. Veracity
High-quality, verified data improves model reliability. Big Data systems use advanced filtering and validation to eliminate noise, fake news, or biased data sources — ensuring predictions remain credible.
Case Studies: AI and Big Data in Action
1. BlackRock’s Aladdin Platform
BlackRock’s Aladdin is a sophisticated AI and Big Data platform that monitors market conditions, analyzes risk exposures, and simulates economic scenarios.
It manages trillions in assets by identifying trends and warning fund managers about potential shocks — all through predictive analytics.
2. JPMorgan’s LOXM
JPMorgan developed LOXM, an AI-based execution algorithm that uses historical and real-time trading data to determine the best execution strategies.
It minimizes market impact and optimizes trade timing — outperforming human traders in efficiency.
3. Google and Predictive Search for Economics
Google has used search data to predict economic trends, like unemployment rates or housing demand.
By analyzing search patterns, economists and traders gain early insight into shifts in consumer behavior — long before official data releases.
Benefits of AI and Big Data in Market Predictions
Speed and Efficiency: AI can analyze millions of data points in seconds, offering instant insights.
Accuracy and Adaptability: Machine learning models continuously refine themselves with new data, improving predictive accuracy.
Reduced Human Bias: Algorithms operate purely on data, reducing emotional trading errors.
Comprehensive Insights: Integration of traditional and alternative data gives a 360° market view.
Early Warning Systems: AI can flag risks before they escalate, protecting portfolios from shocks.
Challenges and Limitations
While powerful, AI and Big Data are not without challenges.
Data Overload: Not all data is useful — filtering noise remains difficult.
Model Overfitting: AI models may perform well on historical data but fail in real-world scenarios.
Black Box Problem: Many AI systems are opaque — even developers can’t always explain why they make certain predictions.
Ethical and Regulatory Issues: The use of alternative data (like social media or geolocation) raises privacy concerns.
Market Feedback Loops: When too many traders use similar AI strategies, markets can become synchronized — leading to flash crashes.
The Future of AI-Driven Market Predictions
The future lies in combining AI, quantum computing, and decentralized data networks.
Quantum AI could process complex financial models at lightning speed, solving predictive problems beyond current capability.
Explainable AI (XAI) will make algorithms more transparent and accountable.
Federated data systems will enable firms to share insights without compromising privacy.
Moreover, as AI models become more integrated with blockchain data, they’ll bring transparency to global financial flows and improve risk forecasting in digital asset markets.
In the next decade, financial institutions won’t just use AI as a tool — they’ll become AI-driven organizations, where every investment decision, risk assessment, and strategic move is guided by intelligent algorithms trained on global data streams.
Conclusion: Data is the New Alpha
The age of intuition-based investing is rapidly giving way to an era of data-driven intelligence.
AI and Big Data have democratized predictive power — enabling not just hedge funds, but even retail traders, to forecast markets with unprecedented precision.
Yet, as powerful as these tools are, human judgment remains essential. The best results come from combining human insight with machine intelligence — intuition guided by data.
In financial markets, information has always been power.
But in today’s landscape, data — interpreted by AI — has become the ultimate competitive edge, driving the next frontier of market prediction, efficiency, and innovation.