PALANTIR PLUS GOLD. VOLATILITY + STABILITY = EXPLOSIVE MIXTUREWere you still dream about super-duper hyped crypto/ AI names, which change each other like TikTok Reels or for example Google Shorts?..
.. but shortening Big portfolios or even tight ones, like Magnificent Seven, to just Palantir and Gold can provide a focused approach with compelling performance and risk management, given how both assets have outperformed tech mega-caps in 2025.
The process involves strategic decision-making, in-depth performance analysis, and clear rebalancing steps.
Magnificent Seven: 2025 Performance Context
The Magnificent Seven - Alphabet, Amazon, Apple, Meta, Microsoft, Nvidia, Tesla - have dominated market attention. But in 2025, their stocks saw significant declines. Tesla dropped by around 38%, Apple and Nvidia by 21%, while the others also posted double-digit losses in a few quarters ago. High market concentration and rising tariffs pressured these tech giants, leading investors to reconsider diversification. This environment sets the stage for seeking alternative performers.
Why Focus on Palantir and Gold?
Palantir (PLTR) has surged as one of the top S&P 500 performers, gaining over 138% this year, far surpassing the Magnificent Seven ETF, which (in the best case) print low double-digit numbers in 2025. Palantir's edge lies in its government contracts and leadership in AI platforms, making it a market leader during sector disruptions and economic uncertainty.
Gold has soared nearly 44% year-to-date, reaching record highs as the most crowded trade on Wall Street. As tech stocks falter, gold's appeal as a safe haven has intensified amid tariffs, a weakening dollar, and economic uncertainty. Major fund managers now see gold as the top-performing asset for 2025.
Portfolio Construction: Reducing to Two Securities
Capital Allocation. Split proceeds between Palantir (growth/innovation) and gold (risk-off hedge). A typical split could be 50/50 for simplicity or tailored to risk tolerance - higher gold allocation for defensive profiles, higher Palantir for aggressive growth.
Risk Management: Hedge Palantir’s volatility plus gold’s stability. Stability.... plus volatility. Two words to explain it all.
Rationale and Benefits
Concentrating on two uncorrelated assets amplifies both upside (Palantir) and defensive resilience (gold). Diversification outside tech mega-caps mitigates regulatory and single-sector risks, as seen in the recent performance divergence. Enhanced returns: Palantir’s growth-oriented rally and gold’s safe-haven gains both outperformed not only the S&P 500 but the tech elite.
By systematically selling underperforming Magnificent Seven stocks and reallocating into Palantir and gold, the portfolio tilts toward assets with strong 2025 track records and complementary risk profiles, aligning with current market realities and future outlook.
Have you seen the similar before or not yet, Palantir plus Gold move together... in one-way direction.. for TWENTY straight months in a row.
--
Best wishes,
@PandorraResearch Team
Trade ideas

PALANTIR - STOCK REPORT1) Executive summary
Palantir (PLTR) showed very strong revenue growth in 2023–2025 driven by commercial expansion and adoption of its platforms (Gotham, Foundry) across government and private sectors. As of September 2025 the company is clearly profitable on a TTM basis with positive operating margins, strong cash generation (high FCF) and a sizable net cash position. However, relative valuation is extremely high (P/S, EV/Rev, P/E multiples well above peers), reflecting aggressive growth expectations and strong speculative interest.
Main risks: high sensitivity to AI sentiment, reliance on large government contracts and a concentrated commercial customer base, potential regulatory pressure and share-price volatility.
Short recommendation: Hold.
Rationale: financial strength and growth justify exposure, but valuation requires the company to deliver continued high growth and margins; new purchases should wait for a pullback or operational confirmations (stabilized growth rate and guidance). Risk-seeking/high-return investors may consider a partial position.
2) Key data and company overview
Name: Palantir Technologies Inc.
Sector: Software — Data analytics / Enterprise AI
Primary market: NYSE/NASDAQ (Class A) — Ticker: PLTR
Business brief: Software platforms for data integration, analytics and decision‑making (Gotham for governments, Foundry for enterprises, Apollo for deployment). Revenue model: software licenses, SaaS/cloud subscriptions, implementation services and multi‑year government contracts. Main geographies: USA (largest weight, both government and commercial), Europe, expanding APAC.
Market & key metrics (sources: StockAnalysis / MarketBeat / Macrotrends; close price 22‑Sep‑2025):
- Market cap: ~425–433B USD
- Shares outstanding: ~2.365B
- Float: ~2.19B
- P/E (TTM): ~560–595
- EV/EBITDA (TTM): ~700
- Last close (22‑Sep‑2025) used: 179.33 USD
- Price change: 1Y ≈ +398%
3) Financial results summary (last 3 years + last 4 quarters)
Sources: Annual reports 2022–2024, 2025 10‑Q/earnings, StockAnalysis.
TTM / annual rounded (USD millions):
- Revenue (TTM): 2.87B
- Net income (TTM): 462.19 M USD
- Operating income (TTM): 569.55 M
- Diluted EPS (TTM): 0.30
- Free cash flow (TTM): ~1,710
- Operating margin (TTM): 26.83%
- Net margin (TTM): 32.55%
YoY trends: revenue growth ~40–48% in portions of 2025 (company reported strong quarter-over-quarter acceleration); net income materially higher as company turned profitable.
Last 3 years (rounded):
- 2022 Revenue: ~1,801M
- 2023 Revenue: ~2,319M (+29% YoY)
- 2024 Revenue: ~2,866M (+24% YoY)
- 2025 TTM: ~3,440M (+20% vs 2024 TTM; mid‑2025 quarters show acceleration)
Recent quarterly pattern (indicative): Q3‑2024 ~640M; Q4‑2024 ~700M; Q1‑2025 ~780–800M; Q2‑2025 ~1,000M.
Comment: strong commercial acceleration in 2024–H1 2025, especially U.S. commercial; profitable on TTM with high FCF, though EPS/margins affected by stock‑based comp and non‑cash items.
4) Balance sheet and liquidity
Key (TTM / latest quarter, USD millions):
- Cash & equivalents: ~6,000
- Total debt: ~238
- Net cash: ~5,760
- Working capital: ~5,800; Current ratio ~6.3; Quick ratio ~6.19
- Debt/Equity: ~0.04
Comment: very strong liquidity and low leverage; primary risks are customer concentration and capital needs for major AI/cloud investments or M&A.
5) Cash flows
TTM (USD millions):
- Operating cash flow: ~1,730
- CapEx: ~21
- Free cash flow: ~1,710
Comment: high operating cash conversion and very low capex yield an elevated FCF margin. Increased investment in cloud/AI or acquisitions could raise capex and cash use.
6) Valuation
Peers: Snowflake (SNOW), CrowdStrike (CRWD), Splunk (SPLK).
Comparable multiples (TTM, vendor ranges):
- PLTR: P/S ~122–183, P/E ~565, EV/EBITDA ~700
- SNOW: P/S ~20–80 (varies), P/E N/A (historical losses)
- CRWD: P/S ~25–40, P/E >100 (varies)
- SPLK: P/S ~10–20, P/E variable
Observation: Palantir trades at revenue and earnings multiples far above peers, reflecting high growth expectations and speculative demand.
Simple DCF (assumptions stated):
Base revenue TTM = 3,440M.
Growth assumptions: 2026 +30%, Yr2 +15%, Yr3 +10%, Yr4 +6%, Yr5 +5%; terminal growth 3.5%.
EBIT margin converging to 18%; tax 18%; CapEx = 1% of revenue; WACC = 9%. Result: implied fair value per share roughly in the range ~8–25 USD (highly sensitive to assumptions).
Sensitivity: lower WACC / higher terminal growth materially raises value; higher WACC or lower growth materially lowers it.
Detailed year‑by‑year DCF is available on request.
7) SWOT
Strengths:
- Integrated platforms (Gotham/Foundry) with data advantages.
- Strong net cash position and high FCF.
- Rapid commercial AI adoption and high customer retention.
- Strategic government contracts with entry barriers.
Weaknesses:
- Revenue concentration in a few large clients/government.
- High share‑price volatility and valuation disconnect vs peers.
- Dependence on costly AI/R&D talent.
- Historical share dilution.
Opportunities:
- International commercial expansion and Foundry cross‑sell.
- Monetization of advanced AI/cloud offerings.
- Partnerships with hyperscalers.
- Upsell within regulated enterprises.
Threats:
- Regulatory pressure on data/AI use.
- Intensifying competition (Snowflake, Databricks, cloud vendors, AI startups).
- Reputational risks tied to government contracts.
- AI sentiment correction reducing valuation.
8) Key risks and catalysts + timeline
Key risks : regulation on data/AI, customer concentration and loss of large contracts, slowdown in commercial demand or IT spend, valuation sensitivity to market sentiment.
Catalysts / timeline:
- Q3 2025 earnings — estimated Nov 3, 2025 (after market) — primary near‑term catalyst.
- Major government contract announcements or large ARR renewals (timing variable).
- Product/feature releases and cloud partnerships (ongoing).
9) Final recommendation and risk positioning
Operational recommendation: Hold .
Time horizon: medium term (12–24 months) to monitor growth consolidation and margin confirmations.
Risk/return profile: High risk / potentially high reward — elevated valuation creates meaningful downside if growth slows; upside depends on sustaining high growth and margins. Risk‑tolerant investors who believe in Palantir’s AI/commercial momentum may hold or take a partial position with risk controls; risk‑averse investors should avoid new purchases until valuation normalizes.
10) Sources and data date
Main sources: Palantir Investor Relations (SEC 10‑K / 10‑Q / earnings releases), TradingView, public research notes. Data date: 22 September 2025. Assumptions: market cap ~428B; close price 22‑Sep‑2025 = 179.33 USD; shares outstanding = 2.365B.

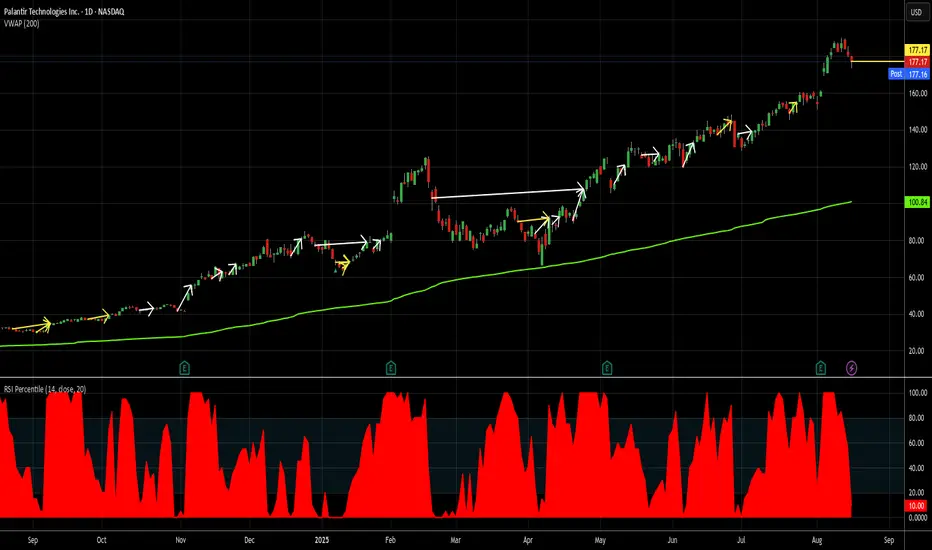
Again and again and again and again...long at 177.17If you want my case for trading PLTR and the chart for the last year isn't enough, consult my last PLTR idea here -
Since then, nothing has changed, in my mind, except there's been a few more profitable trades added to my account thanks to PLTR.
+5.73% in 2 days
+10.06% in 4 days
+9.32% in 3 days
+10.76% in 3 days
etc.
You get the idea and now understand why I keep coming back.
It is still undefeated - no losing trades ever on PLTR. I truly do not expect that to change now. One could argue any idiot could have made money trading PLTR this year. And they aren't wrong. My question back, though, would be "why weren't you?". There are all sorts of reasons people use to not trade PLTR and good for them. I'm fine with that. I will trade it and I expect to make money quickly doing so. That doesn't ALWAYS happen, but it usually does.
I will add tactically if the trade doesn't close quickly and while the plan is to squeeze a little more juice out of this one than most, market conditions will dictate how I close.
It could be a FPC and if it's up some scandalous amount on Monday, maybe even sooner.
As always - this is intended as "edutainment" and my perspective on what I am or would be doing, not a recommendation for you to buy or sell. Act accordingly and invest at your own risk. DYOR and only make investments that make good financial sense for you in your current situation.
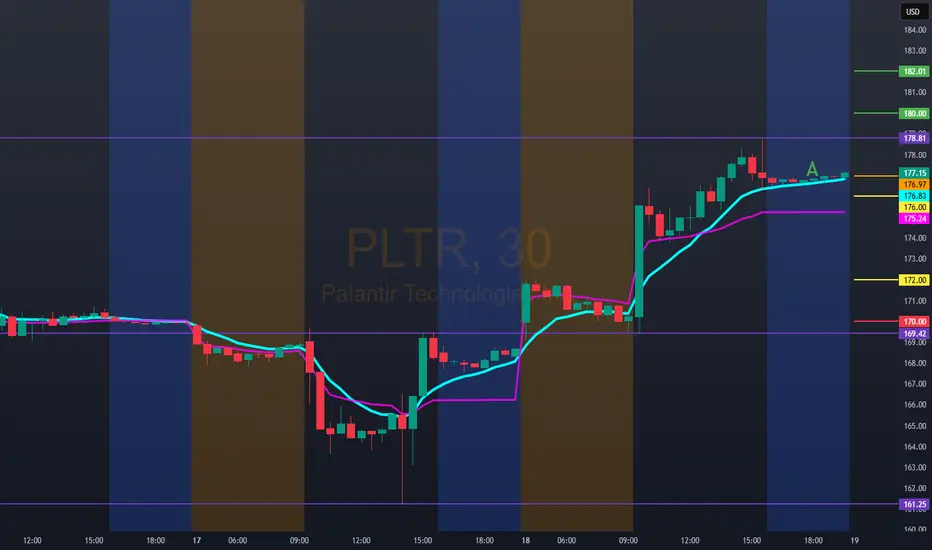
Hello Trader, long time no see for tomorrow PLTR: 176.97Bullish entry 180.00/182.00 with possible target 188.00/190.00
Bearish technical entry below 176.00 to 172.00. This last price would reverse the previous bullish trend and could also function as a rebound price.
If it were to fall below 172.00, we would enter bearish below 170.00.
There is no major economic report for tomorrow. Also, remember it's Friday.
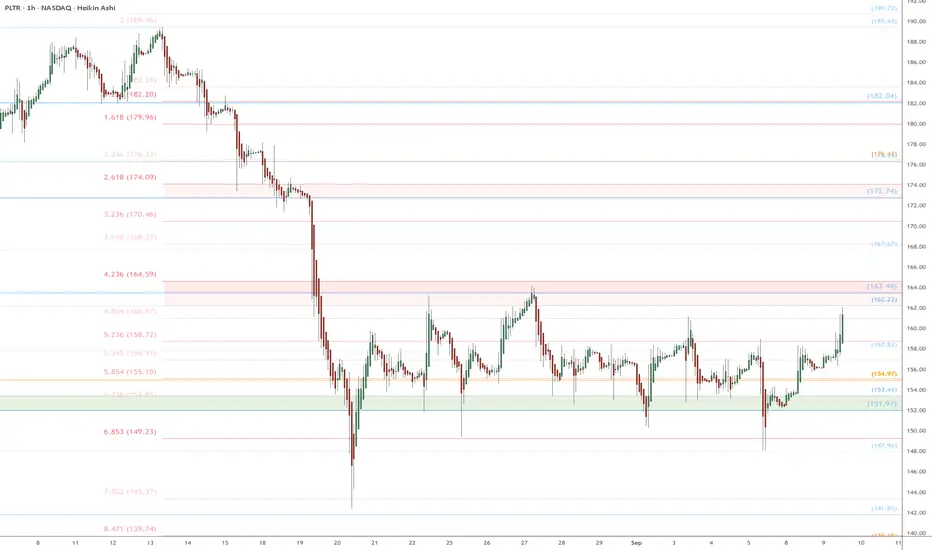
PLTR relaunch? Watch $162-164 key Resistance to mark new BOTTOM PLTR has been accumulating above a decent support zone.
About to try a break out of resistance zone $162.22-164.59
Look for a grind through the red zone then launch on break.
.
See "Related Publications" for previous plots,
such as this $40 BOTTOM call with PERFECT levels:
Hit BOOST and FOLLOW for more such PRECISE and TIMELY charts.
========================================================
.
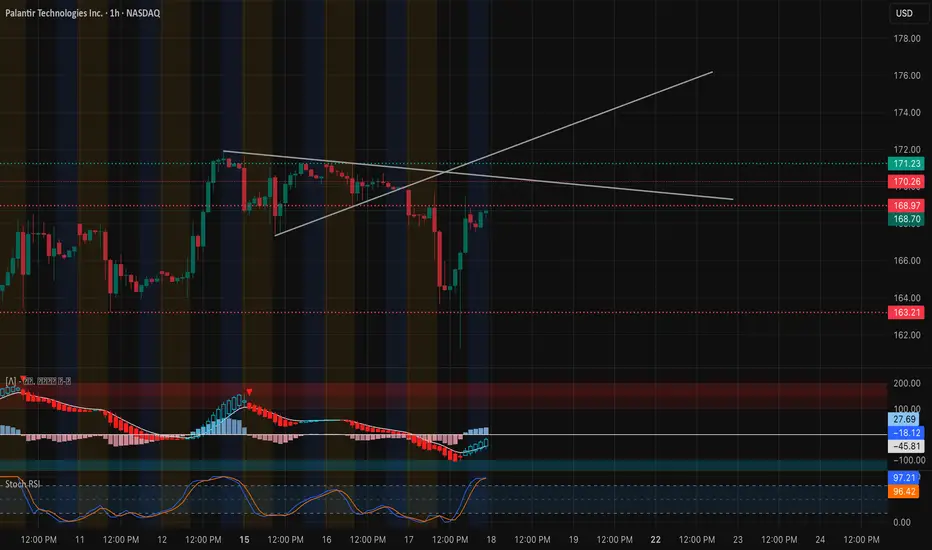
PLTR Setting Up for a Bounce – Sept 18 Game PlanHere’s my fresh read on Palantir for Wednesday’s session, using the 1-hour chart and current GEX data.
1️⃣ Price Action & Structure
* Quick recovery: PLTR found solid demand near $163 and pushed back toward the $170 zone, right where a descending trendline and prior supply meet.
* First ceiling: Immediate resistance sits at $170–171.2. An hourly close above this range could set up a squeeze toward $172.5–175.
* Support watch: $167.5 and $165 are key downside levels if momentum fades.
2️⃣ GEX (Options Flow) Check
* Balanced flow: Calls make up about 47% of options volume, better than NVDA but not screaming bullish.
* Call walls: Strong clusters at $170 and $172.5 (around 77–85% call concentration) can act as magnets if bulls follow through.
* Put defense: Next meaningful put walls sit at $162.5 and $157.5, giving PLTR a defined floor if pressure returns.
3️⃣ Trading Thoughts
* Bullish plan: Consider a starter long on an hourly close over $171.2, aiming for $172.5 and possibly $175. Stop under $167.5.
* Bearish plan: If price rejects $170 and slips below $167.5, a move back to $163 is likely, with $160 as a deeper target.
4️⃣ Option Angles
* Upside play: Short-dated call spreads (170/175) offer defined risk for a breakout.
* Neutral to cautious: Selling puts around $160 can work if you believe the $162.5 gamma wall will hold.
5️⃣ My View
Palantir is showing early strength after a healthy shakeout. If it can firmly retake $170 with volume, bulls have a clean shot to reclaim the mid-$170s. I’ll wait for that hourly confirmation before committing.
Disclaimer: This analysis is for educational discussion only and is not financial advice. Always do your own research and manage risk before trading.
Palantir Technologies (PLTR) BUYPalantir Technologies (PLTR) has become synonymous with data-driven decision-making. Governments and corporations pay heavily for its AI-driven analytics, making Palantir a long-term institutional play.
PLTR 1H + GEX Game Plan for Tue, Sep 16PLTR Coiling Below 172 — Ready to Break or Back Off? ⚡️
Market Structure (1-Hour View)
* Sideways coil: Palantir is consolidating between 170–172 after a sharp rally from 162 earlier this week.
* Trend support: The uptrend line is holding around 168–169, giving a steady base if buyers stay engaged.
* Momentum: MACD is easing with negative bars, and Stoch RSI near 30 suggests short-term oversold conditions with a potential bounce setup.
Key Levels to Watch
* Resistance: 171.4–172.0 (immediate ceiling), 173.1, and 175.0 (gamma resistance).
* Support: 167.4, then 164.0 as the bigger demand zone.
GEX Read (Sep 16)
* Highest positive NETGEX / Gamma resistance: 175.0
* 2nd Call Wall: 172.0, 3rd Call Wall: 177.5.
* Put walls / magnets: 162.5, 157.5, 152.5.
* Options sentiment: Calls ~56%, IVR ~15.7, IVx ~56 — a healthy call bias with moderate implied volatility.
Implication:
* Dealers may aim to pin PLTR between 167 and 172 until strong flow forces a breakout.
* Hourly close >172 opens a path to 173 → 175 and potentially 177.5.
* A drop <167 could accelerate toward 164 and 162.5.
Trade Scenarios
1) Bullish Breakout
* Trigger: Hourly close >172 with rising volume.
* Entry: 172.2 on retest.
* Targets: 173 → 175 → 177.5.
* Stop: Below 170.5.
* Options: 172/175 call debit spread for a near-term swing.
2) Range Fade
* Trigger: Failure to clear 171.5 with repeated rejections.
* Entry: 171.3 short.
* Targets: 168 → 167.4.
* Stop: Above 172.5.
* Options: 171P or 171/167 put spread for a quick drop.
3) Breakdown
* Trigger: 1H close <167 with a failed retest.
* Entry: 166.8 short.
* Targets: 164 → 162.5.
* Stop: Back above 168.5.
* Options: 167/162.5 put spread if bearish momentum builds.
Scalping & Swing Notes
* First-hour trade is key: acceptance above 172 favors longs; repeated rejection favors fade setups.
* EMA/VWAP retests near 170–171 give low-risk scalps if the breakout plays out.
Risk & Management
* Implied volatility moderate, giving decent pricing for debit spreads.
* Scale out profits at first target and trail stops aggressively once price reaches 173+.
This analysis is for educational purposes only and does not constitute financial advice. Always trade with a plan and manage risk carefully.

Palantir Technologies sees bullish breakout signals ahead
Current Price: $171.43
Direction: LONG
Targets:
- T1 = $178.00
- T2 = $182.50
Stop Levels:
- S1 = $168.50
- S2 = $166.00
**Wisdom of Professional Traders:**
This analysis synthesizes insights from thousands of professional traders and market experts, leveraging collective intelligence to identify high-probability trade setups. The wisdom of crowds principle suggests that aggregated market perspectives from experienced professionals often outperform individual forecasts, reducing cognitive biases and highlighting consensus opportunities in Palantir Technologies.
**Key Insights:**
Palantir Technologies is increasingly viewed as a leader in AI-driven data analytics and government software solutions. Its recent focus on enhancing its artificial intelligence platform has made the stock more attractive to institutional investors betting on the growth potential of both AI and government contracts. Analysts have noted that the company’s resilience during periods of market uncertainty sets it apart, as its services remain critical to governmental and defense entities—a sector less prone to cyclicality.
Furthermore, the company’s financials signal growing sustainability: with improving free cash flow and strong demand for its tools, Palantir exhibits the capacity to scale its operations. One key driver is its strategic partnerships in the commercial sector, which are adding diversity to its traditionally government-heavy revenue streams. These tailwinds could stimulate long-term bullish sentiment and provide a foundational floor to the stock’s pricing trends.
**Recent Performance:**
Palantir shares have demonstrated firm upward momentum in recent weeks, breaking through medium-term resistance levels and recording nine consecutive green trading sessions. The stock’s current consolidation phase near $171.43 reflects a technical setup that could precede a breakout. Palantir has trended higher following strong quarterly earnings, which highlighted increasing adoption of its AI-powered tools. This rally represents a climb of roughly 15% from a recent dip near $148, driven by improving sentiment and institutional buying activity.
**Expert Analysis:**
Technicians have identified a bullish continuation pattern forming for Palantir, supported by a rising moving average ribbon. The RSI (Relative Strength Index) remains elevated but not yet in overbought territory, suggesting space for further upside without immediate correction risks. The MACD (Moving Average Convergence Divergence) recently gave a bullish crossover signal, reinforcing the view of sustained momentum in the short term.
Experts believe the psychological $180 level could serve as the next major resistance zone—a breach of which might propel the stock even higher, potentially unlocking buying activity from sideline investors. Additionally, the volume profile reflects accumulation phases, which insiders interpret as institutional positioning ahead of anticipated price appreciation.
**News Impact:**
Positive market sentiment toward Palantir was recently boosted by announcements about its partnerships in critical sectors like healthcare and defense. Its platform's expansion into commercial solutions could mitigate dependency on government contracts and establish it as an AI leader for broader industries. Meanwhile, the company’s vocal stance on ethical AI development has attracted favorable media attention—a factor that traders believe may improve perception and fortify investor confidence as AI regulation discussions unfold globally.
**Trading Recommendation:**
We recommend taking a long position on Palantir Technologies with an entry point near the $171.43 price level. The bullish technical indicators, combined with broader sector momentum, make this an attractive trade for medium-term growth. The defined stop levels protect downside risk, while the upside potential aligns with historical resistance zones of $178.00 and $182.50. As governments and enterprises increasingly demand sophisticated AI solutions, Palantir is well-positioned to outperform its peers in the coming quarters.
Do you want to save hours every week?

PLTR Set to Test $172.5 Breakout — Key Levels to Watch for Sep15Market Preview
* Macro backdrop: U.S. index futures are mixed after last week’s tech-led rally. Rates and dollar steady. No major premarket shocks so far.
* Sector tone: Software and AI remain strong, with ongoing institutional call buying and high GEX levels hinting at continued interest.
Technical Analysis – PLTR
Trend & Structure (1-Hour Chart)
* Price is consolidating around $170–172 after a strong push from mid-$150s.
* Uptrend remains intact with higher highs/lows and a clean ascending channel.
Key Levels
* Support: $168.3 (short-term pivot), $164.3 (deeper retrace), $157.5 (major HVL / 3rd Put Wall).
* Resistance: $171.9 (2nd Call Wall), $176 (GEX7 zone), $182–184 (next major target).
Momentum & Indicators
* MACD on 1H is bullish and expanding.
* Stoch RSI near overbought but still supportive if price consolidates.
* Volume shows healthy accumulation on recent pullbacks.
Options/GEX Insight
* Net positive GEX with Call walls stacked at 172.5 and 180 suggests option-market makers are positioned to support upward pressure.
* IVR 13.4 and IVx ~54 indicate volatility is moderate and not overheated.
Trade Scenarios for Sept 15
* Bullish Plan:
* Entry: Break/hold above $172.5 with volume.
* Targets: $176 → $180.
* Stop: Below $168.
* Bearish/defensive (if rejection occurs):
* Entry: Loss of $168 support.
* Targets: $164 → $158.
* Stop: Above $172.
Summary
PLTR enters Monday with a firm bullish bias. A clean breakout above $172.5 can open a run toward $176–180. Watch the $168 pivot as the line in the sand for trend continuation.
Disclaimer: This analysis is for educational purposes only and does not constitute financial advice. Always do your own research and manage risk before trading.

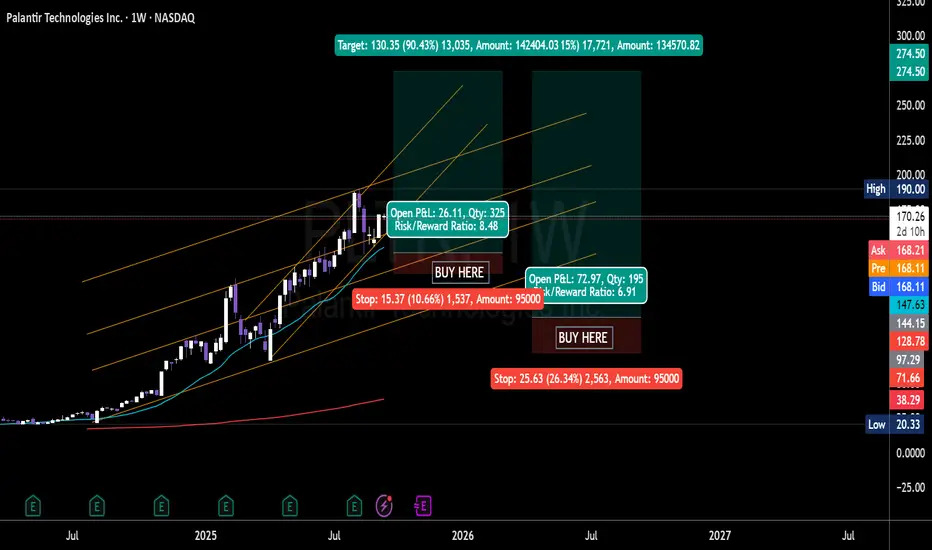
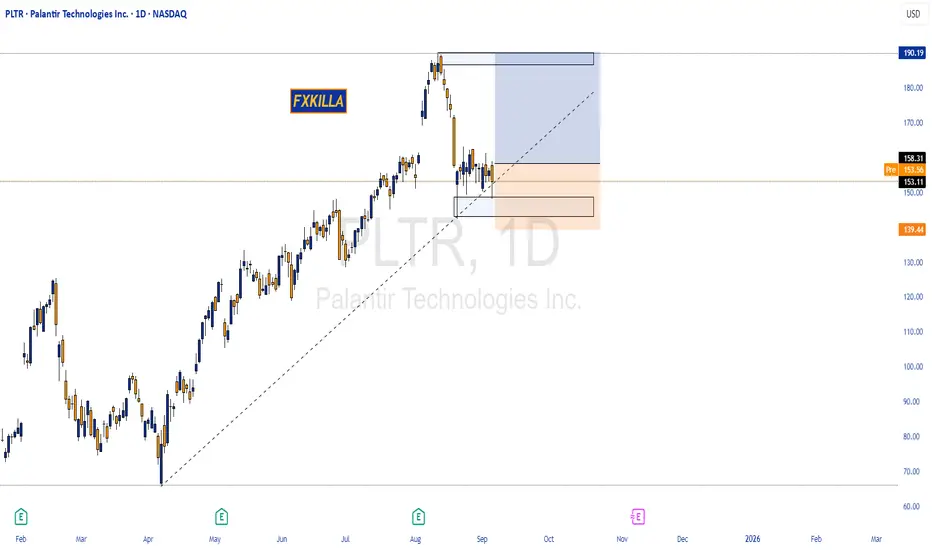
PalantirPrice made it into the target box last Friday. If you recall, I placed this box a little under a month ago. No, price was not guaranteed to make it to this area. However, it is the STANDARD place for price to have went. Not to make it to this area would have been the exception, not the norm.
That being said, I do not think this move higher is done yet. Right now, we're seeing a reaction from the 0.618 retracement fib. I believe this is also due to price being within a micro-wave 4. If this is the case, we should get OMH with the possibility of two more if I am off by a degree. Either way, I believe we move slightly higher before completion.
The minor C wave, if price terminates within this box, should be targeting the $130's - $112 area. Time will tell, but right now, we should be focusing on the last move higher coming.

PLTR to 234Big weekly bullish engulfing candle to end the week after a perfect 0.618 rejection 2 week prior. Upside target is just short of 234, stop is 2 fib levels below. If this one doesn't work out, I will be looking for another entry lower.

PLTR Bubble Has PoppedHello I am the Cafe Trader.
Today we’re revisiting PLTR. A few weeks ago, I called this a bubble — now I believe the bubble has popped.
Price ran into profit-taking levels and is now slipping back through light demand. The ugly price action was finally squeezed, and now you have an exhaustion from buyer coming down to test the light demand.
It's important to note that although this light demand is holding, we are getting a cold reaction from this area, suggesting buyers might not be as committed as before.
Red Scenario
If buyers can’t hold this light demand zone, expect PLTR to flush deeper. The next area of interest is strong retail support around 120–125, but I don’t think that holds for long. Below that, the top of demand around 90 becomes the next stop. Ultimately, the real institutional buyers are sitting down closer to 60 — and that’s where this could be headed if momentum really unwinds.
The only way this stays bullish is if light demand holds and we get a strong bounce. That would open the door for another test of the 169 profit target zone. Without that, everything still points lower.
Longer term, I see PLTR repricing down into institutional levels. Until we see aggressive buyers step in, I’d consider this bubble popped.
Happy Trading,
@thecafetrader

Palantir: Approaches Key Resistance Palantir has recently posted strong gains, moving closer to our magenta Target Zone between $171.80 and $184.62, which we’ve identified as the (corrective) top of magenta wave (B). In this range, we expect the stock to reverse course and head lower, continuing the broader correction—making this a favorable area for short positions. Magenta wave (C) is then projected to reach the green Target Zone between $117.42 and $95, completing the green wave . At that point, we anticipate a more substantial corrective rebound in wave . The green zone is therefore well-suited for taking profits on short trades or initiating short- to medium-term long-positions to capture the (temporary) advance of wave . For these long trades, a stop set 1% below the lower boundary of the zone can help manage risk.

PLTR Weekly Call Alert: Strike $170 Ready to Soar!
🚀 **PLTR Weekly Call Alert | 2025-09-10** 🚀
**📈 Directional Bias:** Strong Bullish (70% Confidence) ✅
**Why This Trade?**
* 🔹 Daily RSI 60.1 & Weekly RSI 60.8 rising → momentum confirmed
* 🔹 Call/Put flow 2.03 → institutional call positioning
* 🔹 Breakout above prior weekly high (\$162.40)
* ⚠️ Weekly volume only 1.0x → weaker confirmation; requires active management
**💡 Recommended Trade:**
* **Instrument:** PLTR weekly CALL
* **Strike:** \$170 💰
* **Expiry:** 2025-09-12
* **Entry Price (Ask):** \$0.23
* **Direction:** LONG ✅
* **Position Size:** 1 contract (scale to account risk, high-gamma weekly scalp)
* **Entry Timing:** Market open
**🎯 Targets & Stops:**
* **Profit Target:** \$0.46 (+100%)
* **Stop Loss:** \$0.12 (\~48%)
* **Exit Rule:** Thursday EOD if neither stop nor target hit
**⚡ Key Risks:**
* High gamma & accelerating theta → short-duration trade
* Resistance cluster near \$169 → potential collapse if fails
* Thin options, bid-ask spreads → use limit orders, expect slippage
* Tail risk: negative headlines or market sell-offs
**💎 Trade Strategy:**
* Single-leg naked call
* Lower premium (\$0.23) for higher R/R
* Optional alternative: \$167.50 call @ \$0.41 for slightly higher delta and cost
**📊 JSON Snapshot:**
```json
{
"instrument": "PLTR",
"direction": "call",
"strike": 170.0,
"expiry": "2025-09-12",
"confidence": 0.70,
"profit_target": 0.46,
"stop_loss": 0.12,
"size": 1,
"entry_price": 0.23,
"entry_timing": "open",
"signal_publish_time": "2025-09-11 02:07:06 UTC-04:00"
}
```
💥 **TL;DR:** PLTR bullish weekly call. Buy \$170 at open, stop \$0.12, target \$0.46, exit Thursday EOD. Small size, high-gamma scalp — limited risk, strong momentum potential!
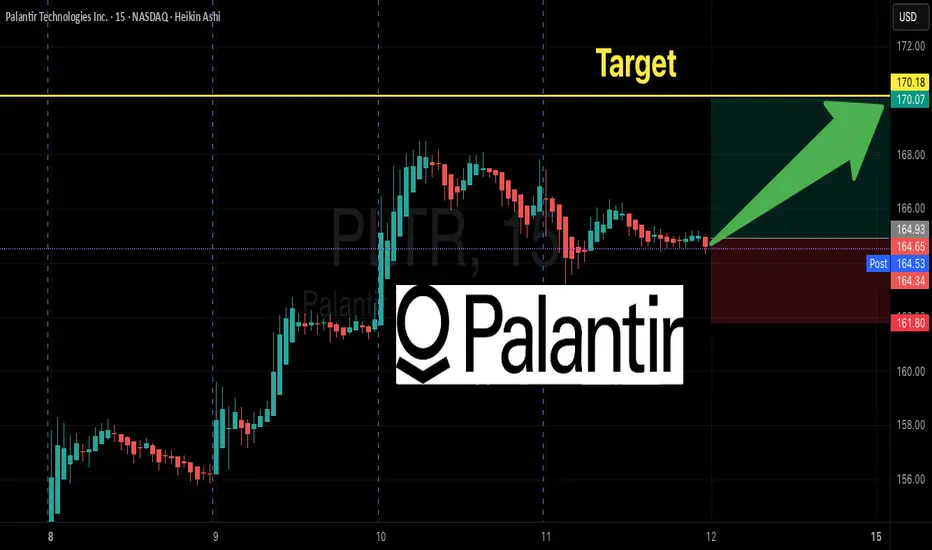
PLTR: Is a New Uptrend Beginning Above 165?PLTR: Is a New Uptrend Beginning Above 165?
PLTR is currently trading above the 165 Resistance level.
We need to observe if it closes above this resistance for a confirmed breakout.
A sustained close above 165 could signal the start of a new uptrend with a target of 185.
The immediate support to watch for any pullback is at 158.
Disclaimer:
The information provided in this chart is for educational and informational purposes only and should not be considered as investment advice. Trading and investing involve substantial risk and are not suitable for every investor. You should carefully consider your financial situation and consult with a financial advisor before making any investment decisions. The creator of this chart does not guarantee any specific outcome or profit and is not responsible for any losses incurred as a result of using this information. Past performance is not indicative of future results. Use this information at your own risk. This chart has been created for my own improvement in Trading and Investment Analysis. Please do your own analysis before any investments.

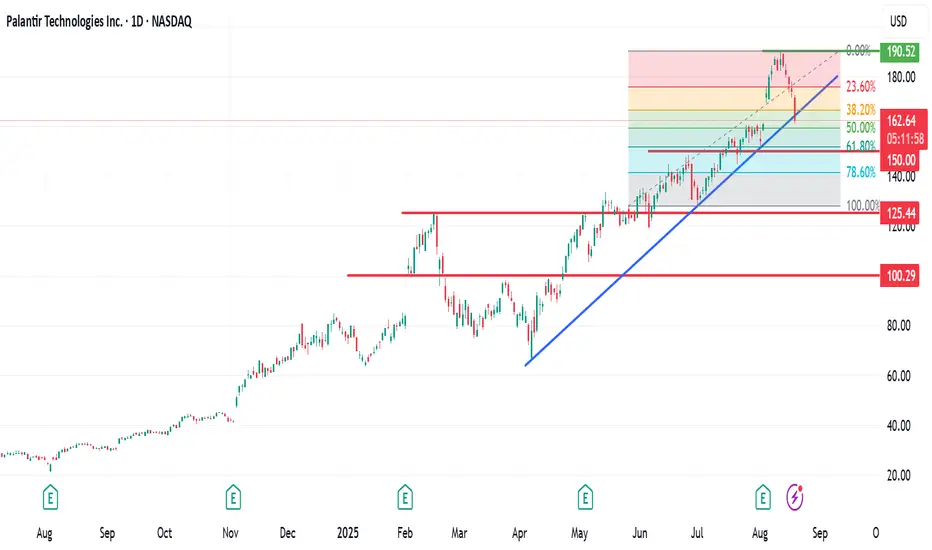
Palantir: Cooling Off After a Strong Bull Run & ATHPalantir: Cooling Off After a Strong Bull Run & ATH.
Palantir has recently taken a breather following an impressive upward rally. The stock surged from the $66 level on April 7th this year to reach a new all-time high of $190.
As expected, no asset moves parabolically upward forever without a retracement.
Over the past week, Palantir has been experiencing a pullback, with today’s session showing a decline of over 6%. The stock is currently trading around $161.
From a technical perspective, I am eyeing two potential entry zones — $160 and $150. Both levels align closely with the Fibonacci 50% and 61.8% retracement areas, making them significant points of interest for a possible rebound.
As always, I take a medium- to long-term approach to my trades, as patience is often the key to capturing real value in strong stocks.
If you found this analysis helpful, please like, comment, share, and connect with me. Let’s continue building a strong TradingView community together.
PLTR 1D Time frameCurrent Price & Market Metrics
Current Price: $162.36 USD
Previous Close: $156.10 USD
Day Range: Not available
52-Week Range: Not available
Market Cap: Not available
P/E Ratio: Not available
EPS: Not available
🔎 Technical Indicators
Relative Strength Index (RSI): 41.18 — Neutral
Moving Averages:
5-day: $155.47 — Buy
10-day: $156.69 — Sell
20-day: $164.09 — Sell
50-day: $156.92 — Sell
100-day: $140.04 — Buy
200-day: $111.35 — Buy
Moving Average Convergence Divergence (MACD): -1.74 — Sell
Commodity Channel Index (CCI): -47.49 — Neutral
Price Rate of Change (ROC): -10.30 — Sell
Trend Strength Indicator (ADX): 24.55 — Neutral
📈 Support & Resistance Levels
Support: $152.80 – $154.27
Resistance: $164.77
📅 Outlook
Bullish Scenario: A breakout above $164.77 could signal a move toward higher levels.
Bearish Scenario: A drop below $152.80 may lead to further downside.
Overall Bias: Neutral, with mixed signals from momentum indicators and moving averages.

PLTR 1D Time frame📊 Palantir (PLTR) Daily Snapshot
Current Price: $162.36
Change: +4.01% from the previous close
Intraday Range: $156.37 – $162.75
Volume: 59,300,483 shares traded
🔎 Key Levels
Resistance:
R1: $162.75 (recent high)
R2: $165.00 (psychological level)
R3: $170.00 (next resistance zone)
Support:
S1: $156.37 (recent low)
S2: $150.00 (psychological support)
S3: $145.00 (next support zone)
📈 Technical Indicators
RSI (14): 67.41 — Neutral to slightly bullish
MACD: 1.51 — Positive momentum
Moving Averages:
5-day SMA: $157.25 — Buy signal
50-day SMA: $145.00 — Buy signal
200-day SMA: $130.00 — Buy signal
Stochastic Oscillator: 77.32 — Overbought
ADX (14): 44.32 — Strong trend strength
📌 Market Sentiment
Catalysts: Positive momentum following recent gains and analyst upgrades.
Sector Performance: AI and data analytics sectors showing strength, with Palantir leading gains among peers.
📅 Outlook
Bullish Scenario: A breakout above $162.75 could lead to a push toward $170.00.
Bearish Scenario: A drop below $156.37 may test support around $150.00.
Overall Bias: Moderately bullish, with positive momentum but facing near-term resistance.

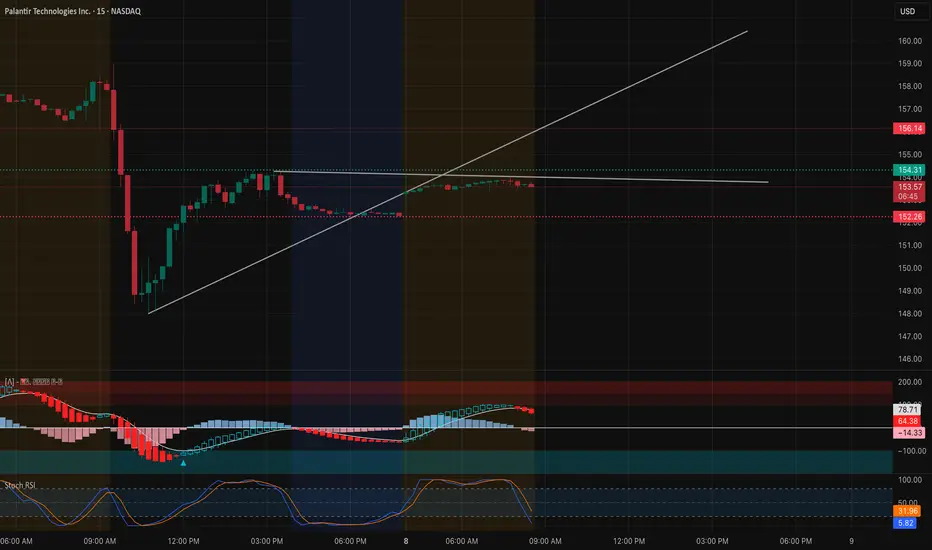
PLTR Market Preview for Monday, September 8Price Action & Market Structure
* PLTR is trading around 153.6, down nearly -2% after a sharp pullback from the 160 rejection zone.
* Price is consolidating sideways after defending the 152 support area.
* Trendline from earlier lows still holding, but momentum remains weak in the short term.
Key Levels
* Resistance (Upside Caps):
* 154.3–156.1 → Near-term rejection zone.
* 160.0 → Major Gamma resistance + Call Wall.
* 162.5–167.5 → Upper resistance cluster with stacked Call Walls.
* Support (Downside Floors):
* 152.3 → Key intraday support.
* 150.0 → HVL + strong Put Support.
* 145.0 → 140.0 → Secondary Put Walls (deeper cushion).
Options Sentiment (GEX & IV)
* GEX: Leaning mildly bullish, but with strong resistance near 160 Gamma Wall.
* IVR: 14.2, slightly elevated, meaning options are pricing moderate volatility.
* Gamma Walls:
* 160 = Heavy Call resistance cap.
* 150 = Strong Put support anchor.
Indicators
* MACD (15m): Bearish crossover active, momentum fading.
* Stoch RSI: Oversold and attempting to turn upward → possible bounce setup if 152 holds.
Scenarios for Today
Bullish Case (if 152 holds):
* Bounce from 152–153 support, push through 154.3–156.1.
* Next upside targets: 160 test, then extension to 162.5–167.5 if squeeze develops.
Bearish Case (if 152 breaks):
* Breakdown below 152 brings price to 150 support.
* If 150 fails, extension to 145.0–140.0 Put Walls.
Trading Thoughts
* Longs: Favor entries near 152–153 support, targeting 156 → 160.
* Shorts: Fade rejections at 156–160, stops above 161.
* Stops:
* Longs → below 150.0.
* Shorts → above 161.0.
Summary
PLTR is in a neutral-to-bearish short-term setup, holding just above 152 key support. If bulls can defend this zone, upside retest toward 156–160 Gamma Wall is possible. A failure under 152 shifts bias bearish, exposing 150–145 downside. Options flow shows capped upside at 160, but solid downside protection at 150.
⚠️ This analysis is for educational purposes only, not financial advice. Manage risk carefully.
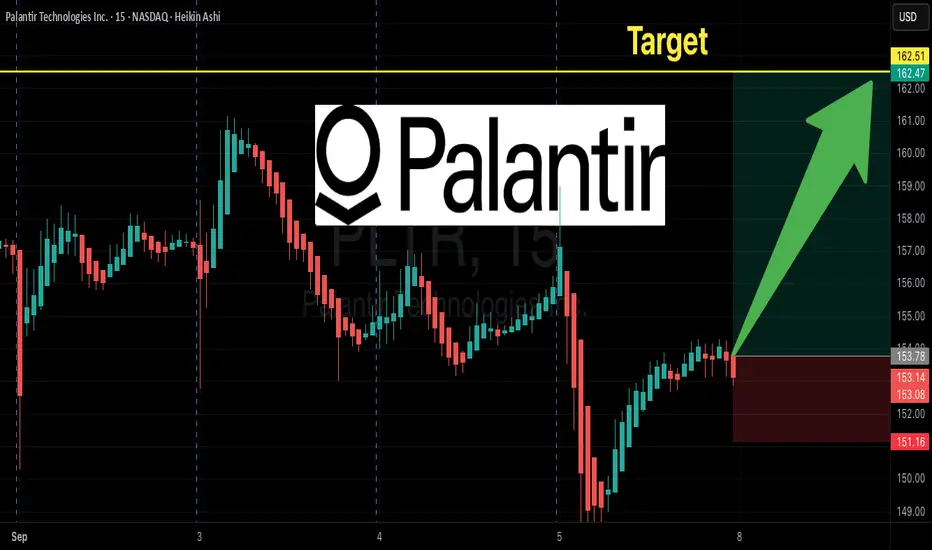
PLTR HIGH PROBABILITY SETUP SOON!!!🚨 PALANTIR HIGH PROBABILITY BUY SETUP 🚨
* Here We Can See Clearly The Next Potential Move For PLTR Coming Hours/Days.
* Keep Your Eyes Close On Your Trading Positions.
* Happy PIP Hunting Traders.
FXKILLA.
PLTR $162.5C — Smart Money Loading, Can Price Catch Up?"
# 🔥 PLTR Weekly Trade Setup (2025-09-07)
**Bias:** 📉 Neutral-to-Slight Bearish (price action)
**But...** 📊 Options Flow = Strongly Bullish (C/P 1.66)
**Conviction:** ⭐⭐ (50% speculative)
---
### 📊 Key Takeaways
* ❌ **Momentum:** Daily RSI 36.3 falling → bearish pressure
* ❌ **Volume:** 0.8× avg → no institutional confirmation
* ✅ **Options Flow:** Strongly bullish (C/P 1.66) → divergence vs price
* ✅ **Volatility:** Low (VIX \~15.2) → cheap calls, low gamma risk
* ⚖️ **Consensus:** Most models = *no trade*, but speculative call flow play is possible
---
### 🎯 Trade Plan (Speculative Flow Play)
* **Instrument:** \ NASDAQ:PLTR
* **Direction:** CALL (naked)
* **Strike:** \$162.50
* **Expiry:** 2025-09-12 (weekly)
* **Entry Price:** \$0.96 (ask)
* **Profit Target:** \$1.60
* **Stop Loss:** \$0.48
* **Size:** 1 contract (small, strictly sized)
* **Entry Timing:** Open
---
### 🧠 Rationale
* Options traders buying aggressively → possible **short-squeeze / bounce**.
* Weak volume + bearish RSI = technical headwind.
* This is a **tactical, high-risk punt**, not a conviction swing.
---
### ⚠️ Key Risks
* 📉 Downtrend may dominate → option decays fast.
* ⏳ 5 DTE = heavy theta decay midweek.
* 💸 Spread/slippage risk at open.
* 📰 Macro/news can flip flow instantly.
---
## 📌 TRADE DETAILS (JSON)
```json
{
"instrument": "PLTR",
"direction": "call",
"strike": 162.5,
"expiry": "2025-09-12",
"confidence": 0.50,
"profit_target": 1.60,
"stop_loss": 0.48,
"size": 1,
"entry_price": 0.96,
"entry_timing": "open",
"signal_publish_time": "2025-09-07 06:53:26 EDT"
}
```
---
🔥 **Summary:**
This is a **flow vs. trend battle.**
Price says bearish 📉, options traders say bullish 📈.
Take the \$162.5C as a **small-size speculative punt** → defined risk, fast exit.
PLTR Monthly with TrenVantageQuick look at PLTR monthly chart with TrenVantage LITE plotted. Showing the levels and status box showing the trends. Manually added some key levels for support in case of a big retrace
