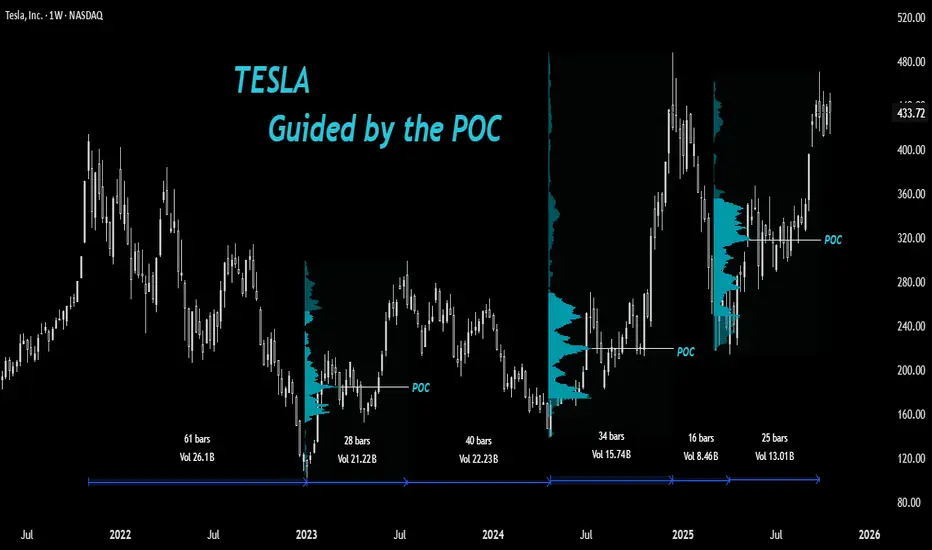
Tesla: Guided by the Point of Control🔎Understanding How Stocks React at Key Volume Profile Levels
In this post, let’s study how a stock can react around important Volume Profile levels and how we, as traders, can take advantage of this behavior.
🔘 A Quick Look at Volume Profile
The Volume Profile shows how much trading took place at each price level. Think of it like a sideways histogram that highlights where buyers and sellers were most active. It helps identify price zones that the market accepted (heavy trading) and those it rejected (light trading).
In between a Volume Profile is the Point of Control (POC) - the price level where the highest trading volume occurred. This is often considered as the market’s fair value zone, where buyers and sellers found the most agreement.
The POC tends to act like a magnet for price. When price moves too far away from it, it often returns to test that level since it represents strong trading interest. That’s why traders use POC zones to mark key supports, resistances, and potential entry areas.
In short:
The Volume Profile shows where trading happened. The POC shows where it mattered the most.
🔘 Overview: TSLA’s Story
After printing a high of $414 in 2021, Tesla (TSLA) has been trying to decisively break that level for almost four years. It made two attempts - first in December 2024, which was quickly faded, and again in September 2025.
🔘 The Fall and Bottom Formation
The stock went through a major bearish phase from $414 down to $101 in 2022 - a massive 75% drop. Then came a sharp V-shaped rally from the bottom - a 194% rise over about 28 weeks, retracing roughly 60% of the entire fall in a short span.
🔘 Why It’s Hard to Catch the Bottom
Catching a stock at the exact bottom is one of the hardest things in trading. No one really knows when the real bottom is forming.
At that point, fear is high, sentiment is negative, and the trend still looks weak. Most traders wait for confirmation - but by then, the bottom is already behind.
Catching the exact low becomes more like a luck than skill. No doubt 'smart traders' focus on catching the early reversal and not the perfect bottom, there are others who wait for pullback opportunities to a fair price.
🔘 April 2024 Bottom Formation
After rallying sharply, TSLA began to pull back from around $300 in July 2023. Traders who had missed the earlier move were waiting patiently with their limit orders for a healthy correction.
But the question was - where should those limit orders be placed?
◽️At the breakout zone around $218?
◽️Near the 50% or 61.8% Fibonacci retracement?
◽️Or below the April 2023 low near $152 for a possible liquidity grab?
The truth is - nobody actually knows the exact level because nothing works all the time.
However, the POC can often help identify a probable fair value zone where accumulation tends to happen.
Although we can’t pinpoint the exact level where a pullback will end, the area 'around' the POC often serves as one of the most reliable zones to accumulate a bullish stock.
And that’s exactly what happened in April 2024. The stock dipped below the previous rally’s POC, grabbed liquidity under $152, and then reversed sharply.
🔘 The Sharp Rally to New Highs
After that, TSLA entered a strong bullish phase, rallying from the April 2024 low to new highs above $414 in December 2024 - a massive 252% rise.
If you observe the Range Tool on the chart, you’ll notice a pattern - bearish phases take longer, while bullish rallies happen faster.
A question here arises: Was this rally sustainable above previous highs?
🔘 The Quick Fall
In January 2025, the stock saw a sharp fall from $488, wiping out 78% of the previous rally.
Interestingly, this decline didn’t stop at a typical breakout retest level - instead, it halted exactly at the POC of the prior bullish rally and began consolidating there.
Since then, the stock has climbed back near its previous highs.
But note this - the January 2025 fall lasted only 16 weeks, while the recovery has taken over 25 weeks without new highs, suggesting a slight loss of upside momentum compared to earlier rallies (early 2023 and late 2024)
🔘 What to Watch Next
If TSLA pulls back again in the future, we can draw a new Volume Profile over the latest bullish leg to locate its POC (I have drawn till the current high of the rally)
That level could once again serve as a potential fair value area and possibly repeat the same price behavior we’ve seen before.
What is your thought on point of control as a tool for investment purpose?
Share your views and hit the boost for more educational posts in future.
📣Disclaimer:
Everything shared here is meant for education and general awareness only. It’s not financial advice, nor a recommendation to buy, sell, or hold any asset. Do your own research, manage your risk, and make sure you understand what you’re getting into.
Your money, your responsibility; and if you’re unsure, ask a qualified financial professional. (Or at least run it by your pet - they’re great listeners 🐶).
Trade ideas
Tesla’s profit growth is slowing, but macro tailwinds supportTESLA (TSLA): Profit growth is shrinking, but macro tailwinds still support the stock.
Fundamental Analysis
1. TESLA, Inc. leveled-off due to a mix factors. The decline came after a disappointing Q3 earnings report on Oct 22 that revealed tighter margins and slowing profits despite record quarterly revenue. However, sentiment began to stabilize late in the week as investors anticipated a Federal Reserve rate cut and progress in US–China trade talks.
2. Tesla’s Q3-2025 was a margin-compression story that capped price gains, despite record revenue of 28.1bln USD (+12% YoY), lower ASPs from global price cuts and a ~50% surge in R&D/AI infrastructure spend (Dojo, robotics) squeezed profitability.
3. An AI-led tech rally continued to provide support, and broader U.S. market strength limited Tesla’s downside as major indexes notched record highs ahead of an expected 25 bps Fed cut on Wednesday (Oct 29). Optimism around the Oct 31 Trump–Xi summit in South Korea also helped steady cyclicals and autos into week’s end.
Technical Analysis
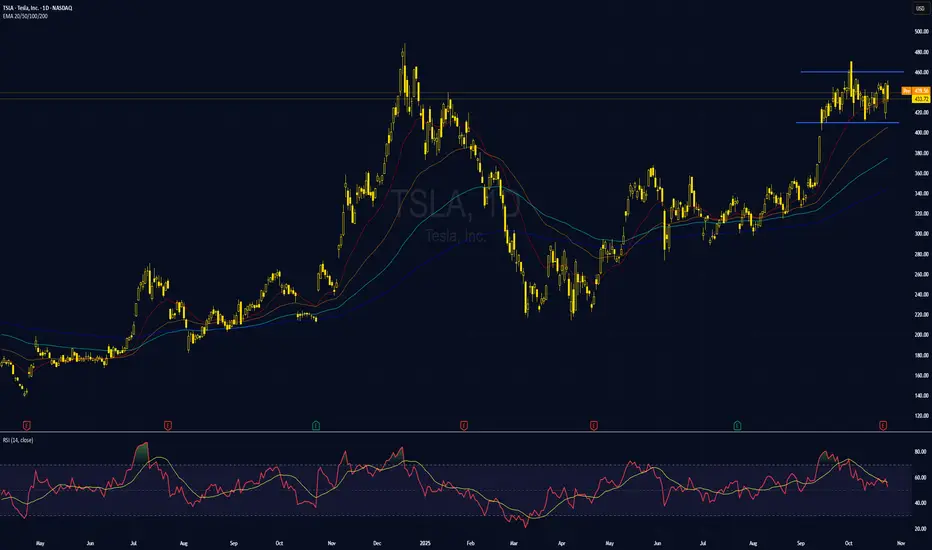
4. TSLA has moved sideways for more than a month after rallying out of the previous range. The bullish EMA stack still signals a broader uptrend, suggesting potential continuation once the consolidation phase ends.
5. TSLA may trade between 410–460 until a directional breakout in either direction.
6. However, a drop below the EMA200 would signal a bearish reversal toward the prior sideways zone near the 300 support area.
Analysis by: Krisada Yoonaisil, Financial Markets Strategist at Exness
Tesla Approaching Key Resistance: Bullish Breakout Likely Current Price: $433.72
Direction: LONG
Targets:
- T1 = $465.00
- T2 = $485.00
Stop Levels:
- S1 = $420.00
- S2 = $410.00
**Wisdom of Professional Traders:**
This analysis is driven by insights from thousands of seasoned traders and financial analysts who are closely monitoring Tesla’s price movements and technical setups. The collective evaluation highlights that Tesla is at a pivotal point, with its current price showing strong indications of a potential breakout above existing key resistance levels. Professionals often emphasize the importance of aligning macroeconomic factors, company fundamentals, and technical trends when forecasting Tesla’s trajectory. By synthesizing these views, this post offers a high-probability trade opportunity.
**Key Insights:**
Tesla continues to benefit from its dominance in the EV space, with technological advancements such as improved battery efficiency and enhanced self-driving capabilities giving it a competitive edge. The company’s Q3 2025 performance demonstrated resilience, with deliveries recovering year-over-year amidst concerns about economic slowdowns. Tesla’s diversification into energy storage and grid solutions is increasingly recognized as a meaningful driver of growth beyond its automotive division, contributing to broader revenue streams.
Technically, Tesla’s stock has been coiling near its $430-$440 resistance band for the past few weeks, showing signs of bullish consolidation. Volume has been building, while Relative Strength Index (RSI) suggests upward movement is in play without entering overbought territory. Breakouts from such critical resistance zones typically result in strong follow-through price movements, with potential gains toward the $465 and $485 regions.
**Recent Performance:**
Tesla has seen a steady recovery in the past quarter, regaining momentum after a slight dip earlier in the year. The stock showed resilience despite industry-wide concerns surrounding EV demand and global economic pressures. Over the last two months, Tesla’s stock has appreciated by over 12%, recovering from $390 levels to its current price point. Strong institutional buy-side interest and reduced short interest have supported its upward trajectory, indicating confidence in future growth prospects.
**Expert Analysis:**
Technical analysis reveals a bullish setup, with Tesla’s short-term moving averages (10-day and 20-day) trading above its longer-term averages, including the 50-day and 200-day moving averages. This "golden cross" signals bullish sentiment may guide the stock higher as positive trading activity picks up momentum. Traders also observe tightening Bollinger Bands, which may act as a precursor to volatility expansion in the upward direction.
Additionally, macro outlooks for Tesla remain positive as the global push for electric vehicle adoption continues to gain traction. Experts believe Tesla’s ability to maintain high margins despite pricing pressure is a critical long-term advantage. The financial guidance for Q4 2025 indicates consistent revenue growth, further supporting the bullish sentiment for the stock.
**News Impact:**
Notably, Tesla’s recent announcement of a major partnership to deploy its battery technology for utility-scale energy storage systems has generated significant excitement in the market. Analysts view this as a game-changer that could carve out an additional revenue stream for Tesla, diversifying its earnings base. Additionally, regulatory incentives across Europe and Asia to accelerate EV adoption are expected to favor Tesla’s market penetration efforts, bolstering its stock performance in the near term.
**Trading Recommendation:**
The current technical setup, robust fundamental tailwinds, and optimistic growth outlook signal a strong buying opportunity for Tesla. A clear breach of the $440 resistance level could pave the way for a bullish breakout, targeting $465 in the near term with the potential for further gains toward $485. Risk management is crucial, so traders should consider setting their stop levels at $420 and $410, respectively, to protect against downside risk. Tesla’s diversified growth strategy and recent positive news position it as a solid long trade with upside potential in the coming months.
Do you want to save hours every week? Register for the free weekly update in your language!

TSLA: Watching Prior Resistance Turn into Key SupportIntroduction & Thesis
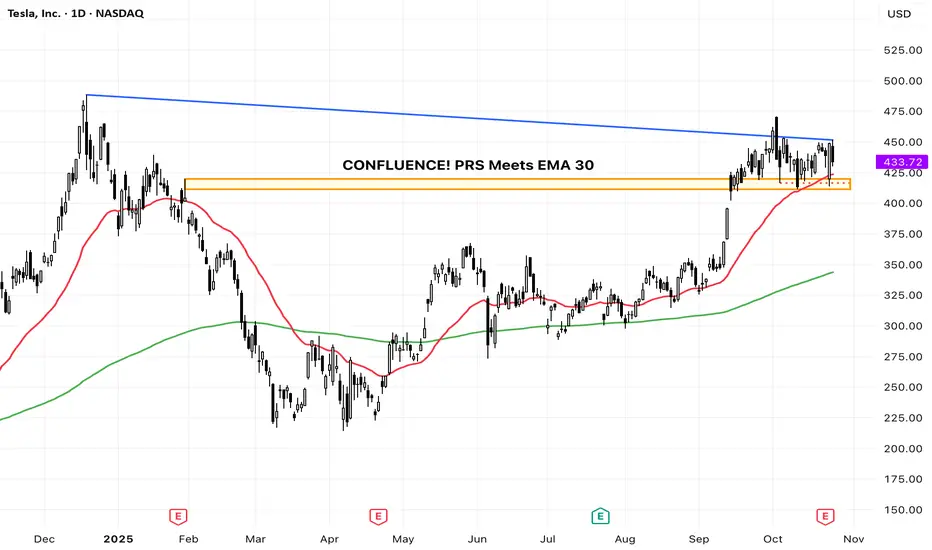
Tesla ( NASDAQ:TSLA ) is currently presenting a textbook technical setup on the daily chart. After a strong uptrend from May to October, the price has pulled back to a critical zone that previously acted as heavy resistance in early 2025. This analysis explains why this level is a crucial 'make-or-break' point for the bulls.
The Breakout and The Retest
Observe the orange rectangle (approx. $410 - $425). This region was a significant ceiling for the price action earlier this year. According to technical theory, once a strong resistance level is decisively broken (which occurred in September), it is expected to flip its role and become a crucial support level. This is often referred to as a Prior Resistance Turned Support (PRS) area.
The price is currently pulling back right into this PRS zone, a common and healthy movement known as a retest.
Confluence of Support
Crucially, the 30-day Exponential Moving Average (EMA 30), which defines the short-term trend, is also converging with this key support zone. This creates a powerful confluence of support, significantly increasing the probability of a bounce. The long-term trend, indicated by the upward-sloping 200-day EMA (green line), remains firmly bullish, supporting the overall upward bias.
Scenarios
🎯 Bullish Scenario (The Bounce)
If the $410 - $425 zone holds and we see a strong bullish rejection candle (e.g., a hammer or engulfing pattern), it would confirm the support flip, suggesting the next leg of the rally towards the recent highs around $475.
🛑 Bearish Scenario / Invalidation (The Failure)
Conversely, a sustained daily close below $410 would be a crucial failure signal. This would invalidate the bullish retest thesis and suggest a deeper correction is underway, likely targeting the next major support zone around the 200-day EMA (currently near the $343 region).
📚 Educational Takeaway
This setup perfectly illustrates how traders look for confluence. The strongest support zones are those where multiple technical factors—like a former resistance level (PRS) and a strong moving average (EMA 30)—converge. A successful bounce here reinforces the power of market structure principles.
(Disclaimer: This is for educational purposes only and not financial advice.)
Tesla at major support. I'm long.Tesla is at major yearly support. Confluence between levels and fib. This is where we need to hold to maintain the trend on the monthly chart. I don't know if it will hang out at this level or possibly go below the level before we regain and higher. But this is a valid long trade at these levels. If we don't hold here it is much lower. Long term target is $670. Remember the fud around Tesla is meaningless. It's all the charts. If the markets were "rational" we wouldn't even be at these levels in the first place.

The New Trading Era: From Machine Intelligence to Human EdgeThe Oracle That Doesn’t Think but Mirrors
Everyone’s talking about the “rise of artificial intelligence” in trading, algorithms replacing traders, neural networks predicting the next move, machines that seem to think.
But the most extraordinary thing about machine intelligence isn’t its brilliance. It’s its astonishing ability to mirror, to absorb vast amounts of past data and recreate patterns it has already seen. A gigantic echo chamber of past realities.
In other words, what we call “intelligence” in these systems is not understanding, it’s reproduction. They don’t reason; they recognize. They don’t imagine; they approximate.
And yet, that ability to reflect a million past environments can feel almost magical, especially when it responds with coherence that seems human.
But here’s the quiet paradox: one the industry rarely talks about: What we’re witnessing isn’t a new form of intelligence; it’s a new kind of mirror, one that reveals how little we truly understand about our own decision-making.
When Machines Need to Learn the Market Every Day
For most of us, our first real encounter with AI came through models like ChatGPT, tools that belong to a specific subgroup of machine learning known as Large Language Models (LLMs), designed to simulate human-like conversation. That’s where our perception of AI as “brilliant and almost magical” was born. LLMs seem capable of answering anything, from trivial questions to complex reasoning.
Their power, however, doesn’t come from understanding the world. It comes from an extraordinary ability to predict language, a task that, despite its apparent complexity, is remarkably stable and mathematically manageable. The rest is simply scale: access to a massive database of accumulated knowledge, allowing the model not only to predict the next word but also to recreate an entire response by recognizing and recombining patterns it has already seen a million times before.
To understand this better, think of your phone’s autocomplete as a miniature version of ChatGPT, it guesses your next word based on your previous conversations. In such a stable environment, consistency is easy. That’s why language models achieve such high accuracy: their elevated “win rate” comes from playing a game where the rules rarely change.
They may look brilliant, but it’s better to say they’re simply hard-working machines in a stable world.
Trading, however, exists on the opposite side of the spectrum. It lives in a non-stationary world, one where the rules constantly evolve. Today’s conditions will be different tomorrow. Or in five minutes. Or in five seconds. No one knows when or how the shift will happen.
Here lies the crucial difference: a model that “understands” English doesn’t need to relearn grammar every week. A model that trades must relearn market reality every day.
Machine learning thrives on repetition. Markets thrive on surprise.
The Real Disruption: Human Understanding + Machine Power
By truly understanding the capabilities and limitations of machine learning in trading or more broadly, artificial intelligence, we realize that the future isn’t about removing humans from the equation. It lies in understanding how machine power compounds in the right hands.
The next era of trading won’t be about replacing human judgment but amplifying it.
Human contextual reasoning, our ability to interpret uncertainty, adapt, and make sense of nuance, can be combined with the machine’s immense capacity for data processing and execution.
Machines bring speed, scale, and memory. Humans bring intuition, flexibility, and judgment.
The synergy happens when both play their part: the trader designs the logic; the machine executes it flawlessly.
Machines cannot think, but they can learn, replicate, and act at a scale humans simply can’t compete with. When contextual thinking meets computational power, that’s not artificial intelligence, that’s real intelligence.
The trader who treats AI as a tool builds an edge. The one who treats it as an oracle builds a trap.
A Simple Manual for Thinking Right About AI in Trading
Never delegate understanding.
Let the machine calculate, but you must know why it acts. You can outsource the coding of a model, but never the architecture of your trading logic. The logic, the “why,” must remain human.
The basics still apply.
Machine learning doesn’t replace the foundations of trading, it only amplifies them. Risk management, diversification, position sizing, and discipline remain non-negotiable. A model can process data faster than you ever could, but it can’t understand exposure, capital allocation, or your personal tolerance for risk. Those are still your job.
Stay probabilistic.
The use of ML in trading doesn’t erase the hardest lesson of all: predicting prices is a false premise. The right question isn’t “Where will the market go?” but “How should I respond to what it does?” Now imagine the power of machine intelligence working within that probabilistic framework: a system designed to maximize your account’s expected value, not to guess Bitcoin’s price next month. That’s where the real explosion of potential lies.
Build systems that can evolve.
The future won’t belong to the trader with the smartest model, but to the one with the most adaptive one. And remember, you must be the most adaptive asset in your system. Markets evolve; your models must too. There’s no such thing as “build once and deploy forever.” In trading, anything that stops learning starts dying.
From the Illusion of Machine Intelligence to the Power of Human-Driven ML
Machine intelligence isn’t a new oracle, it’s a new instrument. In the wrong hands, it’s noise. In the right hands, it’s leverage. It can multiply insight, scale execution, and compound returns, but only when driven by an intelligent trader who understands its limits.
The trader understands, the machine executes. The trader teaches the machine; the latter amplifies the former’s reach.
In the end, it’s never the algorithm that wins, it’s the human who knows how to use it. And when both work together, one thinking, one learning, that’s not artificial intelligence anymore.
That’s compounded intelligence.
TESLA On The Rise! BUY!
My dear followers,
This is my opinion on the TESLA next move:
The asset is approaching an important pivot point 433.50
Bias - Bullish
Safe Stop Loss - 429.07
Technical Indicators: Supper Trend generates a clear long signal while Pivot Point HL is currently determining the overall Bullish trend of the market.
Goal -440.74
About Used Indicators:
For more efficient signals, super-trend is used in combination with other indicators like Pivot Points.
Disclosure: I am part of Trade Nation's Influencer program and receive a monthly fee for using their TradingView charts in my analysis.
———————————
WISH YOU ALL LUCK

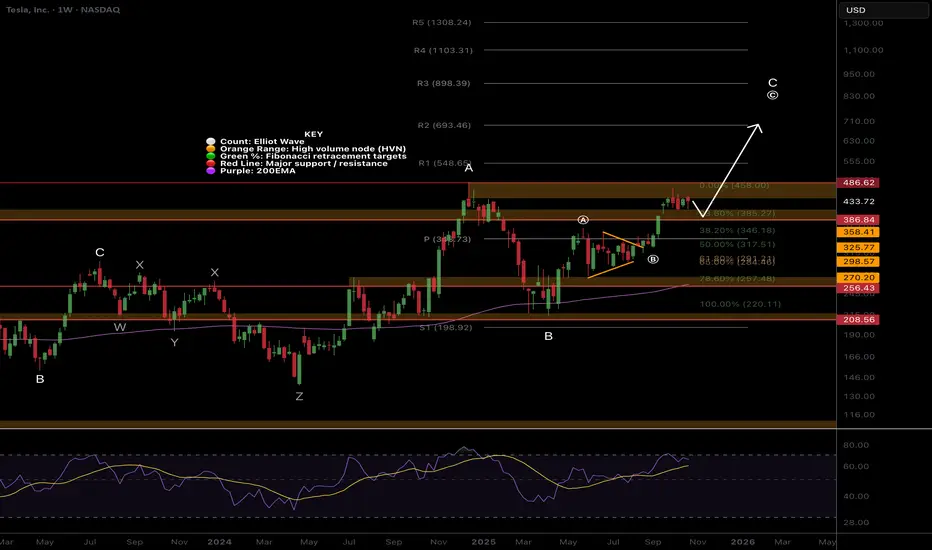
$TSLA higher to go!Price continues towards price discovery finding resistance at the previous all time High Volume Node. Price is above the weekly pivot and 200EMA which is bullish and has momentum.
Wave © of C appears to be underway into price discovery with a target of $693 the R2 weekly pivot. This is because it has been printing a series of 3 wave structures. Wave B printed a triangle which is a pattern found before a terminal move reinforcing the Elliot wave count.
RSI is not yet overbought.
Safe trading
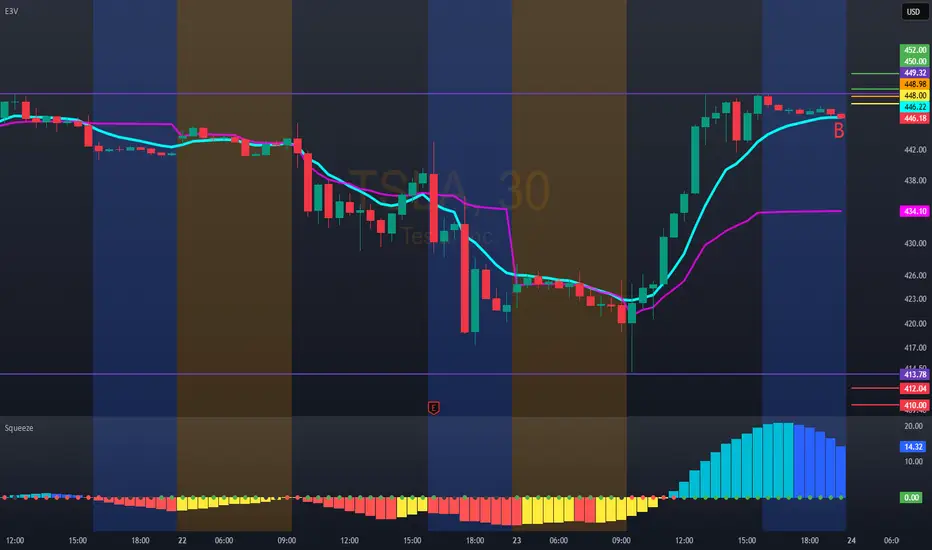
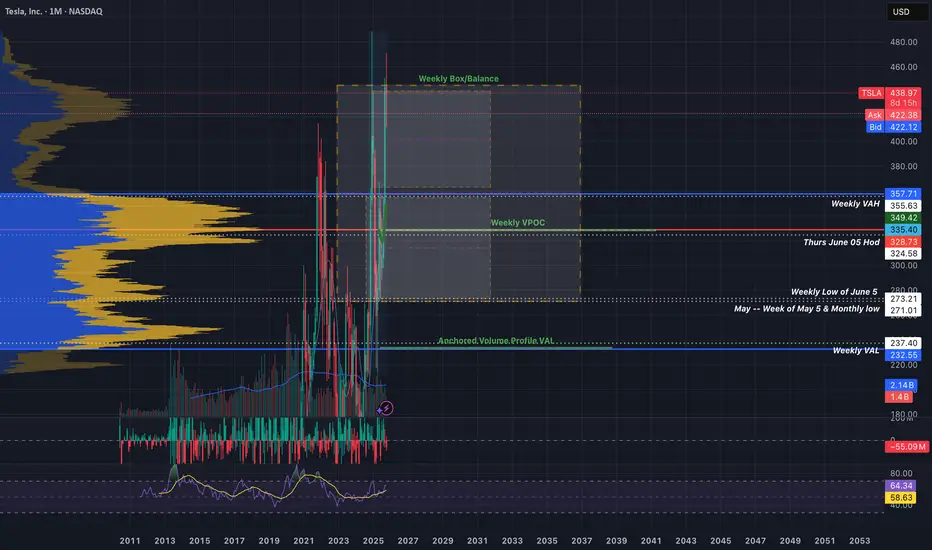
Tesla Macro ChartSharing my Macro Chart.
Use this as a reference for the levels of interest mentioned in my previous tesla post. Added a 30 minute box within the weekly balance box.
I like to personally use this chart to monitor levels intraday on the 30 minute or to plan major shorts or buys.
Some of these levels were drawn a year ago probably but I hope you'll find them useful.
~The Villain

ARE TESLA MARKET BULLS BECOMING WEAK?Tesla Analysis (Weekly Timeframe)
Tesla is currently completing its first cycle wave since inception. The market started printing a primary wave 5, which is an ending diagonal in January 2023. Primary wave 5 comprise of 5 3-wave intermediate waves 1,2,3,4 and price is now printing intermediate wave 5. Intermediate wave 5 started printing in March 2025, minor wave A terminated in May 2025 and minor wave B, a running flat terminated in July 2025. The market is now printing an impulse minor wave C to complete the last 3-wave intermediate wave 5 that will complete primary wave 5 that will complete cycle wave 1. Intermediate wave 5 may be truncated, i.e., it does not necessarily have to touch the medium-term bullish resistance line (upper trendline). From here we will see a major primary wave ABC correction that may begin in Q1 of 2026.
Short entries (1) @ 488.93
Short entries (2) @ 511.04
SL @ 533.15
TP @ 321.47
"The big money is not in the buying or selling - but in the waiting" Charlie Munger
#SabaliCapital
#TechnicalAnalysis

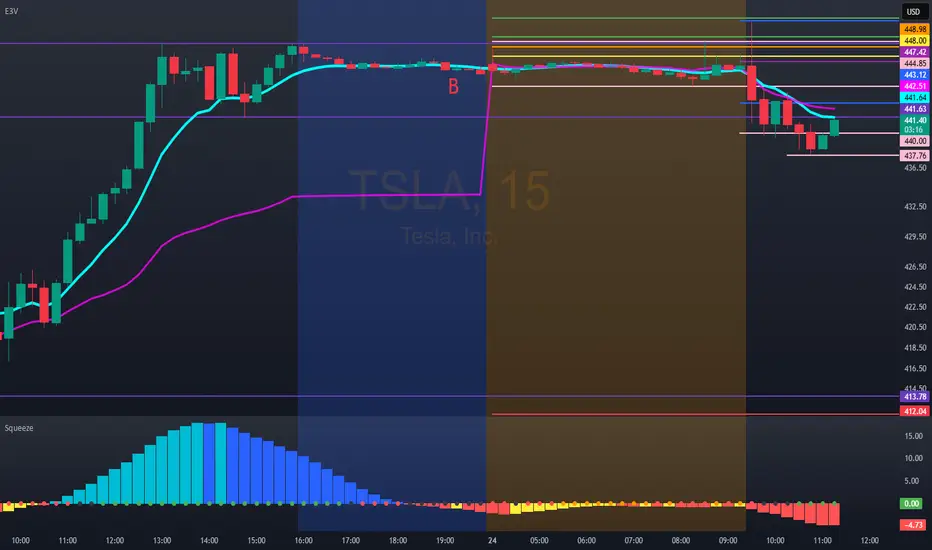
Hello trader, this happened with TSLA TODAY.www.tradingview.com
n the first part, we mentioned the negative economic report. In the second part, I explained that most of the time, the market anticipates a bullish move, expecting a result. The result was negative; the market sets a bullish trap. This was the result, looking at it on a 5M chart.
TESLA — Bad Earnings + Overcrowded Trade = More Downside RiskSummary:
Tesla’s latest earnings disappointed again — weak margins, slower delivery growth, and unclear guidance on new product cycles.
Despite that, retail and institutional positioning remains heavily crowded, with traders still trying to buy every dip.
But when sentiment stays bullish while fundamentals weaken — that’s when distribution begins quietly.
Key points:
EPS miss and declining automotive margins.
Valuation still priced for perfection.
Lower volume reaction on bounces = fading demand.
Market rotation out of megacaps continues as yields stay high.
Technical setup (chart above):
Major rejection at 450–455 USD resistance (post-earnings rally exhaustion).
Potential continuation toward 420 → 397 → 372 USD support zones.
Short zone: 445–450
Target: 372
Stop: 455
Narrative:
The “AI car” story is overcrowded — even good news now fails to spark real follow-through.
If macro stays tight and rates high, Tesla could correct further before finding long-term buyers again.
💬 “When everyone already owns it, there’s no one left to buy.”

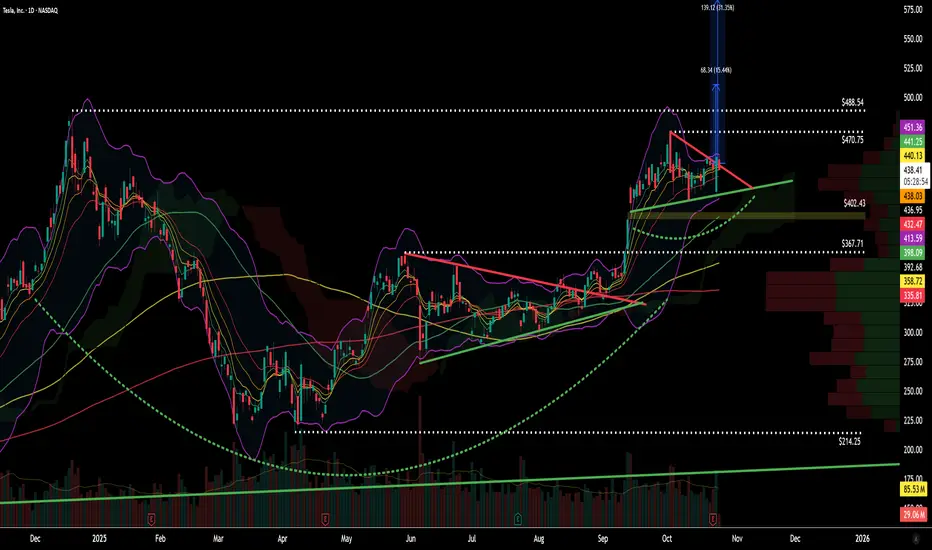
$TSLA – Bull Pennant Sequence & Cup-and-Handle ContinuationThis is a follow-up to my August–October technical outlook on Tesla ( NASDAQ:TSLA ).
After the first bull pennant breakout, price pushed to $470, falling just shy of my initial $480 target, before pausing and forming another bull pennant directly below December’s all-time high near $488.
Structure & Momentum
Momentum remains strong — the daily chart has now completed a cup and handle formation, adding a new layer of continuation confluence to the broader trend structure.
The key takeaway here is that NASDAQ:TSLA continues to respect rising MAs and trendline support, consolidating at high levels rather than breaking down — a bullish sign of controlled digestion after a strong run.
To confirm a full breakout continuation, the chart now needs a decisive move through $488 on high volume. Until that happens, the current pennant acts as both a compression zone and accumulation phase.
Breakout & Targets
If volume expands and NASDAQ:TSLA clears the $488 ATH, the next resistance targets are:
Target 1: $510 → symmetrical triangle 1:1 projection
Target 2: $580 → measured move from flagpole #2 (pennant #1 extension)
Both levels represent high-probability reaction zones where price could pause or retrace before resuming trend.
Support & Risk Management
Below, the chart shows clear structural support at:
$402 → prior breakout base and Ichimoku cloud zone
$367–$370 → trendline & confluence support
As long as price respects these zones, the setup remains valid and constructive.
A close below $370 on strong volume would invalidate the near-term bullish bias.
Technical Summary
✅ Trend: Bullish continuation
✅ Pattern: Cup & Handle + Bull Pennant #2
📊 Key Resistance: $488 (ATH)
🎯 Targets: $510 / $580
⚠️ Support Watch: $402 → $370
🔍 Trigger: Breakout confirmation on strong volume
Final Notes
Tesla continues to show a textbook multi-phase breakout structure — bull pennant, consolidation, and potential measured-move continuation. Until the breakout confirms, patience around $488 remains key. Once volume supports it, the next leg higher could complete the second flagpole move toward the $510–$580 range.
For educational and technical analysis purposes only.
Tesla Stock Wobbles as Profit Dives 37%, Revenue Pops. Now What?Tesla NASDAQ:TSLA posted a 12% jump in revenue on Wednesday, reaching $28.1 billion, well above Wall Street’s $26.37 billion estimate. And yet, the stock slipped nearly 1% on the day before paring back that loss with a 2.3% Thursday gain.
Why? Because profits fell faster than Cybertruck’s reputation — a 37% plunge year over year, with adjusted earnings per share at 50 cents versus the expected 54 cents.
It’s a classic Tesla paradox: sales are booming, but margins are thinning, and Wall Street can’t decide whether to cheer the top line or cry over the bottom one.
🏎️ The Cost of Staying in the Fast Lane
Tesla’s secret sauce has always been scale — crank out more cars, dominate market share, and let profits follow. But this quarter, the recipe’s a bit off. Automotive revenue rose 6% to $21.2 billion, yet net income plunged to $1.37 billion from $2.17 billion a year earlier .
What happened? Price cuts. Lots of them. Musk has been slashing sticker prices across markets to stay ahead in the EV race — great for consumers, painful for margins. Add a 50% spike in operating expenses (thanks, humanoid robots and AI labs), and suddenly that sleek electric machine looks a lot less money-making.
Still, Tesla’s revenue growth means one thing: demand isn’t dead. The EV slowdown hasn’t reached Palo Alto yet.
💰 Bitcoin Bounces
In a crypto-centric subplot, the company made $62 million from its Bitcoin BITSTAMP:BTCUSD stash last quarter.
The crypto’s 5% rise — ending the quarter around $114,000 — gave Tesla’s treasury a nice digital cushion. The company held roughly 11,000 Bitcoins during the three months through September.
🧠 The $1 Trillion Question
And then there’s the other storyline — the Elon Musk Show. Musk wrapped up the earnings call by pivoting from profits to power. Specifically, his proposed $1 trillion pay package , which he insists isn’t “compensation” at all but a question of “control.”
“I just don’t feel comfortable building a robot army here and then being ousted because of some asinine recommendations from ISS and Glass Lewis,” Musk quipped, slamming the proxy firms as “corporate terrorists.”
His plan is to secure roughly mid-20s voting power to keep Tesla’s destiny firmly in his hands while still, as he puts it, being “fireable if I go insane.”
If approved, Musk’s stake could surge from 13% to nearly 29%, giving him the leverage he says he needs to push Tesla toward an $8.5 trillion valuation — complete with robotaxis, humanoid bots, and up to 12 million cars sold annually.
🧾 The Takeaway
The stock is up roughly 16% in 2025, clawing back some early-year losses, but it still lags the Nasdaq Composite NASDAQ:IXIC and other mega-cap peers like Nvidia NASDAQ:NVDA and Meta $META.
The near-term question is simple: can Tesla tighten costs without killing growth? The long-term one is bigger: can Elon Musk lead the company into its next chapter without turning every quarter into a cliffhanger?
That said, the earnings season continues and the next batch of big tech heavyweights is right around the corner.
Off to you : What’s your take on Tesla and Musk’s lofty vision north of $1 trillion? Share your thoughts in the comments!

TSLA – Post-Earnings Breakout Clears Triangle Resistance Toward Tesla (TSLA) delivered a strong post-earnings reversal, breaking out of a multi-week symmetrical triangle pattern that had kept price compressed between $410 and $450. After initially trading lower on earnings, buyers stepped in aggressively, driving the stock from the low $420s all the way to a breakout high of $470.76, reclaiming both trendline and psychological resistance levels.
This move officially confirms a bullish breakout from the consolidation pattern formed since early September. The breakout is supported by strong volume, signaling momentum buyers returning after the earnings washout.
If price holds above $450–$455, Tesla could see continuation toward $480–$490 in the coming sessions. However, a pullback toward $440–$445 would be healthy and could provide a retest entry if bulls maintain control.
Support & Resistance Levels:
Support: $445.00 → $435.00 → $420.00
Resistance: $470.00 → $480.00 → $490.00
Bullish Play:
Entry: Above $455 breakout retest
Target: $475 → $485
Stop: Below $440
Options Idea: $480 Call (2–3 weeks out) if price holds above $450

Good morning trader, TSLA for tomorrow: 448.98Economic report
Bullish entry 450.00/452.00
Technical bearish entry 448.00. Let's hope the market follows.
TSLA at a Crossroad: Can Bulls Push Through $450 Wall on Oct 241. Market Structure (1H & 15M)
Tesla’s price structure is showing a clear short-term bullish shift after back-to-back CHoCH confirmations from the $415 zone, where buyers absorbed liquidity aggressively. The Break of Structure (BOS) on the 15-minute around $440–$445 confirms that smart money rotated back into long positions after a liquidity sweep of last week’s lows.
On the 1-hour chart, TSLA is reclaiming momentum above its recent CHoCH zone near $420, building a stair-step structure toward the previous supply zone at $450–$455. The trendline drawn from the previous lower highs (extending from the $470s) still acts as a major trend barrier, meaning a clean break and hold above $450–$452 is the confirmation bulls need to signal a higher timeframe reversal.
Smart money accumulation looks evident between $415–$425, where volume clusters align with the CHoCH reversal. Above that, liquidity resides at $455–$460, a potential magnet if momentum sustains through Friday.
2. Supply and Demand / Order Blocks
* Demand Zone (High Probability Reaccumulation): $415–$425. This zone was defended twice and coincides with prior sell-side liquidity.
* Immediate Support / Fair Value Gap Fill Area: $435–$440, likely to act as intraday springboard if retested during premarket dip.
* Supply Zone / Sell-Side Liquidity: $450–$455. This aligns with the 1-hour bearish order block formed from the Oct. 17–18 breakdown.
Expect a reaction near $450 — either a rejection for intraday pullback or a breakout continuation if bulls trap shorts above it. If price clears that level with strength, next supply sits around $462–$465.
3. Indicator Confluence
* 9 EMA vs 21 EMA: Both EMAs have crossed to the upside on the 15-minute and are starting to fan out on the 1-hour, confirming a short-term bullish bias.
* MACD: The histogram shows strong positive momentum with expanding bars on the 1-hour, but slight divergence on 15-minute as momentum cooled late in the session — suggesting a possible small pullback before continuation.
* RSI: Hovering around 70 on the 1-hour, indicating overbought conditions but still within bullish control. On 15-minute, RSI has cooled off near 60, resetting for potential continuation.
* Volume: Expansion noted during the breakout, confirming participation. Momentum remains positive unless volume fades on retest.
4. GEX (Gamma Exposure) & Options Sentiment
According to the GEX chart, $450–$455 is the 2nd major call wall and highest positive gamma zone, while $420 remains the strongest PUT support for Friday (10/24). The HVL (High Volume Line) around $430 aligns perfectly with the mid-support of the structure.
Dealer positioning remains net positive gamma, meaning we can expect controlled movement unless price breaches outside the $420–$455 zone. A sustained move above $450 would likely force dealers to hedge upward, fueling a gamma squeeze toward $460+. Conversely, if TSLA rejects and falls back below $440, expect volatility expansion downward toward the $420 PUT wall.
Current IVR (6.1) and IVx (≈60) show low implied volatility, hinting that options are relatively cheap — favorable for directional plays. Call flow sits around 64%, reinforcing bullish sentiment for tomorrow’s session.
5. Trade Scenarios for Friday, Oct. 24
Bullish Setup 🟩
* Entry Zone: $443–$445 retest or reclaim above $450
* Target Levels: $455 → $462 → $470 (if squeeze triggers)
* Stop-Loss: Below $438 (invalidate short-term structure)
* Confirmation: Hold above 9EMA on 15-min with MACD histogram remaining green and RSI > 60
Bearish Setup 🟥
* Entry Zone: $450–$455 rejection zone
* Target Levels: $440 → $430 → $420
* Stop-Loss: Above $457 (invalidate bearish rejection)
* Confirmation: MACD red crossover + RSI divergence + 15-min CHoCH to downside
6. Closing Outlook for Oct. 24 (Friday)
Tomorrow’s session could be decisive. If bulls defend $440–$445 early and reclaim $450 with conviction, it opens the door to a Friday gamma squeeze into $460+. But if momentum fades and $440 gives way, expect a controlled retrace back into the $425–$430 demand.
Personally, I’m watching $450 as the battleground — it’s both a psychological level and a technical liquidity point tied to heavy options flow. Any strong break with volume could trigger dealer hedging upward. But failure to sustain above it might lead to a Friday fade, especially into the afternoon session when gamma neutralizes.
📈 Final Thought:
“TSLA is coiled between $440–$450 — and tomorrow, one side will get trapped. If bulls hold the floor, expect fireworks into $460+. If not, $425 retest is back on deck.”

Tesla Wave Analysis – 23 October 2025- Tesla reversed from support area
- Likely to rise to resistance level 467.30
Tesla recently reversed from the support area located between the key support level 415.60 (which has been reversing the price from the middle of September) and the lower daily Bollinger Band.
This support area was further strengthened by the 38.2% Fibonacci correction of the upward impulse from August.
Given the strong daily uptrend, Tesla can be expected to rise to the next strong resistance level 467.30 (top of the previous impulse wave i).

Tesla - The massive triangle breakout!🪩Tesla ( NASDAQ:TSLA ) is breaking out:
🔎Analysis summary:
Last month, we witnessed an incredible but expected rally of about +35% on Tesla. Furthermore, with this move Tesla is attempting to break above the previous all time highs. After bullish confirmation, this would also lead to a massive triangle breakout.
📝Levels to watch:
$400
SwingTraderPhil
SwingTrading.Simplified. | Investing.Simplified. | #LONGTERMVISION

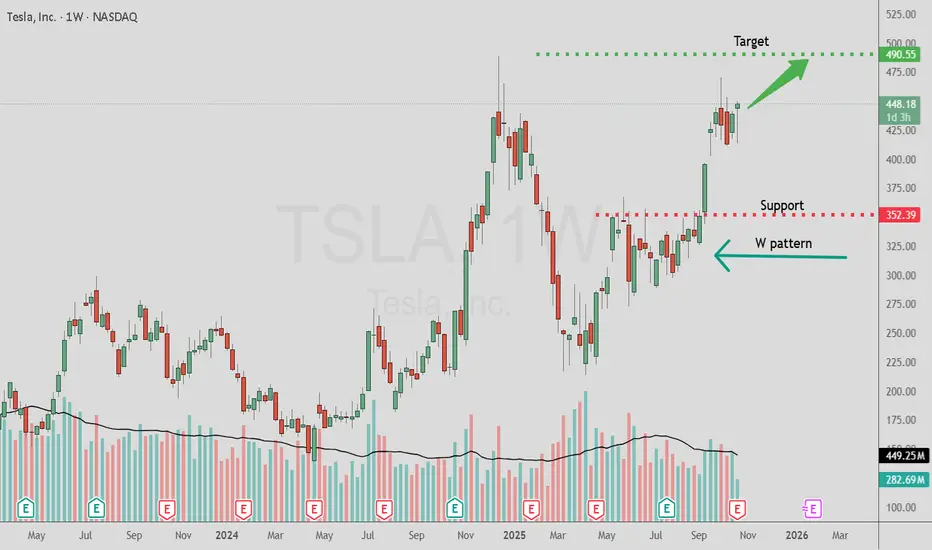
Tesla Has A W Pattern On The WeeklyGood day Tesla fans!
Thought I would publish a post on Tesla due to it's hype and trader fans.
Weekly and monthly have a " W " pattern and with that I measure a move to 490.55 area.
Not saying it will reach but it has the potential based on the pattern despite the negative earnings report.
Caution is advised as even if this area gets reached a sell off could occur afterwards.
Best of luck in all your trades $$$
Tsla - Box is Box?I have what seems like a thousand tesla charts now...and they are all telling me tesla needs to have a seat soon.
Tesla has been consolidating on the daily timeframe for quite a while now.
What happens if we continue to see presistent failures at the top of box or a look above and fail on the weekly? I'd put my money on a return to value.
At some point, tesla should revert back to the mean and I will be there waiting to LEAP at the opportunity(get it?).
I would love tesla around the weekly volume point of control around $245 area (this may shift as the days go by). If tesla retests the weekly value area high around $314 and is rejected then we may take a trip down to VPOC town.
Granted, for any of this to happen, we would need technicals to cooperate, meaning a LAAF of box and failure to hold the midpoint($384ish), as well as a turn in sentiment.
This could happen this fall or next march, who knows, but I'll be there when it does.
~The Villain
Global Market Insights1. Introduction
The global market represents the vast, interconnected system through which goods, services, capital, and information flow across international borders. It encompasses multiple sectors—finance, manufacturing, technology, energy, commodities, and consumer markets—all interwoven through trade, investment, and policy networks. Global markets serve as the backbone of the modern economy, reflecting shifts in geopolitical influence, technological innovation, and consumer behavior. Understanding global market insights requires an in-depth view of these interconnections, examining how trends in one region or industry can ripple throughout the entire world economy.
The 21st century has witnessed dramatic globalization driven by digital transformation, liberalization of trade, and the rise of emerging economies. Yet, the landscape remains volatile due to political tensions, climate challenges, pandemics, and rapid technological disruption. Thus, global market insights today involve balancing opportunity with risk, short-term speculation with long-term sustainability.
2. The Structure of the Global Market
The global market is not a single unified entity but a network of interdependent systems. Its structure is defined by several core components:
a. Financial Markets
These include global exchanges for stocks, bonds, currencies, and derivatives. The major financial centers—New York, London, Tokyo, Hong Kong, and Singapore—drive liquidity and capital allocation worldwide. Financial markets influence investment decisions, currency valuations, and risk sentiment, often serving as early indicators of economic health.
b. Commodity Markets
These markets handle the trading of raw materials such as oil, gold, agricultural goods, and metals. Commodity prices are vital indicators of global supply-demand balance and economic activity. For instance, oil price fluctuations impact energy costs, inflation, and geopolitical stability.
c. Trade Networks
International trade forms the lifeblood of the global economy. Institutions such as the World Trade Organization (WTO) and regional trade agreements (e.g., USMCA, EU Single Market, ASEAN) shape cross-border exchange rules. Global supply chains connect producers and consumers across continents, emphasizing efficiency but also exposing vulnerabilities during crises.
d. Labor and Human Capital
A globally mobile workforce enables talent optimization, outsourcing, and competitive labor markets. Countries like India, the Philippines, and Vietnam have emerged as service and manufacturing hubs due to skilled labor and cost advantages.
e. Technological Ecosystems
Digital platforms, AI, and automation redefine how markets function. Technology companies now dominate global capitalization rankings, with firms such as Apple, Microsoft, and Tencent leading innovation-driven growth.
3. Key Drivers of Global Market Dynamics
Several forces collectively shape the global market environment. Understanding these drivers provides insight into long-term investment and policy trends.
a. Globalization and Trade Liberalization
Trade liberalization has historically propelled global economic growth by reducing tariffs and barriers. However, recent trends of protectionism and “friend-shoring” (relocating supply chains to allied nations) have created new trade dynamics. Countries are balancing globalization benefits with domestic economic security.
b. Technological Innovation
Artificial intelligence, blockchain, green energy, and biotechnology are revolutionizing productivity and business models. Fintech innovations democratize finance, while automation enhances manufacturing efficiency but also disrupts traditional labor markets.
c. Monetary Policy and Interest Rates
Central banks, particularly the U.S. Federal Reserve, European Central Bank, and Bank of Japan, influence global liquidity through interest rate policies. Low-rate environments stimulate investment, while tightening cycles tend to slow growth and shift capital flows.
d. Geopolitical Tensions
Conflicts, trade wars, and sanctions significantly affect global stability. For instance, U.S.-China rivalry shapes global technology access, supply chains, and foreign investment patterns. Similarly, regional conflicts like those in Eastern Europe and the Middle East disrupt energy supplies and commodity prices.
e. Environmental and Climate Considerations
Climate change has emerged as both a risk and an opportunity for global markets. Green energy investments, carbon pricing, and sustainable finance are transforming industries. Companies increasingly adopt ESG (Environmental, Social, Governance) frameworks to align profitability with sustainability.
4. Regional Market Insights
a. North America
The United States remains the world’s largest economy, driven by innovation, consumer spending, and strong financial markets. Canada complements this with robust energy and resource exports. North American markets are characterized by technological dominance, resilient consumption, and deep capital markets, though debt levels and political polarization pose risks.
b. Europe
Europe’s markets are defined by regulatory strength and industrial diversity. The European Union (EU) remains a global trade powerhouse, but it faces challenges such as slow growth, aging populations, and energy dependency. The post-Brexit landscape continues to redefine trade and financial dynamics.
c. Asia-Pacific
Asia is the epicenter of global growth. China’s transition from manufacturing to consumption-driven growth, India’s digital and service-led expansion, and Southeast Asia’s emerging consumer economies drive demand and innovation. Japan and South Korea continue to lead in technology and advanced manufacturing.
d. Latin America
Rich in natural resources, Latin America’s growth is often tied to commodity cycles. Political instability and inflation challenges persist, yet nations like Brazil, Chile, and Mexico are modernizing their industries and integrating more deeply into global value chains.
e. Africa and the Middle East
Africa’s markets offer high growth potential due to demographics and natural resources. However, infrastructure deficits and governance issues limit progress. The Middle East remains energy-centric, but nations like Saudi Arabia and the UAE are diversifying into tourism, technology, and renewable energy.
5. Global Market Trends and Transformations
a. Digitalization and E-Commerce
E-commerce, digital payments, and data-driven marketing have reshaped consumer behavior. Platforms such as Amazon, Alibaba, and Shopify integrate technology with logistics, enabling borderless retail markets.
b. Shift to Green Economies
Sustainable finance and renewable energy investments are accelerating. Electric vehicles, solar energy, and carbon credit markets exemplify the shift from fossil fuels toward decarbonized economies.
c. Rise of Emerging Markets
Emerging economies contribute over 60% of global GDP growth. Rapid urbanization, expanding middle classes, and technological adoption make these regions central to future global demand.
d. Supply Chain Realignment
COVID-19 exposed vulnerabilities in global supply chains. Companies now diversify sourcing through “China+1” strategies, reshoring, or nearshoring to enhance resilience.
e. Financial Digitalization
The global financial system is undergoing a technological revolution—cryptocurrencies, central bank digital currencies (CBDCs), and decentralized finance (DeFi) redefine how value is exchanged and stored.
6. Challenges in the Global Market
a. Economic Inequality
Globalization has lifted millions out of poverty but also widened income gaps. Developed nations face stagnating wages, while emerging markets grapple with uneven wealth distribution.
b. Inflation and Debt Pressures
Post-pandemic stimulus and geopolitical disruptions have driven inflationary pressures. High public and private debt levels threaten fiscal stability in several economies.
c. Geopolitical Fragmentation
Rising nationalism, trade barriers, and regional conflicts threaten global cooperation. The move toward multipolarity—where power is distributed across multiple regions—complicates policy coordination.
d. Technological Disruption
While innovation fuels growth, it also causes displacement. Automation, AI, and robotics could replace millions of jobs, demanding urgent skill development and policy adaptation.
e. Environmental Risks
Climate change, resource depletion, and extreme weather events increasingly disrupt markets. Sustainable investment and risk mitigation are becoming essential components of global economic strategy.
7. Opportunities in the Global Market
a. Green and Renewable Technologies
Investing in renewable energy, electric vehicles, and sustainable infrastructure offers massive long-term potential. Global climate policies encourage public-private collaboration in this sector.
b. Digital Transformation
AI, IoT (Internet of Things), 5G, and cloud computing provide opportunities for companies to enhance efficiency and innovation. Digitalization also opens new frontiers in fintech, healthcare, and education.
c. Emerging Market Expansion
Asia, Africa, and Latin America present enormous consumer and investment opportunities. Infrastructure development, mobile banking, and digital entrepreneurship are rapidly scaling.
d. Healthcare and Biotechnology
The pandemic accelerated innovation in healthcare, telemedicine, and biotechnology. Aging populations and increased health awareness drive continued global demand.
e. Financial Inclusion and Fintech
Fintech startups are democratizing access to financial services. Mobile payments, digital lending, and blockchain solutions bridge the gap for unbanked populations.
8. The Role of Policy and Global Institutions
Global markets depend on policy coordination and institutional support. Organizations such as the IMF (International Monetary Fund), World Bank, WTO, and OECD provide frameworks for trade, investment, and development. Meanwhile, regional alliances—like the EU, ASEAN, and BRICS—enhance collective bargaining power.
Monetary policies from leading central banks influence global liquidity. Regulatory bodies now emphasize transparency, cybersecurity, and ESG standards to safeguard global market stability. Effective governance remains essential to mitigate systemic risks and foster inclusive growth.
9. The Future Outlook
The future of global markets will be defined by adaptation—economic, technological, and environmental. We are entering a multipolar world, where economic influence is shared among the U.S., China, the EU, and emerging economies. Technology will continue to integrate markets, but digital sovereignty and cybersecurity will emerge as major battlegrounds.
Artificial intelligence and automation will revolutionize industries, while green transitions redefine energy and transportation systems. However, sustained global growth depends on balancing profit with sustainability, and innovation with inclusivity.
Global markets are likely to remain volatile in the short term due to inflation cycles, geopolitical uncertainty, and climate challenges. Yet, long-term prospects remain positive, driven by human ingenuity, digital innovation, and cross-border collaboration.
10. Conclusion
Global market insights reveal a dynamic, interconnected, and ever-evolving system that mirrors humanity’s economic ambitions and collective challenges. The interplay of technology, policy, and capital continues to transform industries and societies. While globalization has delivered prosperity and innovation, it also presents new risks—economic inequality, environmental degradation, and political fragmentation.
The key to thriving in the global market lies in adaptability, diversification, and sustainable strategy. Businesses, investors, and governments must embrace change, leverage digital transformation, and commit to ethical and resilient growth models. In this intricate web of interdependence, understanding global market insights is not just an academic pursuit—it is a strategic necessity for the future of global prosperity.
Quantitative and Algorithmic Trading in the Global MarketIntroduction
In the ever-evolving world of financial markets, quantitative and algorithmic trading have emerged as the twin engines powering modern investment and trading strategies. They represent the fusion of finance, mathematics, statistics, and computer science to create data-driven, rule-based systems capable of executing trades with precision and speed beyond human capability. Over the past three decades, these methods have transformed global trading dynamics — reshaping liquidity, price discovery, and even the structure of exchanges. Quantitative and algorithmic trading now dominate trading volumes in equities, forex, commodities, and derivatives markets worldwide.
This essay explores the concepts, strategies, technologies, advantages, and risks associated with quantitative and algorithmic trading, as well as their impact on global financial markets.
Understanding Quantitative and Algorithmic Trading
Quantitative trading refers to the use of mathematical and statistical models to identify trading opportunities. It relies heavily on quantitative analysis, which involves collecting large sets of historical and real-time market data, identifying patterns, and forecasting potential price movements. Quantitative traders, often called “quants,” use sophisticated models to test hypotheses and develop systematic strategies for profit generation.
Algorithmic trading (Algo trading), on the other hand, is the practical implementation of these quantitative models through computer algorithms that automatically execute trades. It involves predefined instructions that specify when, how, and how much to trade, based on parameters such as timing, price, volume, and market conditions.
In simple terms, quantitative trading focuses on the “why” — the logic and mathematical framework — while algorithmic trading handles the “how” — the automation and execution of the strategy.
Historical Evolution
The roots of quantitative trading can be traced back to the 1970s when computers were first used for portfolio optimization and risk management. Pioneers like Edward Thorp, the author of Beat the Market, applied probability theory to stock trading and option pricing, laying the foundation for quant finance.
The 1980s and 1990s witnessed the rise of electronic trading platforms, which enabled automated order matching. Firms like Renaissance Technologies and D.E. Shaw built statistical arbitrage models that consistently delivered high returns using advanced mathematics.
By the 2000s, algorithmic trading became mainstream, aided by technological progress, faster data transmission, and regulatory changes such as the U.S. SEC’s approval of electronic communication networks (ECNs). High-Frequency Trading (HFT) — the fastest form of algorithmic trading — emerged, executing thousands of orders in milliseconds. Today, more than 70% of equity trades in developed markets like the U.S. and Europe are executed algorithmically.
Core Components of Quantitative and Algorithmic Trading
Data Acquisition and Management
Data is the lifeblood of quantitative trading. Traders collect massive datasets — historical prices, order book information, news sentiment, economic indicators, and alternative data such as satellite images or social media trends. This data is cleaned, normalized, and stored for analysis using advanced databases and cloud computing systems.
Model Development and Backtesting
Quant models are developed using statistical and machine learning techniques to forecast price movements or detect inefficiencies. Backtesting evaluates these models on historical data to verify performance and robustness before deployment in live markets.
Execution Algorithms
Algorithms are designed to execute trades efficiently while minimizing market impact and transaction costs. Common execution algorithms include Volume Weighted Average Price (VWAP), Time Weighted Average Price (TWAP), and Percentage of Volume (POV).
Risk Management Systems
Every quantitative model includes strict risk controls — such as stop-loss mechanisms, position limits, and exposure checks — to protect against unforeseen market events and model failures.
Infrastructure and Technology
Cutting-edge hardware, low-latency networks, and co-location services (placing trading servers near exchange data centers) are essential for high-frequency and algorithmic trading. Millisecond delays can mean the difference between profit and loss.
Types of Quantitative and Algorithmic Strategies
Statistical Arbitrage
This involves exploiting short-term price inefficiencies between related securities. For instance, pairs trading identifies two correlated assets — when their price relationship diverges, one is bought and the other is sold short, expecting reversion to the mean.
Trend-Following Models
These algorithms capitalize on persistent market trends using indicators like moving averages or momentum oscillators. When the price breaks above a defined resistance, a buy signal is triggered.
Mean Reversion Strategies
Based on the idea that prices tend to revert to their long-term average, these models look for overbought or oversold conditions.
Market Making Algorithms
Market makers continuously quote buy and sell prices, earning the bid-ask spread while providing liquidity. Algorithms dynamically adjust quotes based on volatility and order flow.
High-Frequency Trading (HFT)
HFT strategies execute thousands of trades per second to exploit micro-inefficiencies. Techniques include latency arbitrage and order anticipation.
Machine Learning-Based Strategies
Modern quants increasingly use artificial intelligence and deep learning models to analyze nonlinear patterns in large datasets, from news sentiment to macroeconomic variables.
Event-Driven Trading
Algorithms react to real-time events such as earnings announcements, mergers, or geopolitical developments. For example, a positive earnings surprise may trigger a buy signal.
Index Arbitrage and ETF Strategies
These exploit price differences between index futures, exchange-traded funds, and their underlying constituents.
Quantitative and Algorithmic Trading in Major Global Markets
United States
The U.S. is the global hub of algorithmic trading, accounting for the majority of automated volume. Major exchanges like NASDAQ and NYSE provide low-latency access, and firms such as Citadel Securities, Renaissance Technologies, and Jane Street dominate market making and quant strategies.
Europe
European markets, regulated under MiFID II, emphasize transparency and fairness in algorithmic trading. London remains a major center for hedge funds and algorithmic firms.
Asia-Pacific
Algorithmic trading is rapidly expanding in markets like Japan, Singapore, Hong Kong, and India. In India, the National Stock Exchange (NSE) supports co-location and direct market access, making it one of the fastest-growing algorithmic ecosystems.
Emerging Markets
Countries such as Brazil, South Africa, and the Middle East are adopting algorithmic platforms, although liquidity and infrastructure remain developmental challenges.
Benefits of Quantitative and Algorithmic Trading
Speed and Efficiency
Algorithms execute orders within microseconds, allowing traders to capture fleeting market opportunities impossible for humans to detect manually.
Reduced Human Bias
Trading decisions are based on predefined logic rather than emotion, minimizing psychological biases such as fear and greed.
Lower Transaction Costs
Smart order routing and optimal execution algorithms reduce slippage and market impact, enhancing profitability.
Liquidity Enhancement
Market-making algorithms continuously provide buy and sell orders, improving liquidity and narrowing bid-ask spreads.
Scalability
A single algorithm can manage thousands of securities across global markets simultaneously, offering unmatched scalability.
Backtesting and Optimization
Quantitative systems can be tested extensively on historical data, refining strategies before real-world application.
Risks and Challenges
Despite their advantages, quantitative and algorithmic trading come with significant risks:
Model Risk
Models are based on assumptions that may fail under changing market conditions. A small coding error or mis-specified model can cause massive losses.
Overfitting and Data Snooping
Over-optimization of models on historical data can produce unrealistic results that fail in live trading.
Liquidity and Flash Crashes
Excessive algorithmic activity can amplify volatility. The 2010 U.S. “Flash Crash” highlighted how algorithmic feedback loops could trigger rapid market collapses.
Regulatory Risk
Regulators globally are tightening oversight of algorithmic trading to prevent manipulation and ensure fairness. Compliance costs and monitoring requirements are rising.
Technology Failures
System outages, latency issues, or cyberattacks can disrupt trading and cause severe financial losses.
Competition and Market Saturation
As more participants adopt similar strategies, profit margins shrink, and edge becomes increasingly difficult to maintain.
Regulatory Framework and Global Standards
Regulators worldwide are implementing rules to govern algorithmic and high-frequency trading.
In the United States, the SEC and CFTC monitor automated trading for fairness, requiring disclosure of algorithms and pre-trade risk checks.
In Europe, MiFID II mandates firms to test algorithms, maintain kill-switch mechanisms, and provide detailed audit trails.
In India, SEBI regulates algorithmic trading by requiring pre-approval, audit certification, and real-time risk management systems.
These measures aim to balance innovation with market integrity and investor protection.
Technological Advancements Driving the Future
The next phase of quantitative and algorithmic trading will be shaped by technologies such as:
Artificial Intelligence and Deep Learning – Algorithms that learn autonomously from new data, improving accuracy over time.
Natural Language Processing (NLP) – Automated interpretation of news, tweets, and reports to derive trading signals.
Quantum Computing – Offering unprecedented processing power for portfolio optimization and complex simulations.
Blockchain Integration – Enhancing transparency, settlement efficiency, and security in algorithmic transactions.
Cloud Computing and Big Data – Allowing scalable data storage and computation across global markets in real time.
Impact on Global Market Dynamics
Quantitative and algorithmic trading have profoundly reshaped market structure. They have enhanced liquidity, tightened spreads, and accelerated price discovery. However, they also contribute to short-term volatility and market fragmentation across multiple venues.
Institutional investors now compete with sophisticated algorithms, while retail traders benefit indirectly through lower costs and better execution. Exchanges have evolved to accommodate high-speed connectivity, and data analytics has become a core asset for every financial institution. The global market, once driven by intuition and human judgment, is now governed largely by algorithms and machine intelligence.
Conclusion
Quantitative and algorithmic trading represent the pinnacle of financial innovation, combining mathematics, computation, and automation to redefine how markets operate. They have democratized access to efficient trading tools while challenging traditional notions of value, speed, and human decision-making.
Yet, with great power comes great responsibility — ensuring transparency, ethical deployment, and robust regulation will determine the sustainable future of algorithmic trading. As artificial intelligence and data science advance further, quantitative trading will continue to evolve, shaping global markets that are faster, smarter, and more interconnected than ever before.