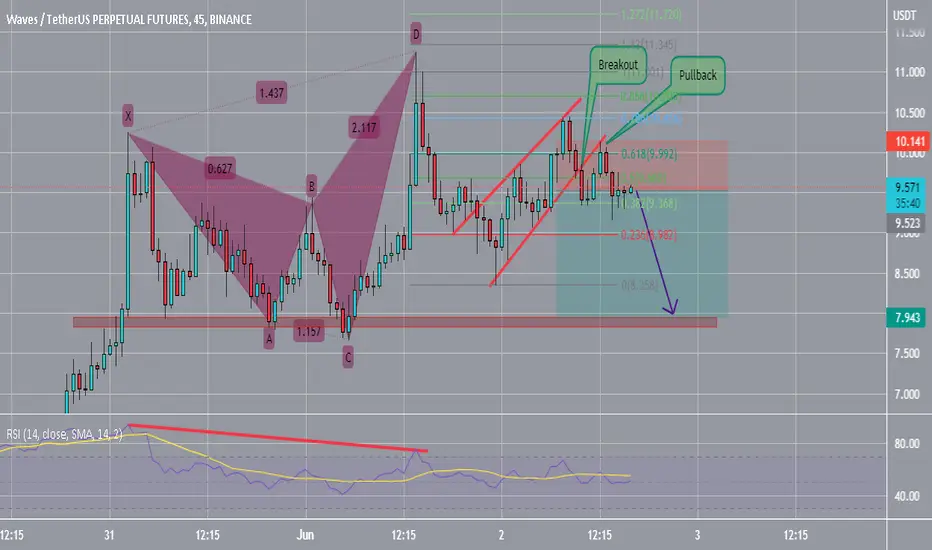
WAVES to 13 or to 6 ?This might be my last update on WAVES
-
I saw something else on the chart, That we are running on SYMMETICAL TRIANGLE
Skip the next paragraph if you know the symmetrical triangle :
-
What is a Symmetrical Triangle Pattern?
The Symmetrical Triangle is usually a continuation pattern. It represents a pause in the existing uptrend after which the original uptrend gets resumes. A breakout from the upper trend line marks the continuation of an uptrend while a breakdown from the lower trend line marks the start of a new bearish trend . This pattern is also known as a wedge chart pattern.
How does Symmetrical Triangle Pattern Work?
Phase 1: Existing Uptrend
When there is an extreme demand in prices there is an uptrend. It continued as the demand increases.
Phase 2: Pause
When demand is equal to supply the there is a pause in an uptrend and investors start to book profits here. As prices consolidate it forms converging trend lines . As there is equal demand and supply investors buy on the lower trend line and sell on the upper trend line . Which results in forming a Symmetrical Triangle Pattern .
Phase 3: Uptrend Continuation
After demand matching the supplies when there is when buyers are again interested to buy demand increases. Which results in breakout! And the continuation of the uptrend.
Role of Volume:
Volume plays a major role in a symmetrical triangle pattern . When in an uptrend the volume is quite higher. In the second phase, the volume starts to diminish due to equal demand and supply. And again on the breakout, the volume surges. Volume with Breakout gives a good indication of a successful uptrend.
-
For me the chance of breaking of the symm. triangle is always 50% - 50%
but this time I am a little bearish and I will link you a related idea to watch.
I always trade it as it goes.
-
Thumb up for more updates on WAVES
Trade ideas

Waves bullish breakoutWaves is breaking out of the flag. Retesting so it can take off. BTC needs to behave.

Wyckoff on WAVES Hello Trades,
Just noticed that we are following Wyckoff distribution schematic on WAVES
-
The distribution schematic has similar phases to the accumulation schematic, but with many of the same events along the way happening in the opposite direction.
Phase A - Arriving with the Markup Phase of the cycle is the Preliminary Supply (PSY), which demonstrates the first opportunity to sell for strong profit is nearing. The Buying Climax (BC) where the Composite Operator and bears first sell-off, creating a new resistance line. Price drops until a new Automatic Reaction (AR) occurs, bouncing the price up again to a Secondary Test (ST).
Phase B - Similar to Phase B of the Accumulation Schematic, in that, this is now where the Composite Operator will sell off its investments and realize profits from the previous schematic phases. Again, bear traps and bull traps may occur between the trading range. An Upthrust (UT) may also occur, briefly surpassing the BC, and setting a new resistance line.
Phase C - Just as with the Accumulation Schematic, this phase may or may not occur. An Upthrust After Distribution (UTAD) could find the market a new high. Whether or not this happens, Phase D eventually takes place.
Phase D - This is the last point for investors to sell at higher prices before the price begins to capitulate. Usually, a Last Point of Supply (LPSY) is found within the trading range, then a buy/sell reaction occurs, and another LPSY is located at or below the support line, triggering Phase E.
Phase E - The downward capitulation begins with a clear drop under the trading range as investors sell off, diminishing demands and tanking the price.
public.bnbstatic.com
-
Take care, compare the picture to the chart.
-
Thumb up for more !

RR=2.56 sell ideabreakout of flag pattern after formation of bearish shark + RSI divergence
PS : never risk more than 2% of your capital per trade
Waves 1 hrWaves 1hr chart bullish count complete.now moves in correction vwaves
Target near to 7$ to 6$

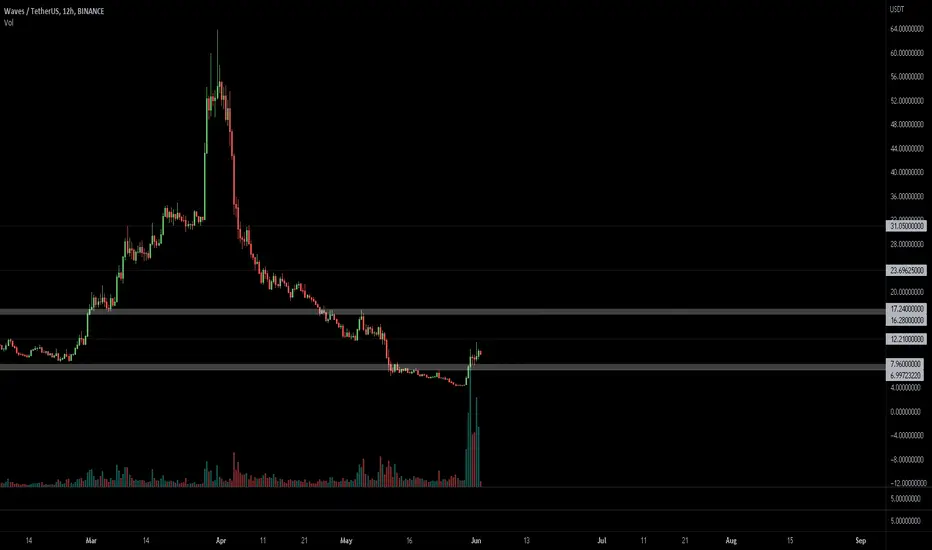
#WAVES, chart over 2022 has been insane #WAVES chart over 2022 has been insane
700% up into a 94% drawdown and now trending up again..
Volume is also at insane levels (ATH in Binance) while UCTS is back on a buy signal on multiple timeframes.
probably not stopping here
$WAVES
Wavesusdt---1: Resistance or support is important before failure occurs
2: Wait for the price to return
3: If you receive confirmation on return
Note: The price may not return to the full level
Good luck
This analysis is just my mental idea
Please analyze before entering
Get approval first

15% run upcoming again ?Hello Traders,
Yesterday Waves tried to hold when BTC was crashing all supports out their.
you can see the head and shoulder pattern on the chart with it's targeting lining exactly with the daily resistance
Wait for a breakout and then enjoy 15% upward now
Target 11.9 mainly
Maybe before a little maybe after ?
-
Hope you enjoy this, leave a thumb up for more

my personal waves idea that got liquidated.like bella, 3 pumps then death. well, we had 3 so far. lets see

WAVES - TWO POTENTIAL SHORT IDEASHOLA yawl
So if we break through this OB, we could see price reject at these two levels above
1 - 4h bearish OB supply
2 - HTF FVG
That is all for now - safe and happy trading errrone!

waves usdtBINANCE:WAVESUSDT
weekly view shows resistance at this levels not sure if it will brek though but as of now is being held back we shuold see if this is broken and start another rally but keep an eye it could get rejected hard good luck

Wave Count Of WavesHello friends. Here we can see that the Waves Ponzi token is forming an ending diagonal. We are planning to short waves at $12.30 with a good size because after reaching this target the price is expected to go to zero.
The reason why the price needs to pop up here is for the big whales to get more shorts. They are very bearish on this platform, so they steal the shorts from people who used too much leverage and get liquidated as the prices move up.
Thanks for playing.

#WAVES/USDT 4Hr UPDATE !!Hello, welcome to this WAVES/USDT 4hr chart update by CRYPTOSANDERS.
I have tried my best to bring the best possible outcome to this chart.
Show some support do hit the like button, follow and comment in the comment section. this motivates me to bring this kind of chart analysis on regular basis.
CHART ANALYSIS :
Look bullish flag pattern in the 4Hour timeframe.
In Case of uper trand line break and retest and the , Expect a +90-100% olmost Bullish Waves.
This is not a piece of financial advice.
Sorry for my English it is not my native language.
Do hit the like button if you like it and share your charts in the comments section.
thank you

waves usdtweekly view shows resistance at this levels not sure if it will brek though but as of now is being held back we shuold see if this is broken and start another rally but keep an eye it could get rejected hard good luck

Bull Falling Wedge ?I guess WAVES are now forming a Falling wedge pattern !
the failure rate for the falling wedge is considerably low. The failure rate for an upwards breakout is only 8% – 11%.
With our volume declining ( which indicate a big move towards up or down side soon )
it can be our last target before a correction ?
Targets :
1- Previous high (10.59)
2- 11.9
3-15.9 (I guess not this time)
Tell me down, Do you think it is a wedge too ?
-Thumb up if you agree

WAVES LONG (Super Bullish)Clear strong falling wedge bull flag
Strong support zone + EMA100 support
Bearish price losing momentum
NFA

WavesThis shows the reason for the rejection at the 10.50 area, I would expect more downside to come.
From my previous idea on lower timeframes now you can see why I had found the divergence important as it was by the weekly level, I usually post ideas a little late as if I see something I will trade it myself first


WAVES Daily_T Analyze>>>>>>>>>>Hello EveryOne
I Have Tried My Best to Bring the best Possible outcome in this Chart.
At now WAVES engaged with 50-D MA resistance.
For now,
((After the short Corrections )) if price success to pass the this resistance area,
We just wait for breaking resistance then ((11.9-12.0 usd)) we can set the TP's for next Resistance's.
Price must not breaks' down from marked green area on the chart (short-term support).
All possibility TP's marked on the chart.
PLZ set SL.
This is not financial advise.
PLZ DYOR.
With hopping success>>>>>>>>>>>>>>

$WAVES Breakout$Waves breakout on above average volume
All Entry Criteria have been met:
1. Price above 10, 20 & 50 EMA --> Check
2. Consolidation Phase in Uptrend --> Check
3. Breakout on above average Volume --> Check

Waves has waved a "Dead Cat Bounce"Happy Wednesday, Dear Swing Traders!
A very interesting price move we are currently experiencing on Waves. In fact, out of TOP 100 this coin has obviously managed to come to the stage of "DCB" (dead cat bounce) as the 1st one! The absolutely critical for DCB are: a small time-frame (one hour here) and a long weakness formation (the rising wedge here). As you can see with the current target highs @12 we are then likely to see the price @3, 2 and even 1 dollar. Enjoy watching DCB which you can bump into on quite a rare basis.
Yours,
ICBF Swinger Dagmar


