Waves Getting Ready for 70%+ bullish Wave Seems Like Getting Ready For Massive Bullish Impulse Formed & breaking Descending Channel in h8 tf Incase Of Successful Breakout Expecting 70 to 75% Bullish Wave
Trade ideas

WAVESUSDT 4h 6/19/2023it is my prediction for WAVESUSDT :
1.3630 : good for enter
1.4498 : good for profit
1.2950 : good for stop loss

WAVES IDEA!BYBIT:WAVESUSDT.P
My waves idea is at its low and we actually broke out of the bottom but quickly wycked up! i cant afford to cover the risk that actually covers that bottom so the question is am i willing to risk the 1% on this and set a limit or should i wait and play it cool and because im mentioning this i will set a limit but keep my risk even tighter maybe 0.5%. I will update this asap!
Thank you!


Retest Potential and RSI EquilibriumWAVES, after breaching below its previous levels, appears to be eyeing a potential retest of the resistance zone within the price range of $1.825 to $1.861. Notably, the current Relative Strength Index (RSI) level is at 49, reflecting a state of equilibrium between buying and selling forces. This suggests a moment of market indecision, where caution is advised. Traders can consider short-selling opportunities in this zone, while exercising prudence and waiting for additional confirmation signals before making any decisive moves.

WAVESUSDT → The price comes out of the wedge. Expect impulseWAVESUSDT makes a retest of the strong support area of 1.500 and breaks the resistance of the descending wedge. This set-up, if positive, could strongly reverse the market.
The price tests the liquidity of the support area and forms a rebound from the 1.500 level. In phase two, the price breaks the wedge resistance and is in a consolidation format.
A local resistance of 1.669 is forming on the junior timeframe. If the bulls can overcome this resistance zone, an impulse may form, which will only push the price after exiting the wedge.
The moving averages act as resistance. The price might soon test the MA-50.
Strong support: the descending boundary of the wedge, level 1.500
Strong resistance: 1.669, 1.800, 2.350
I expect consolidation above the level of 1.500 and breakout of 1.669 with further growth of the price to 2.350, then to 5.000
Sincerely R. Linda!

Short WavesIt demonstrated a bearish divergence by using RSI Indicator, overbought is occurred in 4 hours timeframe!

WAVES : NEW UPTREND T: $3.28 WAVES seems to enter a new uptrend.
We will follow this coin for more confirmations on the below target to see if it's able to gain.
Important target:$3.28

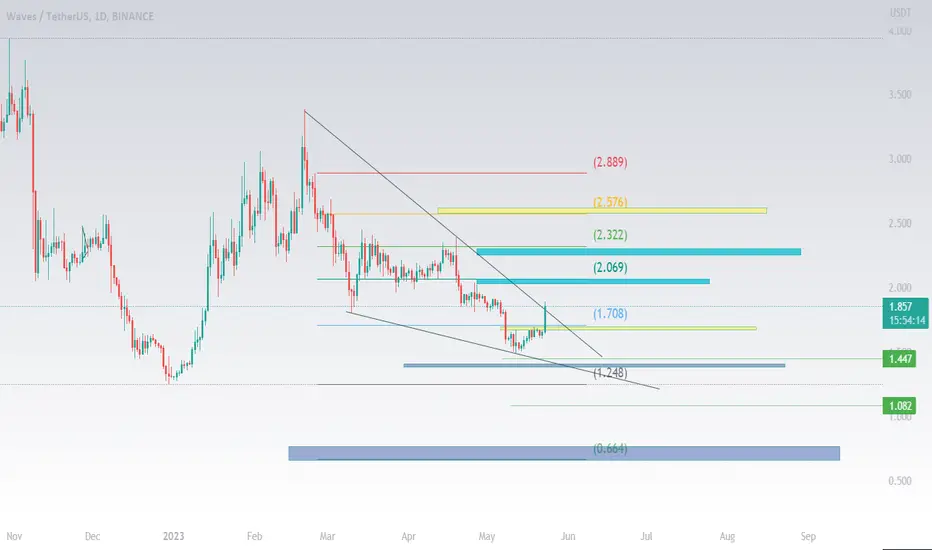
WAVES S&R in correction shape's>>>>Hello EveryOne
I Have Tried My Best to Bring the best Possible outcome in this Chart.
I forgot to publish this chart in here 2 day's ago,
But WAVES at the moement's testing 1.75-1.85 short supply area'sn
In case of more support WAVES can hit to 2.0-2.3USDT at the first rissing leg's.
By passing 2.4 resistance area WAVES correction trend's is over and CoCH happend.
It's just an analyze,
Not a financial advise.
PLZ DYOR
With hopping success>>>>>>>
$WAVESUSDT can show a raising leap BINANCE:WAVESUSDT
Once this pair jump a bit higher than 1.94-2.4 it will have a change to touch 4.6-5.4 range.
Does not constitute a recommendation.
#furoreggs #investing #idea #crypto #forecast

WAVESUSDT breakout of downtrend in 4H time frameWAVES break out of it's downtrend and is testing the resistance. There is some space for growth left when it go through the resistance.

Long iead for WAVESUSDTWe have identified and executed the following trading idea:
Buy signal #WAVE/USDT🚦 (Long)
3x Multiplikator ℹ️ Cross/ Isolated
Market / Limit Order 5%
Buy 1.885 - 1.860
Target 1: 1.903
Target 2: 1.923
Target3: 1.949
Stop: 1.827


WAVES SHORT AND MEDIUM TERM PERSPECTIVE!Hello Traders and everyone, I am Hadi Karaali, Known as SNIPERS_FX
If you like the idea, do not forget to support with a like and follow.
QUICK UPDATE ON WAVES,
Price is still sitting around a massive support zone and still looking for new longs on lower time frame.
And as we can see from H4 time frame price got stuck inside this big range, and price no is trading around the lower bound of this range.
Meanwhile, for the bulls to kick in from a short-term perspective we need a break above the marked swing high, then a movement higher would be expected.
Then as the price will be trading higher we need a break above the upper bound of this range, to confirm that the bulls are now in control from a medium-term perspective.
If you like this kind of analysis don't forget to like and follow
and as usual follow your trading plan and manage your risk.
Be patient and good luck!

WAVESUSDT wants the Pullback?WAVESUSDT has been testing a 4-hour resistance level after experiencing a bounce from the daily support. This indicates that there is some upward momentum in the market, as buyers are stepping in to support the price at key levels.
If the price of WAVESUSDT manages to break through the 4-hour resistance level, there is a possibility that the market could retest the 2.2$ area according to Plancton's Rules. This means that the price may continue to rise and potentially reach the 2.2$ mark, which would be a significant increase from its current level.
–––––
Follow the Shrimp 🦐
Keep in mind.
🟣 Purple structure -> Monthly structure.
🔴 Red structure -> Weekly structure.
🔵 Blue structure -> Daily structure.
🟡 Yellow structure -> 4h structure.
⚫️ Black structure -> <= 1h structure.
Follow the Shrimp 🦐

WavesUSDT“Half of me is filled with bursting words and half of me is painfully shy. I crave solitude yet also crave people. I want to pour life and love into everything yet also nurture my self-care and go gently. I want to live within the rush of primal, intuitive decision, yet also wish to sit and contemplate. This is the messiness of life - that we all carry multitudes, so must sit with the shifts. We are complicated creatures, and ultimately, the balance comes from this understanding. Be water. Flowing, flexible and soft. Subtly powerful and open. Wild and serene. Able to accept all changes, yet still led by the pull of steady tides. It is enough.”


WAVESUSDT looks like a level breakdownHello everyone. I noticed an interesting graph at WAVESUSDT. The thing is that firstly, the coin behaves better than the market and does not fall much when the rest go to correction. We are also standing at the resistance level. In past times, the price barely touched this level or immediately the entire growth was blocked. Now we are pushing the level well and the price does not think to go down. Therefore, this situation is similar to further breaking through the level and going to the goal at 2,4. The stop is small, we put it at 2,162.

Waves can do a bullish movementWaves is in a Falling wedge pattern. This means the price is going to become Bullish Pretty soon. Right now the price is around 2.1$ and no break out has happened yet but it's right around the corner. after the break out happens, the price shall reach the resistance level around 3.5$
_ _ _ _ _ _ _ _ _ _ _ _ _ _ _ _ _ _ _ _ _ _ _ _ _ _ _ _ _ _ _ _ _
🌍Thank you for seeing idea .
Have a nice day and Good luck.

WAVESUSDT 2H HR MTWAVES
The beginning of the second upward wave
Correction to the 0.618 Fibonacci area
The second touch supports the dirty floor
TP
Move up to the 0 Fibonacci area

WAVESUSDT forecastso far the price action is being contained inside the parallel channel, it needs to stay there otherwise it will need a recount.
for me the asset is still in the process of correction and it's possible that we are still missing a wave X and Wave Y.
only if it breaks the channel to the upside will I say it's bullish we can probably see a bigger rally up.

waves is bullishHi, dear traders. how are you ? Today we have a viewpoint to BUY/LONG the WAVES symbol.
For risk management, please don't forget stop loss and capital management
When we reach the first target, save some profit and then change the stop to entry
Comment if you have any questions
Thank You
