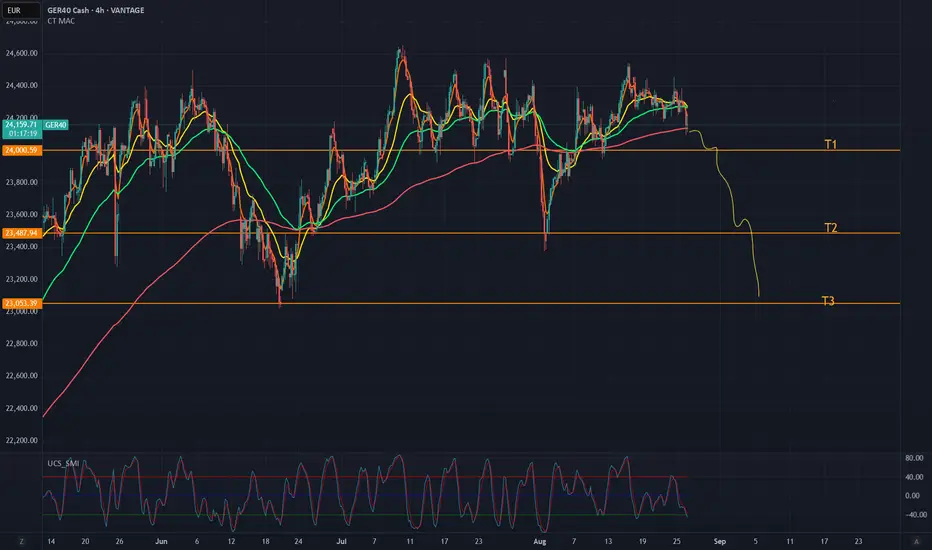
DAX (GER40) – New Short SetupThe DAX is currently trading around 24,150. On the 4-hour chart, price has dropped below the 10 EMA (red line) and failed to reclaim it, which is a bearish signal. The short-term EMAs (yellow and green) are flattening and starting to turn down, showing weakening bullish momentum.
Trade Setup
Entry: Around 24,150 – 24,160
Stop Loss: Above 24,224 (recent local high)
Target 1 (T1): 24,000
Target 2 (T2): 23,488
Target 3 (T3): 23,053
Why I’m Short
Price is now trading weak, also Nasdaq shows signs of a drop - which usually signals bearish momentum.
Multiple failed attempts to reclaim the moving averages show that buyers are losing strength.
The targets are based on clear historical support levels that have been tested multiple times.
Summary
I’m looking for a short entry around 24,150 – 24,160, with targets at 24,000, 23,488, and 23,053.
If price breaks above 24,224 with conviction, the setup becomes invalid.
No financial advice – just my personal trade idea.
GERMANY40MINICFD trade ideas
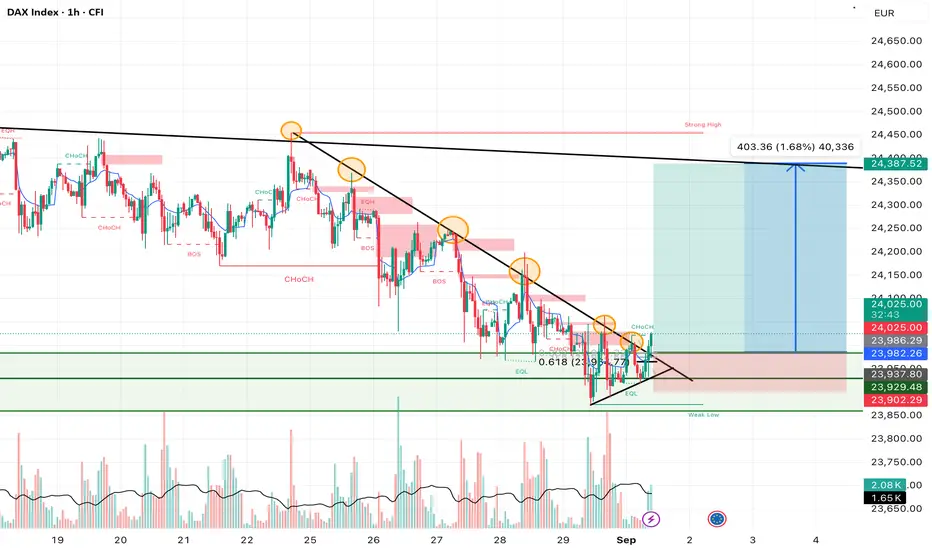
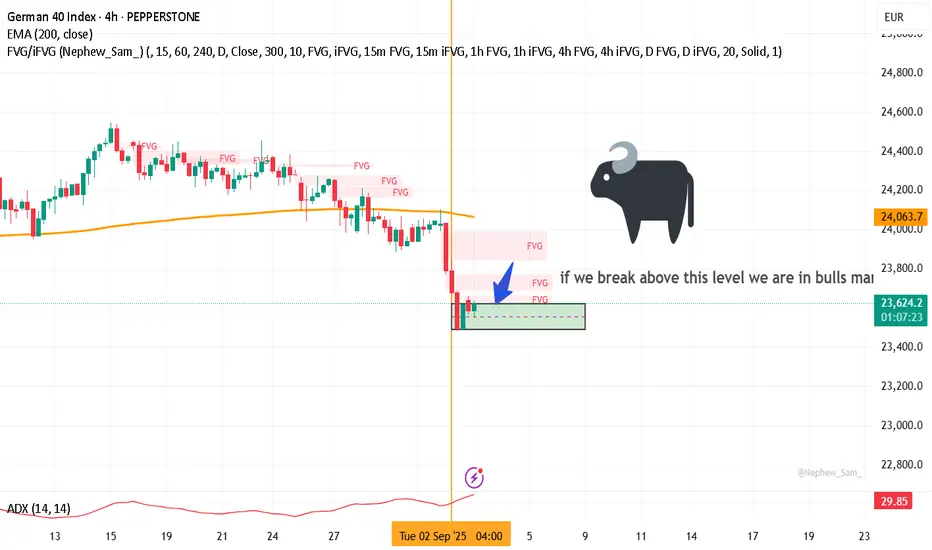
DAX 1H — Clean break of the descending trendline from 22–29 Aug.Context
• Price has been capped by a well-defined descending trendline (orange-tagged lower highs) since last week.
• Into month-end, the selloff lost momentum and compressed into a falling wedge/descending triangle against a 23,93x–23,94x demand (marked by EQL/“weak low”).
• We’ve now impulsed through the local trendline and into the prior 1H supply band, flipping it to potential support.
Structure & confluence on the break
• Multiple BOS/CHoCH prints inside the wedge signaled absorption/basing before the break.
• The breakout occurs around the 0.618 pullback area of the last minor leg, with a neat cluster of equal lows below (liquidity left behind), and room to the upside until the next heavy area: the higher, older trendline / “Strong High” zone.
• Measured from the wedge height, the projection aligns with ~24,387 (shown on chart).
Plan (not financial advice)
• Bias: Long on breakout and/or retest of the broken trendline / prior supply.
• Entry zone: 23,970–23,986 (retest/acceptance above the break).
• Invalidation: 1H close back below 23,930–23,937 (back inside the wedge and under the micro base).
• Protective stop: 23,902 (beneath the “weak low” and wedge base).
• Targets:
• TP1: 24,060 (first 1H supply & dashed mid-range).
• TP2: 24,180–24,220 (prior EQH/dashed line).
• TP3: 24,300 (round number & prior reaction).
• Final: 24,387 (confluence with the higher trendline; your blue arrow).
• R:R guide: From ~23,980 entry to 23,902 stop is ~78 pts risk; to 24,387 is ~+407 pts → ~5.2R if full target prints.
• Management: Once price accepts above ~23,986, consider moving to BE; trail under each new 1H swing low as we stair-step up. Failure to hold 23,970 on the retest = stand aside and reassess.
Alt (bearish) scenario
• A sharp rejection from 24,06x–24,18x and a close back under 23,930 would turn the break into a fake-out, exposing 23,880 → 23,840 and, if that fails, the deeper demand around 23,80x.
Heads-up (event risk this week)
• Eurozone/Germany PMIs (Mon–Tue), Euro area flash HICP (Tue), Germany Factory Orders (Fri), and US NFP (Fri) can all inject volatility—size appropriately and be wary around release times. CFI:GER30
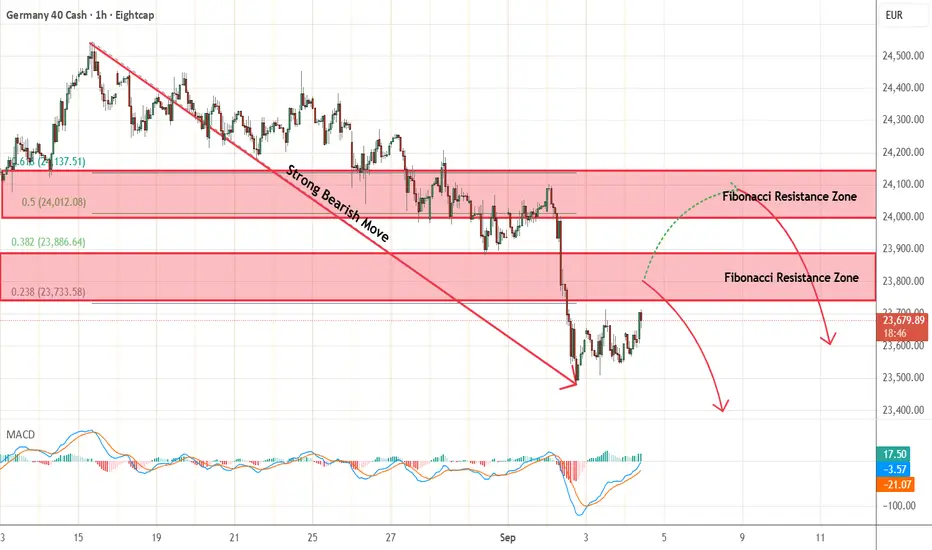
Dax - Short Term Sell IdeaH1 - Strong bearish move.
No opposite signs.
Currently it looks like a pullback is happening.
Expecting bearish continuation until the two Fibonacci resistance zones hold.
If you enjoy this idea, don’t forget to LIKE 👍, FOLLOW ✅, SHARE 🙌, and COMMENT ✍! Drop your thoughts and charts below to keep the discussion going. Your support helps keep this content free and reach more people! 🚀
-------------------------------------------------------------------------------------------------------------------
Short DAXMarket is in strong bearish but i want to see it taken the liquidity up there before it continoue bearish

1st DAX TRADE - LongElite analysis
This is my first Dax trade! :)
All confirmations met, executed off a 5m OB.
Targeting London High Liquidity
This is an insane trade, I am just following my strategy.
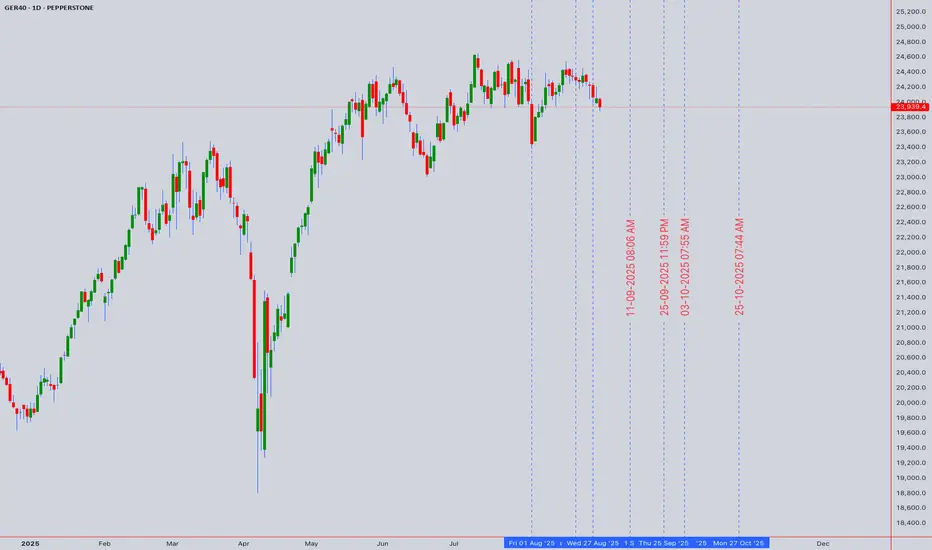
DAX GER40 Technical Analysis: Advanced Weekly Forecast# DAX GER40 Technical Analysis: Comprehensive Multi-Timeframe Trading Strategy & Weekly Forecast
Current Price: 23,939.4 (As of August 30, 2025, 11:54 AM UTC+4)
Asset Class: GER40 / DAX Index
Analysis Date: August 30, 2025
---
Executive Summary
The DAX Index (GER40) continues to showcase remarkable resilience, trading near historic highs at 23,939.4 points. Our comprehensive technical analysis reveals the index has achieved significant milestones, with recent data showing the DE40 reaching 24,084 points on August 28, 2025, despite a monthly decline of 0.55%. The index maintains an impressive 27.35% year-over-year gain, positioning it as one of Europe's strongest performers. Technical confluence suggests potential for further upside toward the 24,500-25,000 zone, contingent on ECB policy support and improving macro conditions.
---
Multi-Timeframe Technical Analysis
Elliott Wave Analysis
The DAX appears to be progressing through a complex corrective pattern within a larger degree bull market:
Primary Count: Wave 5 of (5) within a Grand Super Cycle
Alternative Count: Expanding diagonal formation in final stages
Target Zone: 24,500-25,200 for primary wave completion
Critical Support: 22,800 (Wave 4 low invalidation level)
Long-term Projection: Extension toward 26,000-27,000 in 2026
Wyckoff Market Structure Analysis
Current price action aligns with Wyckoff's Re-accumulation Phase:
Phase: Late Stage Re-accumulation transitioning to Markup
Volume Analysis: Institutional accumulation evident on pullbacks below 23,500
Price Action: Higher lows formation with narrowing consolidation ranges
Composite Operator Activity: Large player absorption at key support levels
W.D. Gann Comprehensive Analysis
Square of 9 Analysis:
- Current price 23,939.4 positioned near critical Gann square resistance
- Next major Gann level: 24,649 (significant 360-degree rotation)
- Time and price confluence: September 21-28, 2025 (Autumn Equinox influence)
- Cardinal squares active at 24,000 and 24,321
Angle Theory Application:
- 1x1 Rising Angle Support: 23,400-23,500
- 2x1 Accelerated Angle: 24,200-24,400 (next resistance cluster)
- 1x2 Support Angle: 22,800-23,000 (major correction target)
Time Cycle Analysis:
- 90-day cycle completion due: Mid-September 2025
- Seasonal Gann Pattern: September-October strength historically favors DAX
- Next major time window: October 15-25, 2025
Price Forecasting:
- Immediate target: 24,200-24,400
- Extended target: 24,800-25,200
- Correction target (if triggered): 22,400-22,800
---
Japanese Candlestick & Harmonic Pattern Analysis
Recent Candlestick Formations (Daily Chart)
Doji Formation: August 28-29 showing indecision at resistance
Long Lower Shadows: Indicating strong buying support below 23,800
Hammer Patterns: Multiple occurrences near 23,500-23,600 support zone
Volume Confirmation: Bullish divergence with increasing volume on rallies
Harmonic Pattern Recognition
Bullish Gartley Pattern: Completion zone 23,200-23,400 (recent support test)
ABCD Extension: Active pattern targeting 24,480-24,650
Butterfly Pattern Potential: Watching for completion near 24,800-25,000
Fibonacci Harmony: 1.618 extension projects to 24,756 from recent swing low
Advanced Pattern Confluence
Three Drives Pattern: Currently in third drive toward 24,200+
Cypher Pattern: Potential reversal zone at 24,500-24,800
Bat Pattern Setup: Monitoring for completion signals above 24,000
---
Ichimoku Kinko Hyo Analysis
Current Cloud Structure (Daily Chart)
Price Position: Solidly above Kumo cloud (strongly bullish)
Tenkan-sen (9-period): 23,847 (short-term trend line)
Kijun-sen (26-period): 23,712 (medium-term trend support)
Senkou Span A: 23,780 (leading span A)
Senkou Span B: 23,445 (leading span B - key support)
Chikou Span: Positioned above price action confirming bullish momentum
Future Kumo (26 periods ahead):
- Thick ascending cloud structure indicating continued bullish bias
- Cloud support zone: 24,200-24,400 (future support levels)
- Kumo twist anticipated: Mid-October 2025
Ichimoku Trading Signals
TK Cross: Tenkan above Kijun (bullish signal active)
Price vs Cloud: Above cloud with strong momentum
Chikou Span: Clear above price history (confirmation signal)
---
Technical Indicators Deep Dive
RSI (Relative Strength Index) Analysis
Daily RSI: 64.8 (healthy bullish momentum, not overbought)
Weekly RSI: 58.3 (room for further upside)
4H RSI: 67.2 (approaching overbought but sustainable)
RSI Divergence: No bearish divergence detected, momentum intact
Bollinger Bands Analysis
Current Position: Price testing upper band resistance
Band Width: Expanding, indicating increasing volatility
BB Squeeze: Recent breakout from squeeze formation
%B Indicator: 0.78 (strong but not extreme reading)
VWAP Analysis (Volume Weighted Average Price)
Daily VWAP: 23,876 (current support level)
Weekly VWAP: 23,654 (key support zone)
Monthly VWAP: 23,423 (major trend support)
Volume Profile: High volume acceptance above 23,500
Moving Average Structure
10 EMA: 23,789 (immediate dynamic support)
20 EMA: 23,712 (short-term trend support)
50 SMA: 23,534 (intermediate support)
100 SMA: 23,287 (key trend support)
200 SMA: 22,845 (major trend support)
Moving Average Signals:
- All major EMAs in bullish alignment
- Golden Cross intact (50/200 cross maintained)
- Price above all key moving averages
---
Support & Resistance Analysis
Primary Resistance Levels
1. R1: 24,000 (psychological and Gann resistance)
2. R2: 24,200-24,400 (2x1 Gann angle cluster)
3. R3: 24,500-24,650 (Harmonic completion zone)
4. R4: 24,800-25,000 (Major extension target)
5. R5: 25,200-25,500 (Long-term Elliott Wave target)
Primary Support Levels
1. S1: 23,712 (Kijun-sen support)
2. S2: 23,500-23,600 (recent swing low zone)
3. S3: 23,200-23,400 (Harmonic support/Weekly VWAP)
4. S4: 22,800-23,000 (1x2 Gann angle/100 SMA)
5. S5: 22,400-22,600 (Major correction target)
Volume-Based Support/Resistance
High Volume Node: 23,400-23,600 (strong support zone)
Low Volume Gap: 24,100-24,300 (potential fast move zone)
Volume Resistance: 24,500+ (historical selling pressure)
---
Multi-Timeframe Trading Strategies
Scalping Strategy (5M & 15M Charts)
5-Minute Timeframe Approach:
Entry Signals: Pullbacks to 10 EMA with RSI <35
Profit Targets: 30-50 points per trade
Stop Loss: 20-25 points maximum risk
Volume Filter: Require above-average volume on entries
Time Window: Focus on 9:00-11:00 AM and 2:00-4:00 PM CET
15-Minute Scalping Strategy:
Range Trading: Current range 23,850-24,050
Breakout Method: Volume spike above 24,050 for continuation
Mean Reversion: Fade moves beyond 2.5 standard deviations from VWAP
Risk Management: Maximum 3 trades per session, 1:2 risk-reward minimum
Intraday Trading Framework (30M, 1H, 4H)
30-Minute Chart Strategy:
Trend Following: Long above 20/50 EMA confluence (23,750)
Pattern Trading: Flag and pennant formations near resistance
Target Methodology: Initial 24,100, extended 24,300
Risk Parameters: 40-60 point stops, 2.5:1 reward-to-risk
1-Hour Chart Approach:
Momentum Trading: MACD bullish crossovers above signal line
Support Bounces: Long positions from 23,650-23,750 zone
Resistance Testing: Monitor price action at 24,000 level
Session Management: European session focus (8:00 AM - 5:00 PM CET)
4-Hour Swing Setup:
Cloud Trading: Long positions on Ichimoku cloud support tests
Elliott Wave: Ride Wave 5 extensions toward 24,500+
Fibonacci Levels: Use 38.2% and 50% retracements for entries
Hold Duration: 2-5 days typical position holding period
Swing Trading Strategy (Daily, Weekly, Monthly)
Daily Chart Methodology:
Breakout Strategy: Long on sustained breaks above 24,000
Pullback Entries: Accumulate on tests of 23,400-23,600
Target Progression: 24,200 → 24,500 → 24,800
Position Sizing: Scale in on multiple time frame confirmations
Weekly Chart Analysis:
Primary Trend: Remains strongly bullish above 23,000
Swing Targets: 24,500-25,000 zone for major profit-taking
Risk Management: Weekly closes below 22,800 signal major reversal
Monthly Chart Perspective:
Long-term Trajectory: Multi-year uptrend intact
Secular Bull Market: Target zones 26,000-28,000 by 2026-2027
Major Support: 21,500-22,000 zone (not expected to test)
---
Day-by-Day Trading Plan: September 2-6, 2025
Monday, September 2, 2025
Market Status: Full trading session (US markets closed - Labor Day)
European Focus: Increased volatility potential due to US absence
Key Levels:
Resistance: 24,000, 24,150
Support: 23,780, 23,650
Trading Strategy:
Morning Session (9:00-12:00 CET): Range trading likely, fade extremes
Afternoon Session (13:00-17:30 CET): Reduced US influence, European-driven moves
Setup Focus: Long 23,750-23,850, Short above 24,100 without volume
Risk Management: Reduced position sizes due to holiday conditions
Tuesday, September 3, 2025
Market Outlook: Full global participation returns
Key Events: German economic data releases, ECB officials speeches
Strategy Framework:
Breakout Focus: Monitor 24,000 level for volume-confirmed breaks
Economic Data: German manufacturing PMI and employment data impact
Entry Zones: Long 23,800-23,900 on pullbacks
Target Areas: 24,150-24,300 on breakout scenarios
Risk Considerations:
- ECB policy communication sensitivity
- German economic data deviation impact
- Post-holiday volume normalization
Wednesday, September 4, 2025
Market Outlook: Mid-week momentum session with ECB focus
Key Events: Potential ECB policy signals, European inflation data
Trading Approach:
Trend Continuation: Above 23,850 favors further upside
Policy Sensitivity: ECB dovish signals bullish for DAX
Technical Setup: Watch for 1-2-3 reversal patterns at resistance
Volume Analysis: Require institutional participation for sustained moves
Thursday, September 5, 2025
Market Outlook: Pre-weekly close positioning
Focus Areas: Technical level respect, institutional flows
Strategy Elements:
Resistance Testing: 24,200-24,400 zone critical
Support Validation: 23,650-23,750 area strength
Pattern Completion: Monitor harmonic pattern developments
Risk-Off Scenarios: Safe-haven flows could pressure DAX
Friday, September 6, 2025
Market Outlook: Weekly close dynamics, position squaring
Key Considerations: NFP impact on global sentiment, weekly technical levels
Trading Framework:
Weekly Close: Above 23,900 maintains bullish structure
Profit-Taking: Expect some long position liquidation
Gap Risk: Prepare for weekend news flow impact
Setup Preservation: Maintain positions with weekly support above 23,700
---
Macroeconomic & Policy Considerations
European Central Bank Policy Impact
The ECB's monetary policy stance remains crucial for DAX performance. Recent ECB decisions show the Governing Council decided to lower the three key ECB interest rates by 25 basis points in March 2025, with domestic price pressures continuing to ease, with wages growing more slowly. This dovish stance supports equity valuations and German corporate profitability.
German Economic Outlook
The German economic environment presents mixed signals. While economic activity is expected to broadly stagnate in 2025 and trade tensions are set to significantly weigh on exports, there are positive factors including Germany's fiscal stimulus supporting better growth prospects.
Eurozone Growth Projections
The broader eurozone context shows Real GDP projected to grow by 0.9% in 2025, 1.1% in 2026 and 1.3% in 2027, with EA GDP growth to average 0.9% in 2025 and accelerate to 1.3% in 2026.
Key Risk Factors
1. Trade Policy Uncertainty: Trade policy uncertainty over recent months is expected to reduce global growth
2. Global Trade Tensions: Ongoing US-China trade dynamics affecting European exports
3. ECB Policy Divergence: Potential policy normalization pressures
4. Geopolitical Risks: Eastern European tensions and energy security concerns
---
Sector Analysis & DAX Components
Best Performing Components
Current analysis shows the champion of GERMAN STOCK INDEX (DAX) is XETR:ENR — it's gained 265.49% over the year, indicating strong sectoral divergence within the index.
Sector Rotation Implications
Technology Sector: Leading performance driving index higher
Industrial Sector: Mixed performance due to export pressures
Financial Sector: Benefiting from ECB policy normalization expectations
Consumer Discretionary: Supported by potential wage growth and consumer spending
---
Risk Management Framework
Position Sizing Guidelines
Scalping Positions: 0.5-1% account risk per trade
Intraday Trades: 1-2% account risk maximum
Swing Positions: 2-3% account risk per position
Maximum Exposure: 8% total DAX-related risk at any time
Stop-Loss Protocols
Scalping: 20-30 points maximum loss
Intraday: 50-80 points based on volatility
Swing Trading: Below key support levels (23,400 for current longs)
Technical Stops: Below major moving averages and pattern invalidation levels
Profit-Taking Strategy
Scaling Approach: Take 40% at first target, 35% at second target, hold 25% for extensions
Trailing Stops: Implement after 2:1 favorable movement
Time-Based Exits: Close positions before major ECB announcements
Pattern-Based Exits: Honor harmonic pattern completion zones
---
Weekly Outlook Probability Analysis
Bullish Scenario (Probability: 65%)
Catalysts:
- ECB maintains dovish policy stance
- German economic data shows stabilization signs
- Technical breakout above 24,000 with volume
- US-Europe trade tensions remain contained
Price Targets:
- Initial: 24,200-24,400
- Extended: 24,500-24,800
- Optimistic: 25,000+
Neutral/Consolidation Scenario (Probability: 25%)
Characteristics:
- Range-bound trading between 23,600-24,200
- Mixed economic signals from Germany
- ECB policy uncertainty
- Technical indecision at resistance levels
Trading Range:
- Upper Bound: 24,100-24,200
- Lower Bound: 23,500-23,600
- Strategy: Range trading, fade extremes
Bearish Scenario (Probability: 10%)
Risk Factors:
- Significant deterioration in German economic data
- ECB hawkish surprise or policy error
- Major geopolitical shock
- Technical breakdown below 23,400
Downside Targets:
- Initial: 23,000-23,200
- Extended: 22,600-22,800
- Crisis: 22,000-22,400
---
Advanced Trading Techniques
Correlation Analysis
EUR/USD Impact: Strong positive correlation (0.72)
US500 Relationship: Moderate correlation (0.58) with divergence potential
Bond Yields: German Bund yields inverse relationship
Commodity Exposure: Energy prices correlation through industrial components
Options Market Insights
Put/Call Ratio: Currently neutral, no extreme positioning
Options Skew: Slight put premium indicating downside hedging
Gamma Exposure: Positive gamma above 23,800, negative below
Key Strike Levels: 24,000 calls, 23,500 puts show high open interest
Institutional Flow Analysis
Foreign Investment: Positive European equity flows from US institutions
Pension Fund Activity: Rebalancing flows supporting DAX components
Hedge Fund Positioning: Net long but not extreme levels
ETF Flows: Consistent inflows into German equity ETFs
---
For individuals seeking to enhance their trading abilities based on the analyses provided, I recommend exploring the mentoring program offered by Shunya Trade. (Website: shunya dot trade)
I would appreciate your feedback on this analysis, as it will serve as a valuable resource for future endeavors.
Sincerely,
Shunya.Trade
Website: shunya dot trade
---
*This analysis is for educational purposes only and does not constitute investment advice. Always implement proper risk management and consult with qualified financial professionals before making investment decisions.* Disclaimer: This post is intended solely for educational purposes and does not constitute investment advice, financial advice, or trading recommendations. The views expressed herein are derived from technical analysis and are shared for informational purposes only. The stock market inherently carries risks, including the potential for capital loss. Therefore, readers are strongly advised to exercise prudent judgment before making any investment decisions. We assume no liability for any actions taken based on this content. For personalized guidance, it is recommended to consult a certified financial advisor.
---
DAX: Move Down Expected! Short!
My dear friends,
Today we will analyse DAX together☺️
The in-trend continuation seems likely as the current long-term trend appears to be strong, and price is holding below a key level of 23,552.71 So a bearish continuation seems plausible, targeting the next low. We should enter on confirmation, and place a stop-loss beyond the recent swing level.
❤️Sending you lots of Love and Hugs❤️
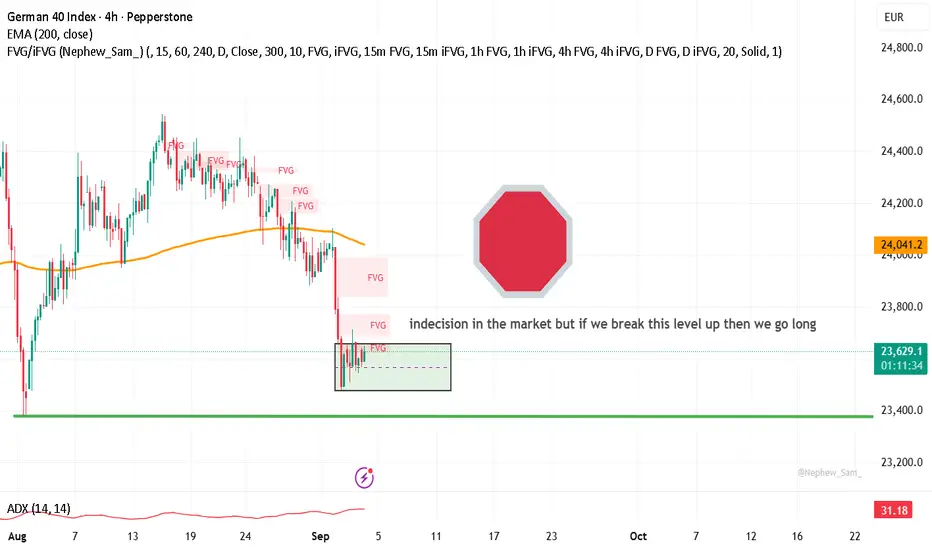
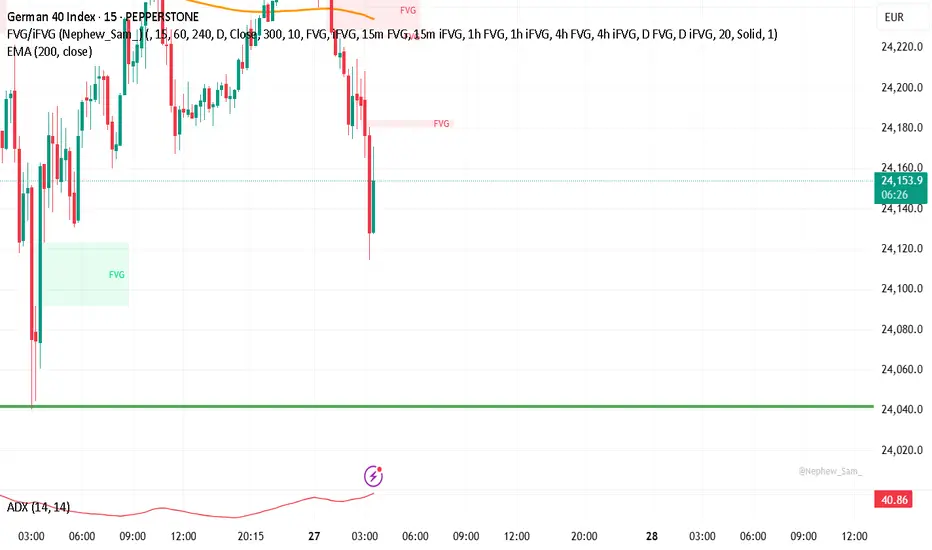
DAX 40: Important Level Ahead of Index ReshuffleThe DAX is currently consolidating at a critical level on the higher timeframes. We’re seeing indecision in the market and the next move will likely depend on how London session plays out.
If price breaks above this consolidation zone → bullish confirmation.
If price rejects and stays below → bearish continuation.
No trade until we get a clear break and retest. London might just consolidate, so patience is key.
STOXX just announced the September reshuffle of the DAX (effective Sept 22). GEA Group joins the index, while Sartorius, Scout24, and Porsche AG exit. This increases the DAX’s industrial exposure and reduces its defensive healthcare/tech weight making it more sensitive to trends.
We’re at an important decision point. Wait for London to show its hand before committing.
Good luck traders and remember this is not financial advice =)
GER30 BUY CHoC in Lower Time Frame
We on demand zone on Lower Time Frame
Holding trade for whole day

DAX is under pressure DAX displays a relatively weak performance. Unlike US indices, it is moving for 2 weeks in a row in a declining trend, closing below the 20-day moving average. Volatility remains low, that’s why the decline of DAX is rather slow, but the acceleration of a bearish move might be accompanied by the increasing pace and the appearance of the large red distribution day.
The next possible support is positioned at around 23600 price are
Don't forget - this is just the idea. Always do your own research and never forget to manage your risk!

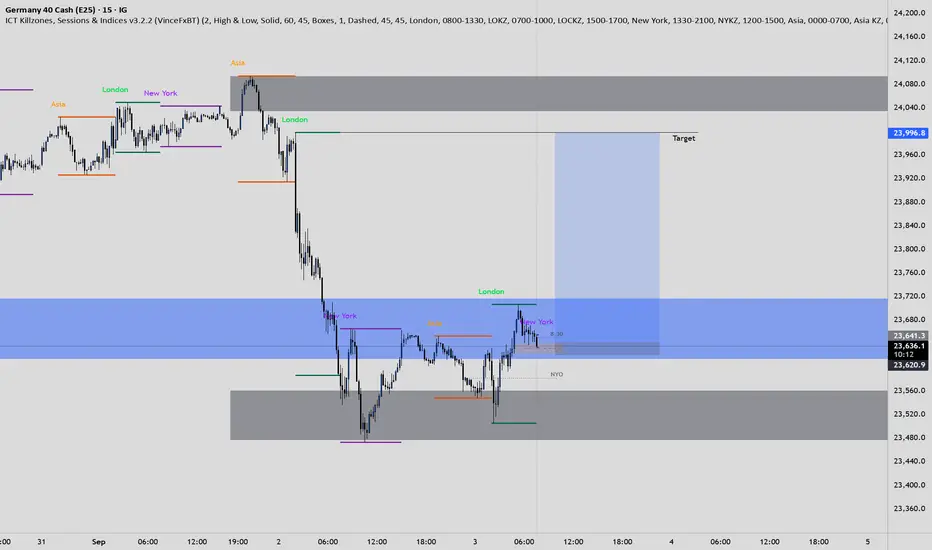
Title: London Session Outlook – Push Up Before Down
We are currently pushing off a 1H gap that has been respected. For the London session, I expect price to push up first to grab liquidity before continuing down. Watching closely for rejection around resistance to confirm the downside move.
Price reacting to respected I HR Gap
Expecting an initial push up (liquidity grab)
Looking for continuation down afterward
This is my outlook, not financial advice.
Share your thoughts guys!
DAX: Strong Growth Ahead! Long!
My dear friends,
Today we will analyse DAX together☺️
The recent price action suggests a shift in mid-term momentum. A break above the current local range around 23,988.61 will confirm the new direction upwards with the target being the next key level of 23,061.08 and a reconvened placement of a stop-loss beyond the range.
❤️Sending you lots of Love and Hugs❤️

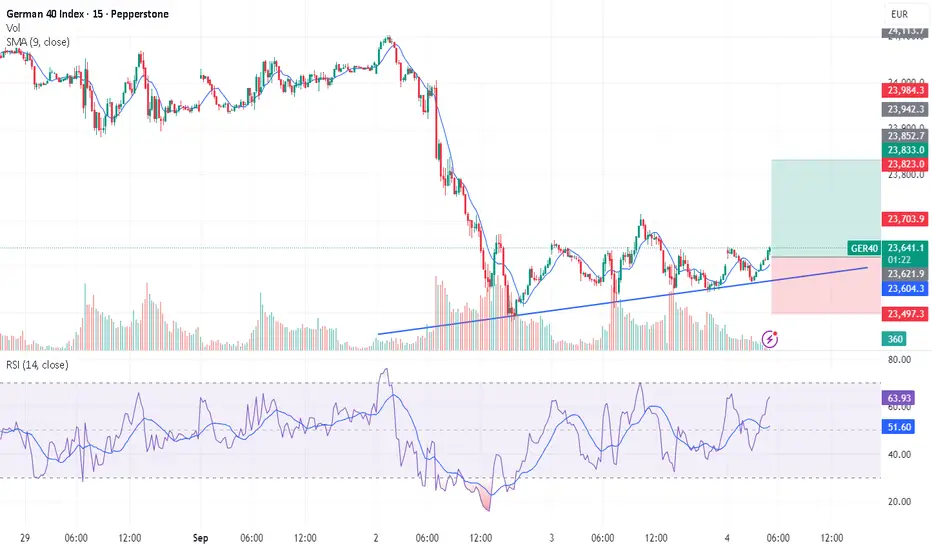
GER30/DAX30 - TIME TO GET RICHTeam, I have been patiently waiting for the market to consolidate
Here is the reason i am going long
Unemployment down from 6.20 to 6.00 couple 2 days ago
Inflation is under control at 2.1 - perfect
RETAILS come out shortly in 3 hours.
Let's go, if you're going long 23639 and 23600
STOP LOSS at 23460
Target 1 at 23700-23750 - take 70% profit and bring stop loss to BE
Target 2 at 23800-23860
LETS KILL THE BEAST TOGETHER
DE30/DAX Long Trade ICMARKETS:DE30 / XETR:DAX Long Trade
Entry: 23,390 - 23,630
TP-1: 24,025
TP-2: 24,150
This is good trade.
Don't overload your risk like Greedy gambler!!!
Be Disciplined Trader, what what you can afford.
Use proper risk management.
Disclaimer: Trading is risky, only idea, not advice.

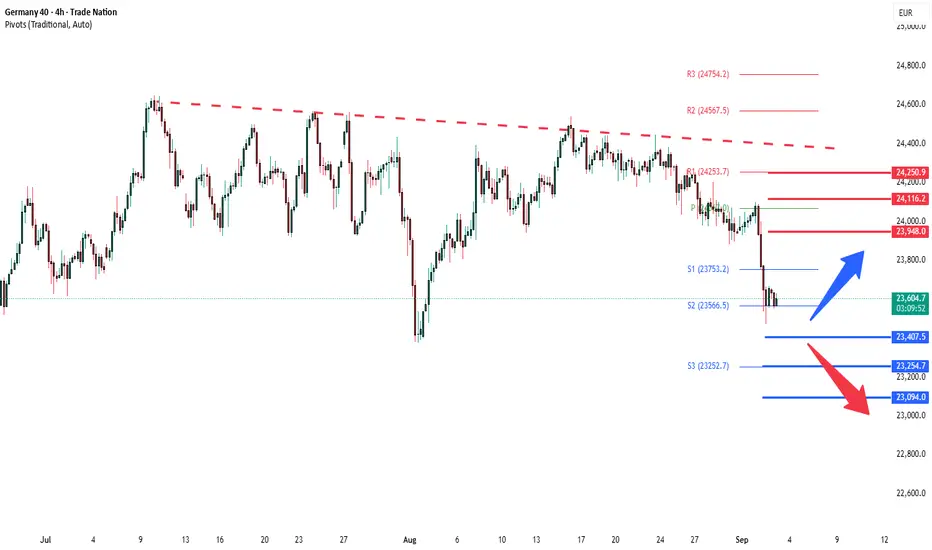
DAX40 support retest at 24000 ?The DAX remains in a bullish trend, with recent price action indicating a potential oversold rally within the broader uptrend.
Support Zone: 24000 – a key level from previous consolidation. Price is currently testing or approaching this level.
A bullish rebound from 24000 would confirm ongoing upside momentum, with potential targets at:
24540 – initial resistance
24670 – psychological and structural level
24980 – extended resistance on the longer-term chart
Bearish Scenario:
A confirmed break and daily close below 24000 would weaken the bullish outlook and suggest deeper downside risk toward:
23790 – minor support
23600 – stronger support and potential demand zone
Outlook:
Bullish bias remains intact while the FTSE holds above 23790. A sustained break below this level could shift momentum to the downside in the short term.
This communication is for informational purposes only and should not be viewed as any form of recommendation as to a particular course of action or as investment advice. It is not intended as an offer or solicitation for the purchase or sale of any financial instrument or as an official confirmation of any transaction. Opinions, estimates and assumptions expressed herein are made as of the date of this communication and are subject to change without notice. This communication has been prepared based upon information, including market prices, data and other information, believed to be reliable; however, Trade Nation does not warrant its completeness or accuracy. All market prices and market data contained in or attached to this communication are indicative and subject to change without notice.

DAX: 50DMA break puts downside levels in playThe Germany 40 contract is trading through the 50-day simple moving average, a level that’s been tested frequently over the past month but never closed below until Wednesday. Should the price be unable to reclaim the level, a short setup may be in order.
While some may be prepared to establish shorts beneath the 50DMA with a tight stop above for protection, the preference would be to see the price push meaningfully below 24000 given how many times it bounced from beneath the level when trading above the 50DMA over the past month.
Bids may be found at 23800 and again at 23620, the latter coinciding with the uptrend running from the June swing low. Ultimately, however, 23400 screens as a more appealing target given it’s where the price bounced strongly from earlier this month.
Of course, if the price were to reverse back above the 50DMA and close there, the setup could be flipped with longs established above and a stop beneath for protection. The downtrend from the record highs set on July 10 sits just beneath 24400 today, making that a potential target. 24530 is another, coinciding with where the price stalled on four separate occasions since July 23.
RSI (14) is trending lower and now sits beneath 50, providing a slightly bearish signal. However, it’s yet to be confirmed by MACD, which remains in positive territory despite crossing over from above earlier this week. The overall momentum signal is therefore neutral, placing more emphasis on price action to guide trading decisions.
Good luck!
DS

GER30 H1 | Bearish reversal off 50% Fibonacci resistanceGER30 is rising towards the sell entry at 24,240.91, which is a pullback resistance that lines up with the 50% Fibonacci retracement and could drop from this level to the downside.
Stop loss is at 24,396.95, which is a swing high resistance.
Take profit is at 23,964.31, which is a swing low support.
High Risk Investment Warning
Trading Forex/CFDs on margin carries a high level of risk and may not be suitable for all investors. Leverage can work against you.
Stratos Markets Limited (tradu.com ):
CFDs are complex instruments and come with a high risk of losing money rapidly due to leverage. 65% of retail investor accounts lose money when trading CFDs with this provider. You should consider whether you understand how CFDs work and whether you can afford to take the high risk of losing your money.
Stratos Europe Ltd (tradu.com ):
CFDs are complex instruments and come with a high risk of losing money rapidly due to leverage. 66% of retail investor accounts lose money when trading CFDs with this provider. You should consider whether you understand how CFDs work and whether you can afford to take the high risk of losing your money.
Stratos Global LLC (tradu.com ):
Losses can exceed deposits.
Please be advised that the information presented on TradingView is provided to Tradu (‘Company’, ‘we’) by a third-party provider (‘TFA Global Pte Ltd’). Please be reminded that you are solely responsible for the trading decisions on your account. There is a very high degree of risk involved in trading. Any information and/or content is intended entirely for research, educational and informational purposes only and does not constitute investment or consultation advice or investment strategy. The information is not tailored to the investment needs of any specific person and therefore does not involve a consideration of any of the investment objectives, financial situation or needs of any viewer that may receive it. Kindly also note that past performance is not a reliable indicator of future results. Actual results may differ materially from those anticipated in forward-looking or past performance statements. We assume no liability as to the accuracy or completeness of any of the information and/or content provided herein and the Company cannot be held responsible for any omission, mistake nor for any loss or damage including without limitation to any loss of profit which may arise from reliance on any information supplied by TFA Global Pte Ltd.
The speaker(s) is neither an employee, agent nor representative of Tradu and is therefore acting independently. The opinions given are their own, constitute general market commentary, and do not constitute the opinion or advice of Tradu or any form of personal or investment advice. Tradu neither endorses nor guarantees offerings of third-party speakers, nor is Tradu responsible for the content, veracity or opinions of third-party speakers, presenters or participants.
German Index Recovery: Breakout or Just a Bounce?The German index is showing signs of recovery ahead of the London session, but the key question is whether this is a genuine shift or just a retracement. Price is holding around 23,550 support, and if we see a break and sustained move above 23,800, buyers could gain control and open the door for further upside.
So what happened with the sentiment? Political and economic factors are adding strength to improving German and Eurozone PMI data, better business sentiment, and expectations of ECB support are all lifting confidence.
But before you hit the BUY button remember 23,800–24,000 remains a critical resistance zone, and how price reacts there will decide if this bounce continues or if sellers' step back in.
This is not financial advice =)
Post-CPI DAX Short OpportunityExpecting the DAX to drop after the Eurozone CPI release. Trading cautiously and looking for short opportunities, ideally supported by the FVGs we see on the higher TFs.
The Eurozone CPI shows how fast prices are rising in Europe. If we get a higher than expected, the ECB may keep rates high, which is usually negative for some stocks. For the DAX40, this can trigger a sell-off.
After the release let's wait 15–20 minutes before trading. We can spot the real direction.
Trade with caution traders! Share your thoughts Traders and remember this is not financial advice.

DAX40 corrective pullback support at 23400The DAX remains in a bullish trend, with recent price action indicating a potential oversold rally within the broader uptrend.
Support Zone: 23400 – a key level from previous consolidation. Price is currently testing or approaching this level.
A bullish rebound from 23400 would confirm ongoing upside momentum, with potential targets at:
23950 – initial resistance
24116 – psychological and structural level
24250 – extended resistance on the longer-term chart
Bearish Scenario:
A confirmed break and daily close below 23400 would weaken the bullish outlook and suggest deeper downside risk toward:
23250 – minor support
23094 – stronger support and potential demand zone
Outlook:
Bullish bias remains intact while the Dax40 holds above 23950. A sustained break below this level could shift momentum to the downside in the short term.
This communication is for informational purposes only and should not be viewed as any form of recommendation as to a particular course of action or as investment advice. It is not intended as an offer or solicitation for the purchase or sale of any financial instrument or as an official confirmation of any transaction. Opinions, estimates and assumptions expressed herein are made as of the date of this communication and are subject to change without notice. This communication has been prepared based upon information, including market prices, data and other information, believed to be reliable; however, Trade Nation does not warrant its completeness or accuracy. All market prices and market data contained in or attached to this communication are indicative and subject to change without notice.

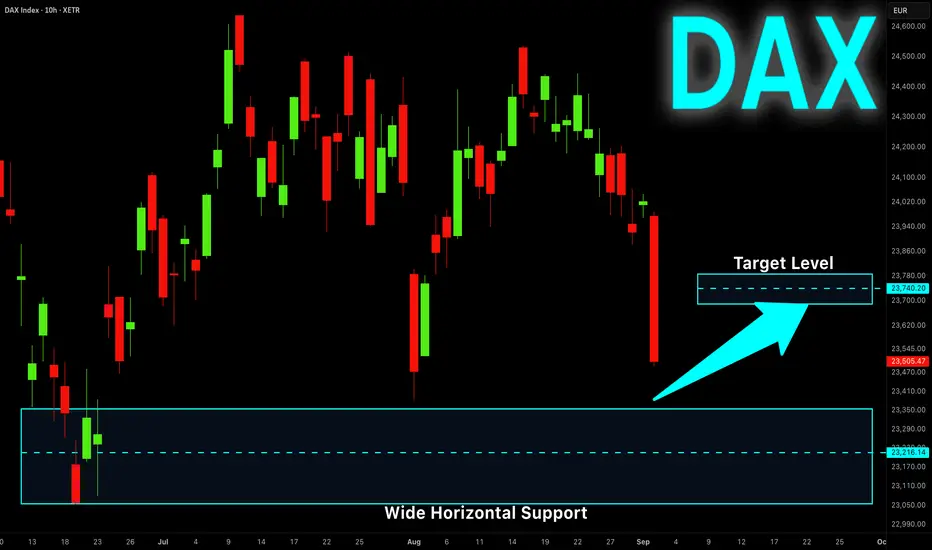
DAX Strong Support Ahead! Buy!
Hello,Traders!
DAX is making a nice
Bearish correction but
The index is generally
In the uptrend and as
The strong horizontal
Demand area is below
Around 23110 from where
We will be expecting a
Bullish rebound and
A move up
Buy!
Comment and subscribe to help us grow!
Check out other forecasts below too!
Disclosure: I am part of Trade Nation's Influencer program and receive a monthly fee for using their TradingView charts in my analysis.
DAX40 Quick Trade Double Bottom Buy ChanceDouble bottom on the 1 hour candle chart and inverted head and shoulder on the line chart.
Good luck
Markets Titan
