GERMANY40MINICFD trade ideas
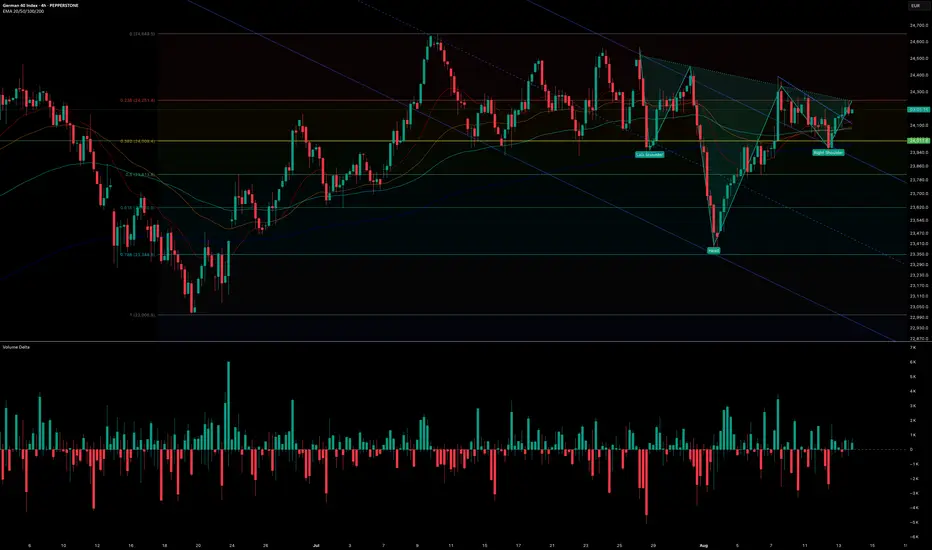
Both Technical and Valuation Signals Points Incoming VolatilityThe DAX has been moving sideways since May, with this flat movement evolving into a triangle formation since June. Price action is contracting, and the index appears to be waiting for a catalyst to determine its next direction.
The DAX is currently near the regression line from the November dip, which keeps both upward and downward possibilities open, consistent with the neutral signal from the triangle pattern.
From a valuation perspective, the DAX’s forward P/E ratio stands at 16.95x, roughly one standard deviation above its 2009-to-date regression line, making it relatively expensive compared to its own history. The S&P 500 trades at a much higher forward P/E of 24.25x, but that figure is near its own long-term regression line. Since early June, the DAX/S&P 500 ratio has fallen by nearly 10%, significantly reducing the DAX’s relative overvaluation and potentially giving it room for another leg higher.
Ultimately, the triangle formation may be the deciding factor. The current upper boundary is at 24,500, and the lower boundary is at 23,490. A break of either could bring volatility back to the DAX, with momentum likely to follow the breakout direction. An upward break could target the 24,400–24,500 zone.
GER30 shows a bullish momentum GER30 has just formed a bullish flag and we expect prices to continue pushing towards the upside

GER30 is very bullishGER30 has just formed a bullish flag and we expect prices to continue to push to the upside

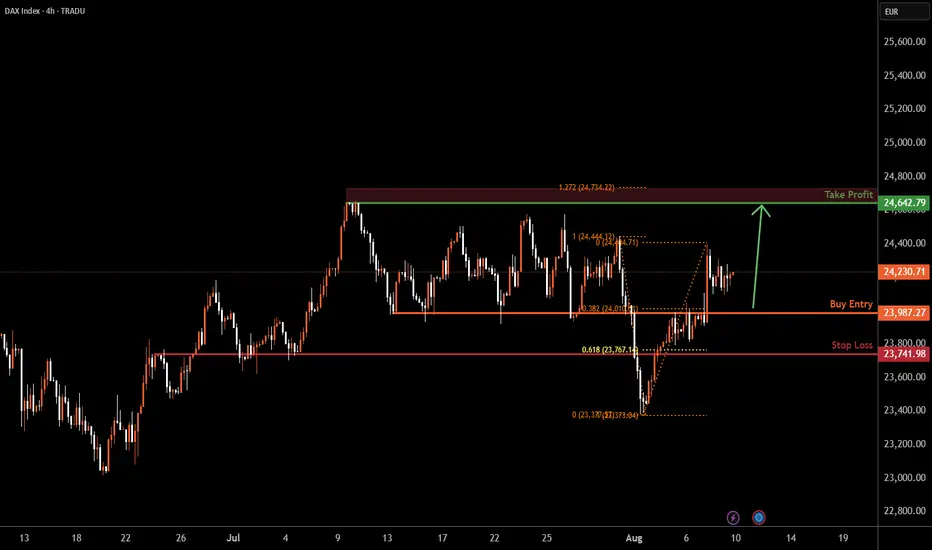
GER30 H4 | Bullish bounceGER30 has bounced off the buy entry at 23,987.27, which is an overlap support that lines up with the 38.2% Fibonacci retracement and could potentially rise from this level to the upside.
Stop loss is at 23,741.98, which is a pullback support that lines up with the 61.8% Fibonacci retracement.
Take profit is at 24,642.79, which is a swing high resistance that lines up with the 161.8% Fibonacci extension.
High Risk Investment Warning
Trading Forex/CFDs on margin carries a high level of risk and may not be suitable for all investors. Leverage can work against you.
Stratos Markets Limited (tradu.com ):
CFDs are complex instruments and come with a high risk of losing money rapidly due to leverage. 65% of retail investor accounts lose money when trading CFDs with this provider. You should consider whether you understand how CFDs work and whether you can afford to take the high risk of losing your money.
Stratos Europe Ltd (tradu.com ):
CFDs are complex instruments and come with a high risk of losing money rapidly due to leverage. 66% of retail investor accounts lose money when trading CFDs with this provider. You should consider whether you understand how CFDs work and whether you can afford to take the high risk of losing your money.
Stratos Global LLC (tradu.com ):
Losses can exceed deposits.
Please be advised that the information presented on TradingView is provided to Tradu (‘Company’, ‘we’) by a third-party provider (‘TFA Global Pte Ltd’). Please be reminded that you are solely responsible for the trading decisions on your account. There is a very high degree of risk involved in trading. Any information and/or content is intended entirely for research, educational and informational purposes only and does not constitute investment or consultation advice or investment strategy. The information is not tailored to the investment needs of any specific person and therefore does not involve a consideration of any of the investment objectives, financial situation or needs of any viewer that may receive it. Kindly also note that past performance is not a reliable indicator of future results. Actual results may differ materially from those anticipated in forward-looking or past performance statements. We assume no liability as to the accuracy or completeness of any of the information and/or content provided herein and the Company cannot be held responsible for any omission, mistake nor for any loss or damage including without limitation to any loss of profit which may arise from reliance on any information supplied by TFA Global Pte Ltd.
The speaker(s) is neither an employee, agent nor representative of Tradu and is therefore acting independently. The opinions given are their own, constitute general market commentary, and do not constitute the opinion or advice of Tradu or any form of personal or investment advice. Tradu neither endorses nor guarantees offerings of third-party speakers, nor is Tradu responsible for the content, veracity or opinions of third-party speakers, presenters or participants.
GERM30It's been a long time since I shared my idea.
Here we go; the market has collected enough liquidity to push up. It has bounced on the psychological area on the horizontal trend line where money gets pumped. Now that I missed the entry, I am waiting for a small pullback, then I'm in, taking my 1st TP in the 1st key level, and so on and so on.

DAX: Will Go Up! Long!
My dear friends,
Today we will analyse DAX together☺️
The recent price action suggests a shift in mid-term momentum. A break above the current local range around 24,048.10 will confirm the new direction upwards with the target being the next key level of 24,154.31 and a reconvened placement of a stop-loss beyond the range.
❤️Sending you lots of Love and Hugs❤️
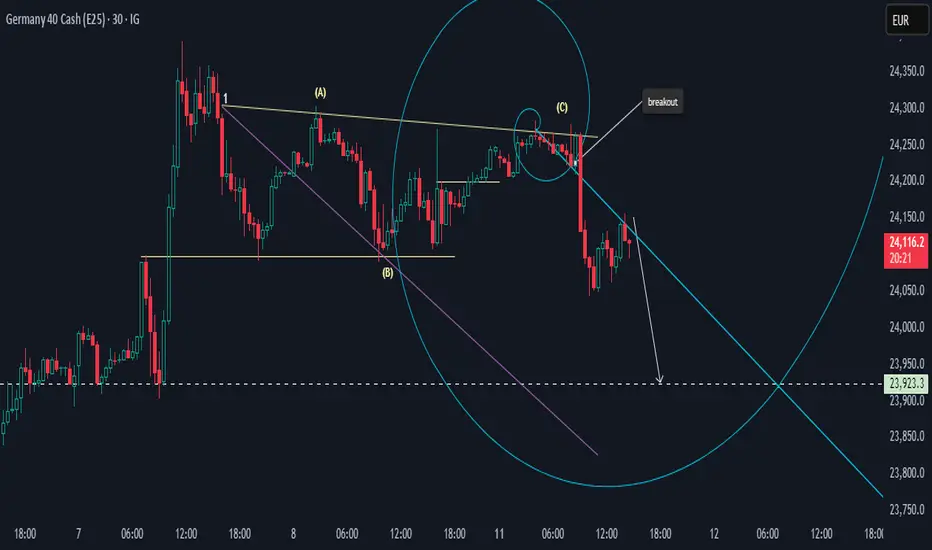
DAX At Resistance Aiming for Lower Lows.Hi there,
The DAX looks bearish at the M30, aiming for the 23923.3 support area. It looks like it needs to be watched because the price could spike higher.
Happy trading, wishing you a lovely week.
Khiwe.
Not trading advice
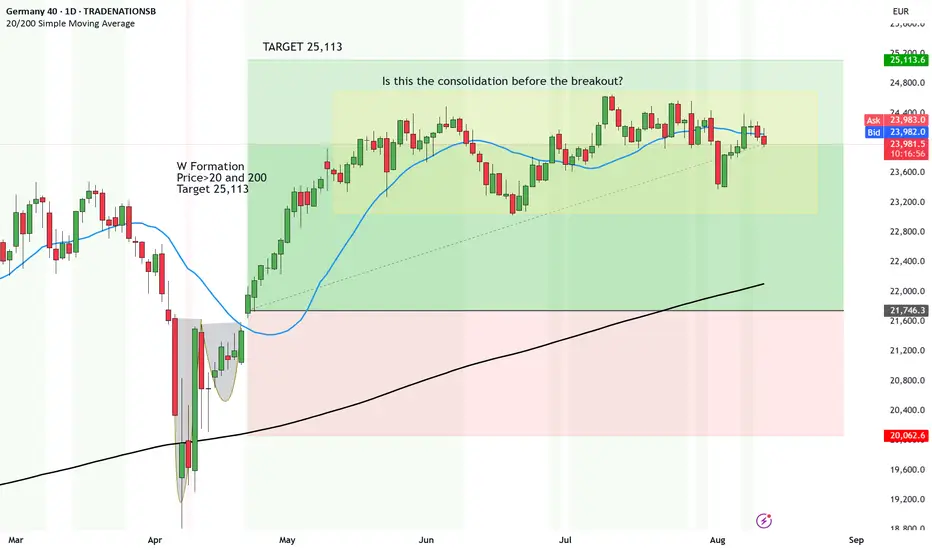
Chop for Germany but imminent breakout luring Ok we are not supposed to make predictions but only reactions to trading right?
Well this time I am making a prediction.
Since the chop sideways box has been forming, a breakout is imminent.
Either it will break up and head to the initial target of 25,113.
Or it will breakdown and the market will have a correction.
Either way, the breakout will occur because Germany can't just stay in this range forever right?
So why the chop?
🌍 DAX strong abroad, weak at home
🐌 Earnings lag behind U.S. peers
🏛️ Bureaucracy & labor shortages drag
Let's hope for some optimistic news with DAX and that we do get a breakout and up to 25,113.
Disclosure: I am part of Trade Nation's Influencer program and receive a monthly fee for using their TradingView charts in my analysis.
GER40As mentioned before, dax is going to go down, then recover. So far on the 4H chart we can see it has already started its move down.

DAX40 Bullish Flag forming The DAX remains in a bullish trend, with recent price action indicating a potential oversold rally within the broader uptrend.
Support Zone: 23790 – a key level from previous consolidation. Price is currently testing or approaching this level.
A bullish rebound from 23790 would confirm ongoing upside momentum, with potential targets at:
24540 – initial resistance
24670 – psychological and structural level
24980 – extended resistance on the longer-term chart
Bearish Scenario:
A confirmed break and daily close below 23790 would weaken the bullish outlook and suggest deeper downside risk toward:
23610 – minor support
23400 – stronger support and potential demand zone
Outlook:
Bullish bias remains intact while the FTSE holds above 23790. A sustained break below this level could shift momentum to the downside in the short term.
This communication is for informational purposes only and should not be viewed as any form of recommendation as to a particular course of action or as investment advice. It is not intended as an offer or solicitation for the purchase or sale of any financial instrument or as an official confirmation of any transaction. Opinions, estimates and assumptions expressed herein are made as of the date of this communication and are subject to change without notice. This communication has been prepared based upon information, including market prices, data and other information, believed to be reliable; however, Trade Nation does not warrant its completeness or accuracy. All market prices and market data contained in or attached to this communication are indicative and subject to change without notice.

Technical Analysis WeeklyGermany 40 is in a range-bound environment, currently trading at 24,061, exactly at its VWAP of 24,061. RSI at 50 reflects balanced momentum. Support lies at 23,540 and resistance is seen at 24,657.
UK 100 continues its bullish trend, undergoing a small pullback. Price is at 9,131, just above its VWAP of 9,120. RSI at 61 indicates steady bullish interest. Support is at 9,026 and resistance is at 9,188.
Wall Street remains bullish but is now in a corrective phase. Price has dropped to 44,264, right below its VWAP of 44,300. The RSI of 51 suggests a neutral outlook with mild bullish undertones. Support is at 43,563 and resistance is at 45,160.
Brent Crude continues in a choppy range but has broken down to a 2-month low, trading at 6,659, below its VWAP of 6,840. The RSI at 42 highlights new downside pressure. Support sits at
6,453 and resistance at 7,226.
Gold remains in a neutral range, with price at 3,361, matching its VWAP and right in the middle of the range. The RSI at 50 shows a balanced market outlook. Support is at 3,283 and resistance is at 3,435.
EUR/USD holds a bullish trend but is correcting within a short term trading range. The pair trades at 1.1624, exactly at its VWAP. RSI at 50 reflects a balanced market. Support is at 1.14291 and resistance at 1.18296.
GBP/USD has rebounded within a downtrend to test the downtrend line. It trades at 1.3422, slightly above the VWAP of 1.3389. The RSI of 51 signals a balanced tone with possible upside. Support is at 1.3187 and resistance at 1.3592.
USD/JPY remains neutral in a range phase. A sharp reversal from above 150 has seen the price drop to 147.85, equal to its VWAP. RSI at 53 suggests a balanced outlook. Support is at 145.78 and resistance stands at 149.66.
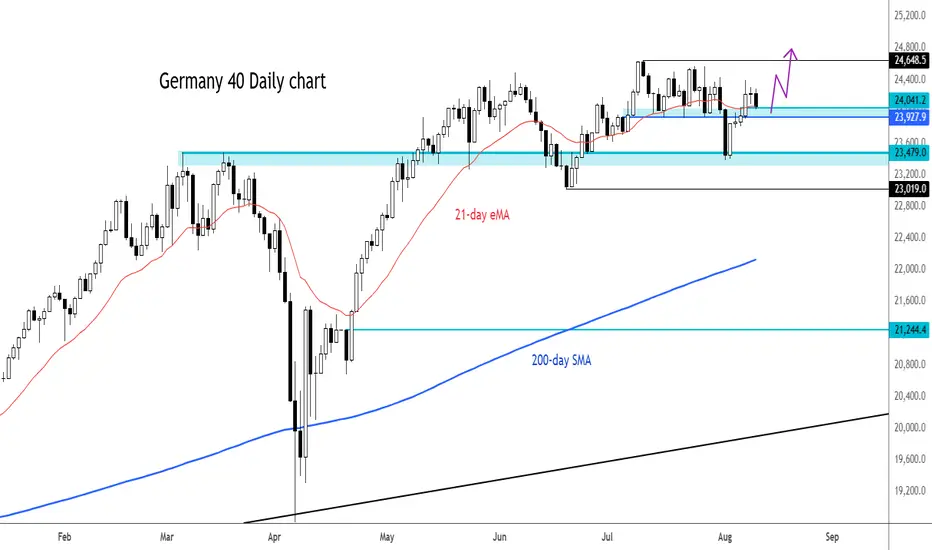
DAX testing supportCould the DAX bounce back here after starting the day lower?
At the time of writing, the German benchmark index was testing key short-term support between 23,928 to 24,041. This area was previously resistance while the 21-day exponential average also comes into play here.
if we see a bounce here then a new all-time high could be on the cards. Else, a potential break down could target the old support and resistance range around 23,500.
By Fawad Razaqzada, market analyst with FOREX.com
Dax short medium termBearish till 21.800 which is an important retest. SL on a daily close above 24.000


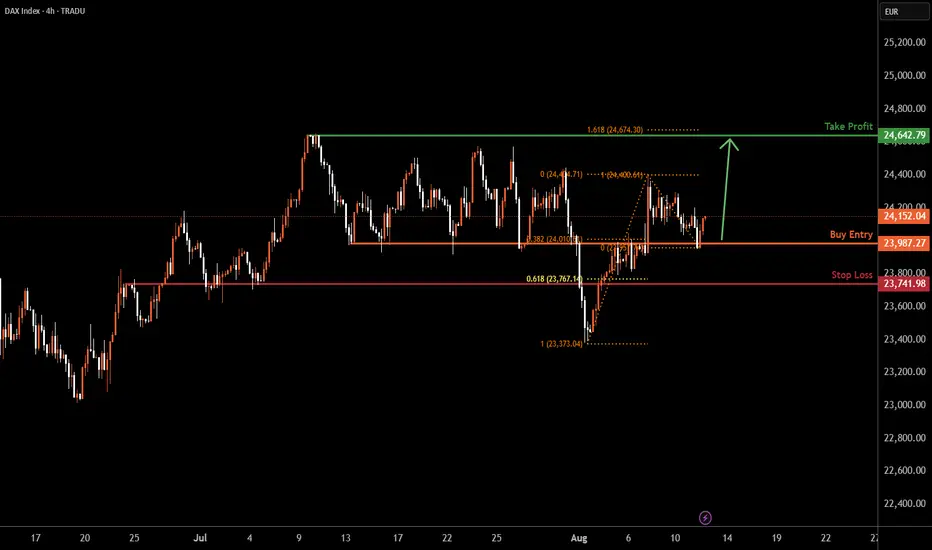
GER30 H4 | Bullish bounce off overlap supportGER30 is falling towards the buy entry which is a pullback support that aligns with the 38.2% Fibonacci retracement and could bounce to the upside.
Buy entry is at 23,987.27, which is a pullback support that lines up with the 38.2% Fibonacci retracement.
Stop loss is at 23,741.98, which is a pullback support that lines up with the 61.8% Fibonacci retracement.
Take profit is at 24,642.79, which is a swing high resistance that is slightly below the 127.2% Fibonacci extension.
High Risk Investment Warning
Trading Forex/CFDs on margin carries a high level of risk and may not be suitable for all investors. Leverage can work against you.
Stratos Markets Limited (tradu.com ):
CFDs are complex instruments and come with a high risk of losing money rapidly due to leverage. 65% of retail investor accounts lose money when trading CFDs with this provider. You should consider whether you understand how CFDs work and whether you can afford to take the high risk of losing your money.
Stratos Europe Ltd (tradu.com ):
CFDs are complex instruments and come with a high risk of losing money rapidly due to leverage. 66% of retail investor accounts lose money when trading CFDs with this provider. You should consider whether you understand how CFDs work and whether you can afford to take the high risk of losing your money.
Stratos Global LLC (tradu.com ):
Losses can exceed deposits.
Please be advised that the information presented on TradingView is provided to Tradu (‘Company’, ‘we’) by a third-party provider (‘TFA Global Pte Ltd’). Please be reminded that you are solely responsible for the trading decisions on your account. There is a very high degree of risk involved in trading. Any information and/or content is intended entirely for research, educational and informational purposes only and does not constitute investment or consultation advice or investment strategy. The information is not tailored to the investment needs of any specific person and therefore does not involve a consideration of any of the investment objectives, financial situation or needs of any viewer that may receive it. Kindly also note that past performance is not a reliable indicator of future results. Actual results may differ materially from those anticipated in forward-looking or past performance statements. We assume no liability as to the accuracy or completeness of any of the information and/or content provided herein and the Company cannot be held responsible for any omission, mistake nor for any loss or damage including without limitation to any loss of profit which may arise from reliance on any information supplied by TFA Global Pte Ltd.
The speaker(s) is neither an employee, agent nor representative of Tradu and is therefore acting independently. The opinions given are their own, constitute general market commentary, and do not constitute the opinion or advice of Tradu or any form of personal or investment advice. Tradu neither endorses nor guarantees offerings of third-party speakers, nor is Tradu responsible for the content, veracity or opinions of third-party speakers, presenters or participants.
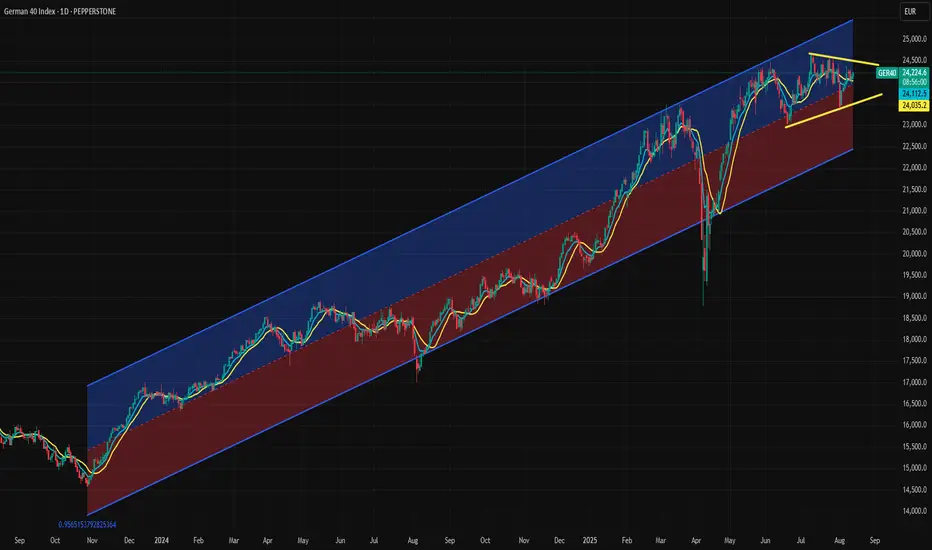
About Dax 40 CFDTime is approaching for a correction. We have clear price action support levels. According to Larry Williams' principle, I believe that the end of the correction will be around the end of September.

DE40 Breakout Robbery – Bullish Setup Revealed!💣 DE40 / GER40 INDEX BREAKOUT RAID 🚨
🌟 Hi! Hola! Ola! Bonjour! Hallo! Marhaba! 🌟
Dear Market Robbers, Money Makers, and Chart Bandits 🕶️💰💣,
We’re rollin' out our latest Thief Trader Heist Plan based on laser-sharp technical + fundamental recon 🧠💼 on the Germany DE40 / GER40 Index. It’s time to gear up and break the resistance vault 🏦💥
🎯 THE MASTER HEIST SETUP: LONG ONLY 🎯
📈 Entry Setup:
"The heist is on! Wait for breakout & retest near 24600 🔓.
Once confirmed, GO BULLISH and snatch that market loot!"
✅ Use Buy Stop above resistance
✅ (OR) Buy Limit from pullback zones using 15m–30m swing lows/highs
🎯 DCA / Layered limit entries for optimal robbery!
🔔 Set Alerts: Don't sleep on this! Mark your alarms to catch the breakout.
🛑 STOP LOSS: PLAY IT SMART, NOT EMOTIONAL
🗣️ "Don’t drop your SL before the breakout—wait for the confirmation candle. Place it smart based on your entry lot size & risk."
📍Thief SL Plan: Below the recent 4H wick swing low – around 21700
🔒 Protect the loot once you're in the trade!
🏁 TARGET: TIME TO ESCAPE THE SCENE
🎯 Primary Profit Vault: 25500
🛫 Escape earlier if signs of resistance emerge. A clean get-away is the goal!
🔪 SCALPERS MODE: ONLY LONG SIDE
💰 Got the funds? Feel free to enter early.
💼 Otherwise, team up with swing traders. Use Trailing SL to guard your treasure.
🔎 FUNDAMENTALS BACKING THIS HEIST
📊 GER40 shows bullish momentum backed by:
Global macro optimism
Strong Eurozone data
Risk-on flows into European indices
Technical chart breakout formations
📰 Get full market breakdowns (COT, Macro, Intermarket, Sentiment, etc.) – Check your trusted sources and confirm your targets.
🚨 TRADING ALERT: STAY ALERT DURING NEWS
⚠️ Big news = high volatility! Follow the robbery code:
Avoid new trades during major news drops
Trail SLs on running positions
Stay glued to live updates!
❤️ SUPPORT THE THIEF CREW
If this plan helped you, hit that BOOST 🚀
Let’s keep raiding the charts, stacking profits like pros 🏆
Join the Thief Crew, where we rob the market... not dreams.
🎭 Until the next plan… stay sneaky, stay profitable. 🐱👤💸💥

GER40 – Testing 24,300.00 Resistance ZoneGER40 has been pushing higher after reclaiming the 24,100.00 level, with price now consolidating just below the 24,300.00 resistance. Bulls are attempting to break through this zone to target the 24,652.29 high.
Support at: 24,100.00 🔽 | 23,950.00 | 23,800.00 | 23,400.00
Resistance at: 24,300.00 🔼 | 24,652.29 (ATH)
🔎 Bias:
🔼 Bullish: A breakout and close above 24,300.00 could trigger a rally toward the ATH at 24,652.29.
🔽 Bearish: Rejection at 24,300.00 with a drop below 24,100.00 may send price back toward 23,950.00.
📛 Disclaimer: This is not financial advice. Trade at your own risk.

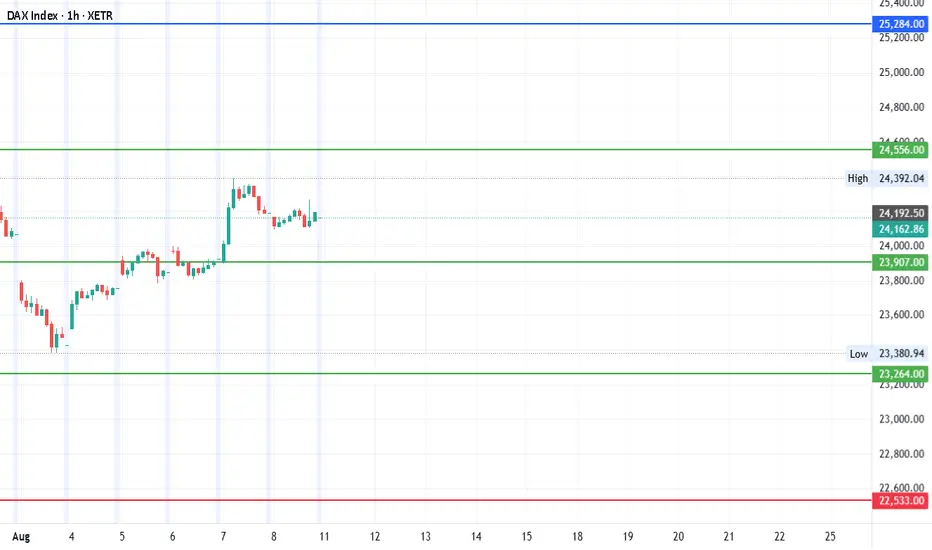
#DAX - AUG Quarterly Levels : 3000 Pts SwingDate: 09-08-2025
#DAX - We are here for the interesting moments of the historical period where the trade tariff wars are at it's peak. The markets are not moving based on any fundamentals rather it's on the fear and sentiments factor. At this point, 3000 points swing will not be surprising!
The pivot levels posted in the previous chart remain intact and new these levels add as an extra support and resistance levels along with the new big targets.
#DAX Current Price: 24162.86
#DAX Pivot Point: 23907 Support: 23264 Resistance: 24556
#DAX Upside Targets:
🎯Target 1: 25284
🎯Target 2: 26012
🎯Target 3: 26801
🎯Target 4: 27591
#DAX Downside Targets:
🎯Target 1: 22533
🎯Target 2: 21802
🎯Target 3: 21013
🎯Target 4: 20224
#TradingView #Nifty #BankNifty #DJI #NDQ #SENSEX #DAX #USOIL #GOLD #SILVER
#BHEL #HUDCO #LT #LTF #ABB #DIXON #SIEMENS #BALKRISIND #MRF #DIVISLAB
#MARUTI #HAL #SHREECEM #JSWSTEEL #MPHASIS #NATIONALUM #BALRAMCHIN #TRIVENI
#USDINR #EURUSD #USDJPY #NIFTY_MID_SELECT #CNXFINANCE
#SOLANA #ETHEREUM #BTCUSD #MATICUSDT #XRPUSDT
#Crypto #Bitcoin #BTC #CryptoTA #TradingView #PivotPoints #SupportResistance

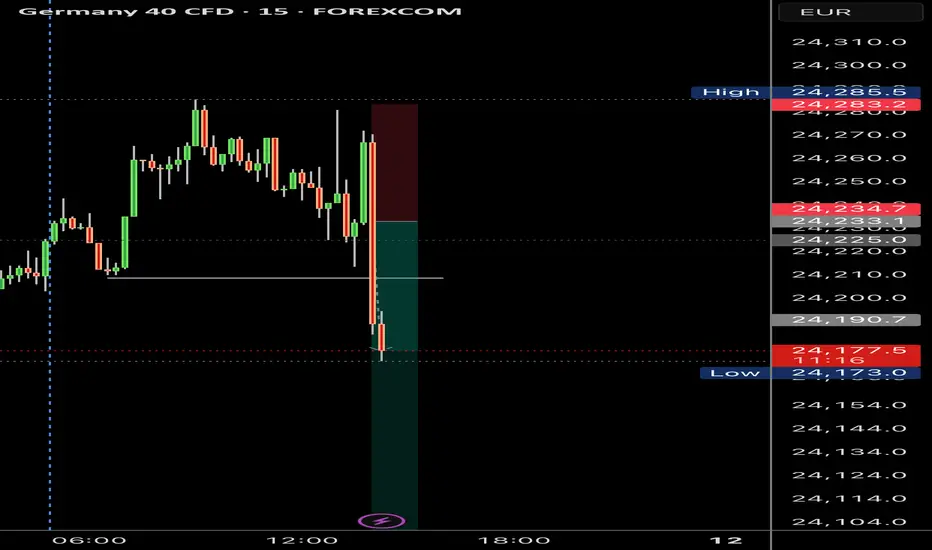
SELL GER30 FOR WIFE BIRTHDAYI am already in the sell, will be entering more entries on neckline of triangle. I need to take my wife out tomorrow and I am betting on this tade. I will close the trade at 22:45 exactly before market closes.
Analysis:
1. Daily bearish
2. 4 hr brearish
3. Entered the early position on 1 min timeframe
