USNAS100 Price Update Clean Clear ExplanationUS100 on the 1-hour timeframe, highlighting a shift in market structure from bullish to bearish Price was previously moving within an ascending channel, respecting higher highs and higher low a strong bearish breakdown occurred, with price decisively breaking below the rising trendline, indicating a
Nasdaq-100: Lower Low and Lower High?The Nasdaq-100 made a lower low, and now it might have made a lower high.
The first pattern on today’s chart is the November 21 low of 23,854, some 353 points below the October trough. That broke a series of higher lows since April.
Second, the tech-heavy index peaked at 25,835 on December 10. Tha

NAS100 Looking to continue HigherPrice is trading within a broader bullish environment. Notice where price is sitting now. Right above support, right above the rising trendline.
After the recent push up, price pulled back into the zone that aligns perfectly with the Golden pocket on the Fibonacci retracement. This level can act as

Nasdaq: To bleed or not to bleed?
STRUCTURE CONTEXT:
Strength Context: Sellers Dominating
RSI Divergence: Present
Control Variant: Sellers Have Full Control
EMA Confluence: 400EMA Reversion
Balance Context: Bearish
Psychology Levels: $24,000 and $25,000
STRUCTURE ANALYSIS:
For the last 10 months we have seen a constant rise in


US100: Will Keep Falling! Here is Why:
The charts are full of distraction, disturbance and are a graveyard of fear and greed which shall not cloud our judgement on the current state of affairs in the US100 pair price action which suggests a high likelihood of a coming move down.
Disclosure: I am part of Trade Nation's Influencer progr

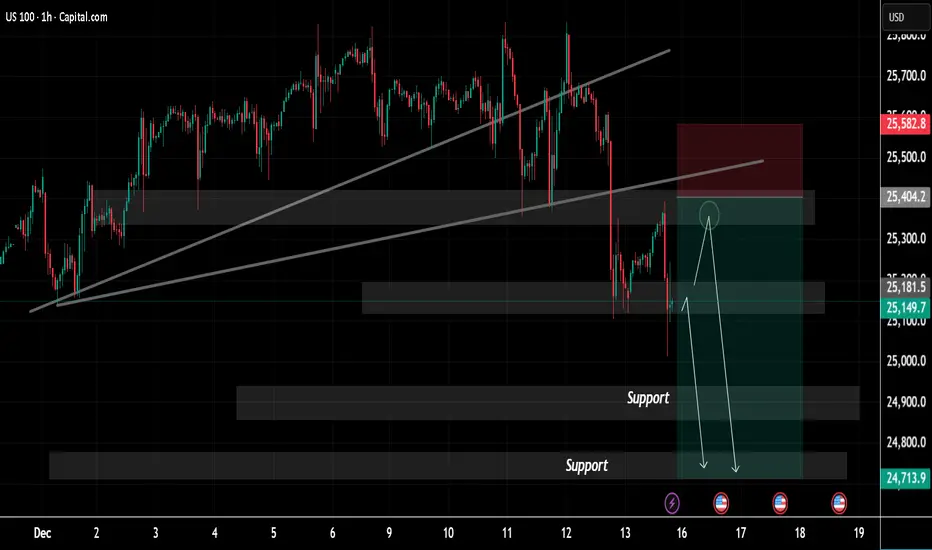
NAS100 SELLSIDE OPPORTUNITY @25,150We just captured over 420 points on NAS100. We are now testing previous structure. looking to take the sellside trade as long as we stay below these highs

USNAS100 Price Update – Clean & Clear ExplanationUS100 index on the 4-hour timeframe, focusing on a trend reversal and bullish continuation setup the market was previously in a downtrend, clearly visible by the descending trendline connecting lower highs Price respected this trendline multiple times, confirming strong bearish pressure in earlier s

US100 Bullish Breakout! Buy!
Hello,Traders!
US100 delivers a clean bullish break and close above the key horizontal supply, confirming breakout acceptance and displacement. Market structure flips bullish as prior supply turns into support, with liquidity resting above equal highs. Continuation toward premium targets is favor


See all ideas
Displays a symbol's value movements over previous years to identify recurring trends.