Nasdaq - The most important structure!💰Nasdaq ( TVC:NDQ ) perfectly respects structure:
🔎Analysis summary:
Over the course of the past couple of months, the Nasdaq has been rallying an expected +50%. Still, until the Nasdaq will retest the upper channel resistance trendline, this rally won't be over. Therefore, we can still see a rally of another +10% in the very near future.
📝Levels to watch:
$25,000 and $30,000
SwingTraderPhil
SwingTrading.Simplified. | Investing.Simplified. | #LONGTERMVISION
Trade ideas

US100: Nasdaq Faces Selling Pressure Below 25,200US100: Nasdaq Faces Selling Pressure Below 25,200
US100 faced strong resistance around the 25,190–25,200 zone, where price was rejected again after a sharp bullish move. This area continues to act as a major supply zone, limiting further upside potential for now.
If the bearish momentum continues, the index could correct lower toward the 24,840 level as the first target. A deeper pullback could extend to 24,610, and eventually toward the 24,350 support zone.
A clean break above this resistance would invalidate the bearish outlook and open the way for new highs.
You may find more details in the chart!
Thank you and Good Luck!
❤️PS: Please support with a like or comment if you find this analysis useful for your trading day❤️

Will the second scenario come true? |October 17 2025Based on the evidence, price action, and fundamental news, it seems the second scenario is about to play out.
The Nasdaq index turned positive after recovering its losses when Trump responded “No” to a question about whether he would maintain the heavy tariffs on China.
From today, my outlook is bullish until the previous high gets hunted — after that, I’ll reassess whether we’re likely to see further downside or if the bullish outlook should remain.
If market conditions shift and a continuation of the downtrend becomes more likely, we can take a solid short position next week to catch the move.
But for now, my bias is bullish, and the second scenario will likely play out.
If price reaches the second high I marked in blue, we’ll probably see a reaction from that zone.
If I open a trade, I’ll share it with you.

US100 Breaks Out as Trade Optimism and Fed Expectations Fuel MomUS100 Breaks Out as Trade Optimism and Fed Expectations Fuel Momentum
Over the weekend, US President Donald Trump said that the US and China will reach a deal.
US President Donald Trump said that the US and China are ready to "reach" a trade deal, as he is expected to meet with Chinese President Xi Jinping later this week in South Korea during his Asia tour.
This decision gave the market a breather and increased optimism about an improvement in business sentiment. The indices came out of consolidation to create new record highs.
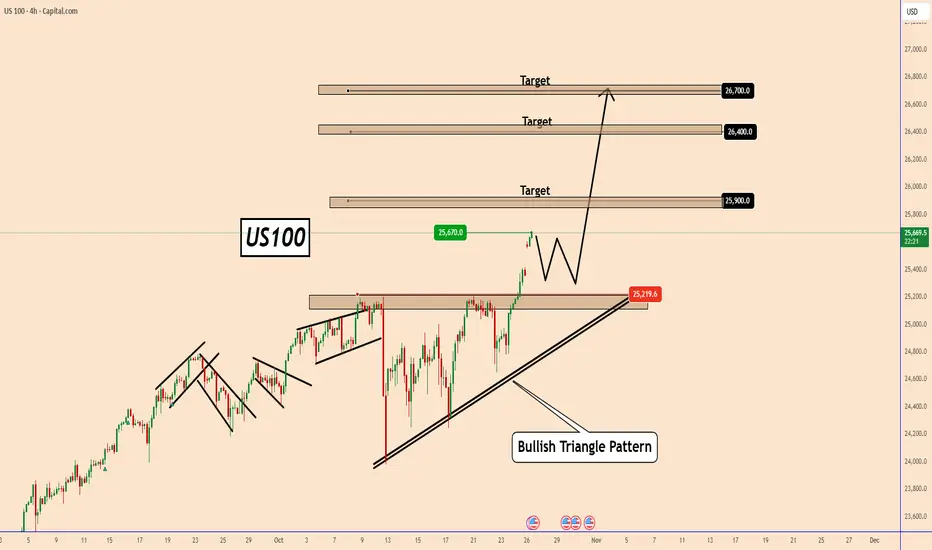
US100 has already reached 25670 and looks set to rise further as shown in the chart with targets:
25900; 26400 and 26700
This week, the FED is also expected to cut rates by 25 basis points to 4% from 4.25%.
These expectations should help indices to rise further
US100 may test 25300 again before moving further. So, take note of this.
However, so far, US100 remains strong, and this momentum could continue to grow further.
You may find more details in the chart!
Thank you and Good Luck!
❤️PS: Please support with a like or comment if you find this analysis useful for your trading day❤️
NAS100 1H: Bulls vs Bears at the Line📊 NAS100 – 1 Hour Analysis
Hello friends,
Here’s my NAS100 analysis for you.
Looking at the 1-hour chart, I want to highlight a critical level.
👉 If NAS100 breaks above 25,038 and closes a candle there, the next move could point higher.
👉 If NAS100 fails to break 25,038, then a pullback toward 24,267 may come into play.
🙏 Every like is my biggest motivation to keep sharing these analyses.
Thanks to everyone supporting me!

USNASDEQ100 currently showing bearish momentumThe US NASDAQ 100 is currently showing bearish momentum after recent downside consolidation. The index remains under selling pressure following disappointing earnings reports particularly from Netflix — which dampened risk sentiment.
Additionally, reports suggesting that the Trump administration is considering new export restrictions on China involving U.S. software have further weighed on market confidence may price test the Around 25,000, where reactions could occur. If selling pressure continues, the next major support could be near 24,500.
You may find more details in the chart.
Trade wisely best of Luck Buddies.
Ps; Support with like and comments for better analysis Thanks for Suppooritng.

Lower CPI Data – But Don’t Be Fooled by “Good” Inflation Numbers
Summary:
Markets cheered on lower CPI data, but the optimism might be misplaced. A softer inflation print gives the FED more flexibility, yet it also reduces the urgency for two rate cuts this year — something traders had already priced in.
Logic:
CPI came in weaker → short-term bullish sentiment.
But the real driver of rates is not CPI alone — it’s the balance between inflation and growth.
With inflation easing and economic activity still stable, the FED doesn’t need to cut twice in 2025.
Futures market (CME FedWatch) was pricing two cuts, which means that optimism is already priced into NASDAQ valuations.
Scenario Outlook:
If CPI remains stable and growth holds → only one cut or delay, not two.
That means tech valuations might need to reprice lower, especially high beta names.
NASDAQ could revisit support around 17,000–17,200 before finding balance again.
Trading View:
Watch for rejection near 18,000–18,200 (overextension after CPI rally).
Short-term bias: bearish / correction mode.
Long-term bias: still bullish, but needs valuation reset.
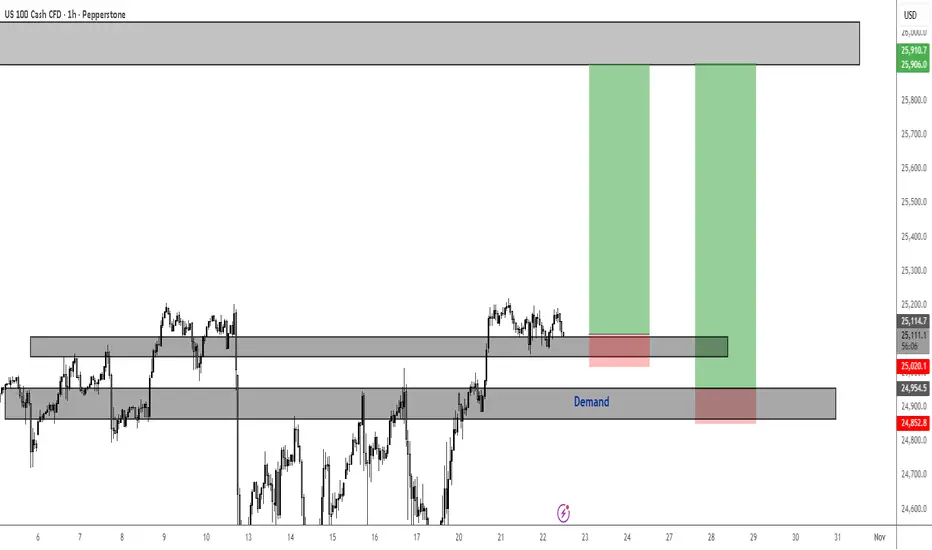
NAS100 Bullish Trend ContinuationOne of two things will happen for Nasdaq today; we will either get our entries for longs in the current support zone or in demand. The latter seems higher probability.
But either way, the uptrend will resume as price continues to claim new All Time Highs.
If the current support continues to hold throughout NYSE, then perhaps wait for resistance to break and some follow-through to get higher probability entries.
Nasdaq Faces Bearish Correction Below 25,180 After Recent HighsUSNAS100 | Overview
The Nasdaq is showing signs of bearish correction after stabilizing below 25,180, suggesting a potential pullback toward 25,035.
A 1H close below 25,035 would confirm further downside toward 24,960 → 24,860.
On the other hand, stability above 25,035 would support renewed bullish momentum, especially if price breaks 25,230, opening the way toward 25,400 and potentially 25,550.
Pivot Line: 25,180
Support: 25,035 · 24,960 · 24,860
Resistance: 25,300 · 25,400 · 25,550

NASDAQ Watching 24,975 for Fresh Bounce in Ongoing UptrendHey Traders,
In tomorrow’s trading session, we are monitoring NAS100 for a buying opportunity around the 24,975 zone. NASDAQ remains in a broader uptrend and is currently undergoing a healthy correction, approaching the key 24,975 support and resistance area that aligns with the ascending trend structure.
If buyers step in at this level, we could see a continuation of the bullish momentum in line with the prevailing trend.
Trade safe,
Joe

US100 STRONG BREKAOUT|LONG|
✅US100 Price has successfully broken through the key resistance and all-time-high level, confirming bullish intent. As long as the breakout holds above structure, we anticipate continuation toward the next premium zone and liquidity resting at higher highs. Time Frame 3H.
LONG🚀
✅Like and subscribe to never miss a new idea!✅

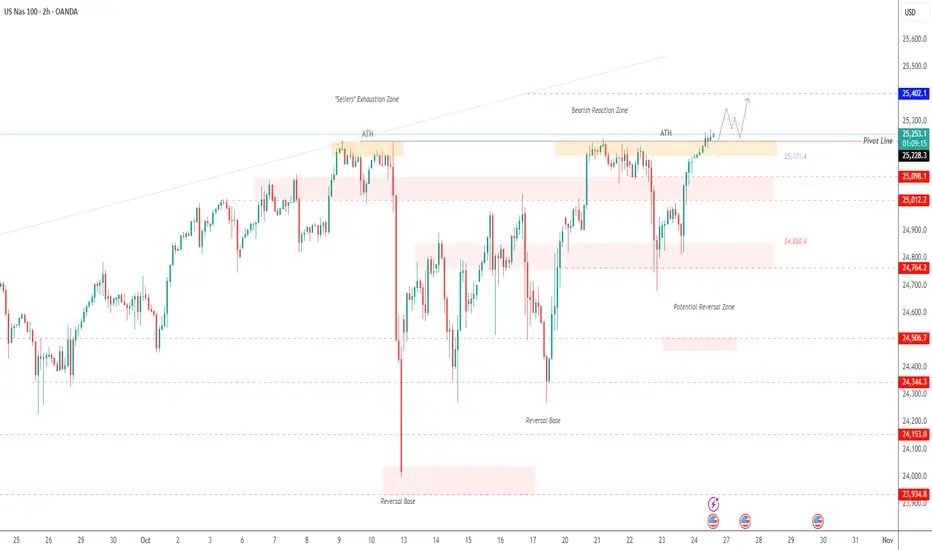
USNAS100 Extends Rally to New All-Time Highs?USNAS100 | Bullish Continuation Toward New Highs
The index recorded a new all-time high (ATH) and has already stabilized above it, supporting further bullish momentum toward 25,400 → 25,550.
The main driver behind the move remains strong corporate earnings.
However, to confirm a bearish reversal, the price must close a 1H candle below 25,170, which would expose 25,100 → 25,010.
A sustained break below those levels could extend the decline toward 24,850.
Pivot Line: 25,230
Resistance: 25,400 – 25,550
Support: 25,100 – 25,010 – 24,860
NAS 100 SHORT TRADEShort Nas100 on 15M TF. Alligator is pointing downwards with all Jaw, Teeth, Lips opened and aligned. Take 1:1 RR trade.

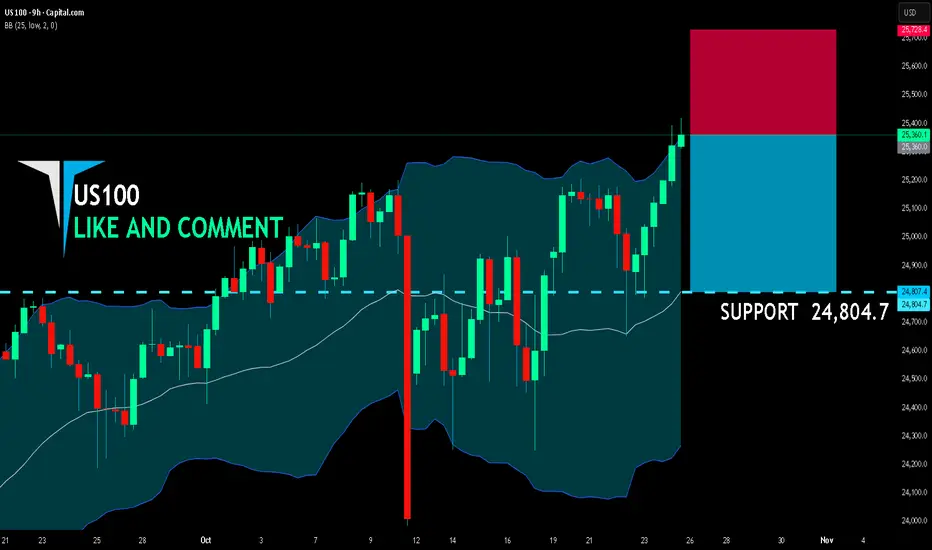
US100 SHORT FROM RESISTANCE
US100 SIGNAL
Trade Direction: short
Entry Level: 25,360.0
Target Level: 24,804.7
Stop Loss: 25,728.4
RISK PROFILE
Risk level: medium
Suggested risk: 1%
Timeframe: 9h
Disclosure: I am part of Trade Nation's Influencer program and receive a monthly fee for using their TradingView charts in my analysis.
✅LIKE AND COMMENT MY IDEAS✅
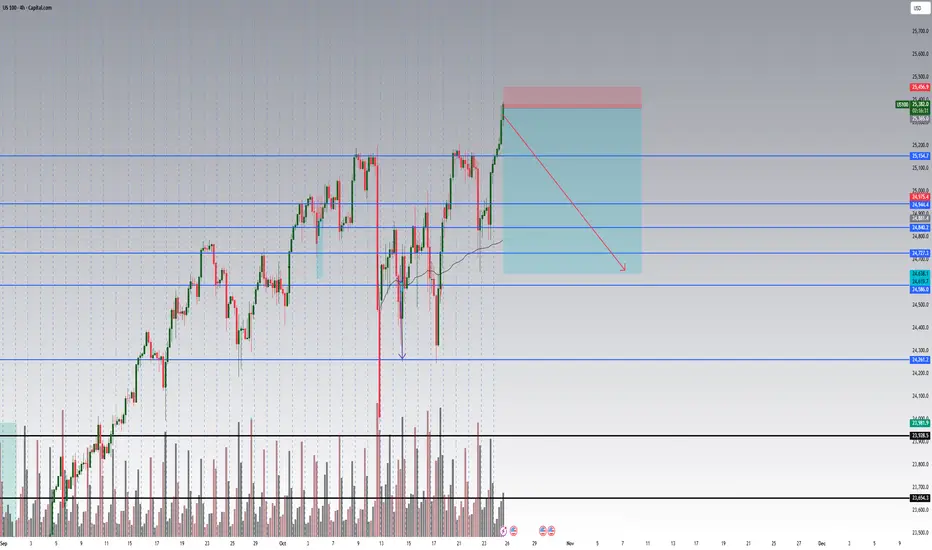
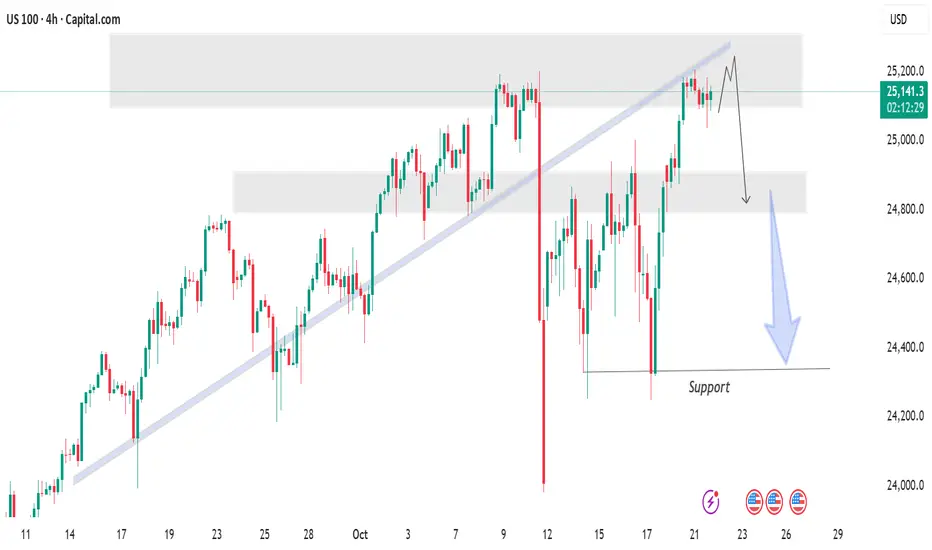
US100 ForecastUS100 highlights a potential bearish setup forming near a key resistance zone. After a strong recovery toward the 25,150–25,200 region, price action shows signs of rejection at the upper resistance area. The chart illustrates a possible pullback scenario, where the index may retest the 24,800 zone, followed by a deeper move toward the 24,400 support level.
The shaded areas mark supply (resistance) and demand (support) zones, while the trendline break suggests weakening bullish momentum. Overall, the setup signals a potential trend reversal if the price fails to hold above the resistance region.
"Thank you for your support! If you found this idea valuable or learned something new, please consider liking and leaving a comment. I’d really appreciate hearing your feedback and thoughts
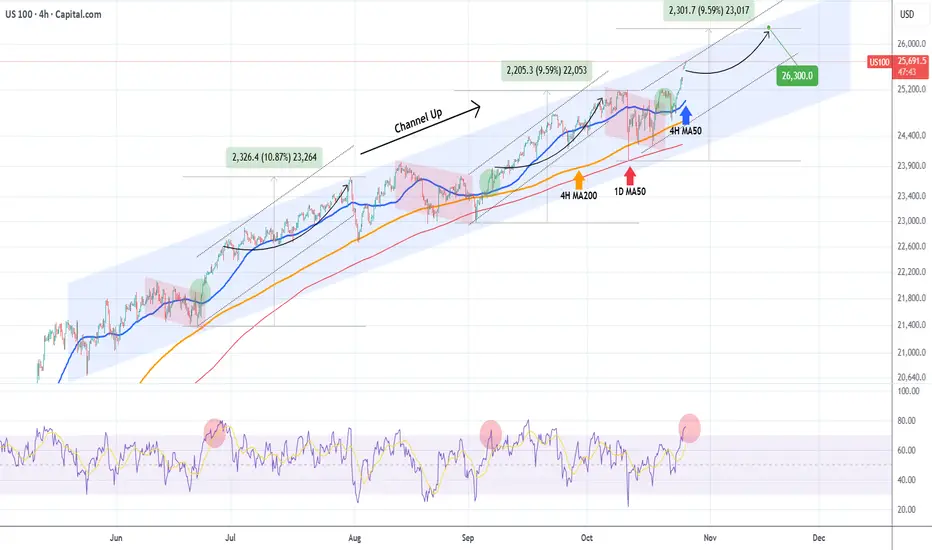
NASDAQ Needs some sideways relief but remains bullish.Nasdaq (NDX) continues to extend the new Bullish Leg of its 5-month Channel Up, having turned the 4H MA50 (blue trend-line) as its short-term Support, in line with both previous Bullish Legs.
We still expect at least a +9.59% rise, targeting 26300, to be completed before the pattern's new Higher High is priced but as the 4H RSI turned overbought (red circle), we expect the price to slow down a little, maybe seeking the 4H MA50 again as it happened in July.
In any event, the long-term trend remains bullish, until the 1D MA50 (red trend-line) breaks.
-------------------------------------------------------------------------------
** Please LIKE 👍, FOLLOW ✅, SHARE 🙌 and COMMENT ✍ if you enjoy this idea! Also share your ideas and charts in the comments section below! This is best way to keep it relevant, support us, keep the content here free and allow the idea to reach as many people as possible. **
-------------------------------------------------------------------------------
💸💸💸💸💸💸
👇 👇 👇 👇 👇 👇
NASDAQ CRASH TO OBLIVION FY25-26my bias is short term bearish from the current level finding resistance around past higher high then bullish continutaion till the 26k levels where
im expecting a reversal in price to the yellow zones the proper exit ewill be specified once the reversal points confirm and present us with a down trend what i can say is there will be breaks of sructure on the weekly timeframe
like comment follo

us100 looks long babyhi guys
uou can see us100 is moving in a chanell from long time ago
now breaks the mid line and have gap on a price
the price will come back to gap and next directly move to top of chanell
this is not trad signal
do it on your own strategy

NQ is still bullish on the HTFDespite NQ being bearish on the lower timeframes, it is very bullish on the higher timeframe. with good risk management, I would prefer siding with the buyers as per my analysis attached.

NAS100 Trade Set Up Oct 28 Price is trading above PDH and making ATH so i am bullish but first i want to see a pull back into 1h FVG or sweep internal 15m SSL before making 1m-5m IFVG/CISD to continue higher

US 100 Index – Yesterday Saw New Record Highs, What Next?Fresh optimism regarding the potential for a US-China trade deal saw the US 100 rise to a new record high of 25889 early this morning, a daily gain of 2% and an unbelievable rise of 58% from its April 6th low at 16324 when trade tensions were at their height.
Now, across the rest of this week, US 100 traders may be focused on several key events to decide the next directional moves for the index. These are, the Federal Reserve (Fed) interest rate decision, earnings from five of the Magnificent Seven corporates, and the face-to-face meeting between US President Trump and Chinese President Xi. Let’s briefly discuss each one.
On Wednesday at 1800 GMT the Fed are fully expected to cut interest rates 25bps (0.25%) when they release the outcome from their 2-day policy meeting (FOMC). What is less certain is what comes next. Markets are still pricing in a high probability of another 25bps cut at the Fed’s next meeting in December, however any indication that this may not be a sure thing could lead to a more negative outcome for the US 100. The comments made by Fed Chairman Powell in the press conference, which starts at 1830 GMT, could be crucial in this regard.
Once the Fed press conference ends on Wednesday, traders may be absorbed by the release of earnings from Alphabet, Microsoft and Meta, which are followed by the updates from Amazon and Apple after the market close on Thursday. Remember, it wasn’t that long ago that worries about an AI bubble negatively impacted the US 100, and so the focus in these results could be on AI spending, future revenue growth and costs.
The final event is the face-to-face meeting between President’s Trump and Xi which takes place in South Korea on Thursday, the first in 6 years. Current expectations are for the heads of the world’s two biggest economies to agree a series of deals on rare earth metals, soybeans, shipping levies and export controls. Whether these agreements match up to expectations could be pivotal to the direction of the US 100 into the weekend.
Technical Update: Mind The Gaps!
CFD price activity typically forms in relatively smooth patterns, rising in uptrends or falling in downtrends. While brief corrections may occur, they’re often limited in scope and duration before the prevailing trend resumes, unless a shift in sentiment triggers a directional reversal.
Occasionally, within an orderly price advance or decline, acceleration phases emerge, which can result in gaps in price activity. These gaps occur when a CFD closes one session and then opens higher in an uptrend or lower in a downtrend the next day, reflecting a surge in trader interest in the direction of the prevailing trend.
Within technical analysis, there are three types of price gaps, each offering insight into trader sentiment and directional risk. Below is a brief overview of each.
Breakaway Gap: Typically seen at the start of a new trend, this gap reflects strong trader conviction, buyers are willing to pay higher prices at the open in an uptrend, or sellers accept lower prices in a downtrend. It can often be seen to complete a reversal pattern and signals a possible shift in sentiment.
Continuation Gap: Forming within an established trend, this gap can confirm ongoing sentiment, buyers continue to pay higher prices in an uptrend, or sellers accept lower prices in a downtrend. It reinforces confidence in the prevailing move.
Exhaustion Gap: Found in mature trends, this gap reflects late-stage trader entry at already overextended levels, reflecting poor timing, as most of the move has already occurred. It may signal panic buying or selling, with positioning then heavily skewed in the direction of the prevailing trend.
When positioning becomes overly one-sided, with no buyers left in an uptrend or sellers in a downtrend, price can be most vulnerable to a sentiment reversal, often triggering corrective moves.
US 100 Index: Watching the Gaps
The eagle-eyed among you will have noticed that the charts used to illustrate gap concepts above feature the activity of the US 100 Index, which since the April 7th low, is possibly a good example of these gaps in price action.
The latest gap, formed between last Friday’s close and Monday’s open, is labelled as both a possible continuation and exhaustion gap, as it’s unclear at present what this move currently represents. It could signal a continuation of the uptrend from the April lows, or mark an exhaustion point, raising the risk of a sentiment reversal.
Monitoring future price action may help determine whether the latest gap reflects continuation of the uptrend or signals exhaustion, suggesting the risk of price weakness.
If Latest Activity Proves to be a Continuation Gap
If the gap from Friday’s 25374 close is a continuation gap, it could signal a further phase of price strength. This would imply that if price action holds above 23474, upside momentum may still be evident.
If the US 100 Index holds above support at 25374 it may then go on to challenge the next resistance at 25937, which is the 61.8% Fibonacci extension. A break above this level might even open the path toward 26393, which is the 100% extension.
If Latest Activity Proves to be an Exhaustion Gap
If the latest gap activity reflects exhaustion, with positioning skewed too far to the long side, it may lead to a phase of price weakness following the recent advance. A closing break below 25374 could build on these themes and even suggest possibilities of a more extended phase of price weakness.
A move below 25374 could signal fading buying support, suggesting a shift toward lower levels. If evident, downside risks may extend to 25079, which is the 38.2% Fibonacci retracement, potentially even toward 24668, a level marking the 61.8% retracement.
The material provided here has not been prepared accordance with legal requirements designed to promote the independence of investment research and as such is considered to be a marketing communication. Whilst it is not subject to any prohibition on dealing ahead of the dissemination of investment research, we will not seek to take any advantage before providing it to our clients.
Pepperstone doesn’t represent that the material provided here is accurate, current or complete, and therefore shouldn’t be relied upon as such. The information, whether from a third party or not, isn’t to be considered as a recommendation; or an offer to buy or sell; or the solicitation of an offer to buy or sell any security, financial product or instrument; or to participate in any particular trading strategy. It does not take into account readers’ financial situation or investment objectives. We advise any readers of this content to seek their own advice. Without the approval of Pepperstone, reproduction or redistribution of this information isn’t permitted.

$NDX Make or BreakNDX is consolidating in a triangle, and is now re-test 25200 strong level.
Inability to break above the triangle should see a break below the triangle and a move down to 24700 first.

NAS100 ShortElite analysis
Price reacted off asian high liquidation, reversal seen in the 1m tf
Targets, lower liquidity pools
