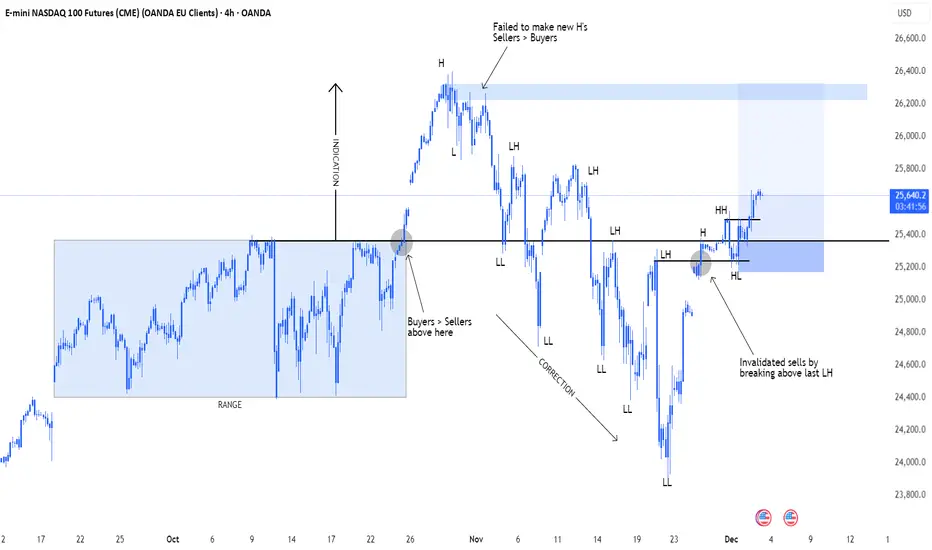
NAS100 LONG setupNas has been ranging for over a month back in Sep-Oct, buyers won the battle and pushed price to 26,3k.
Sellers kicked in again and price corrected for another month.
Recently price has broken back above the level and from here I'm looking for buys, as long as it keep making HHs and HL's during the next couple of weeks, during next New York sessions.
Trade ideas
Nasdaq — Current Setup & What Could Happen Next📈 Nasdaq — Current Setup & What Could Happen Next
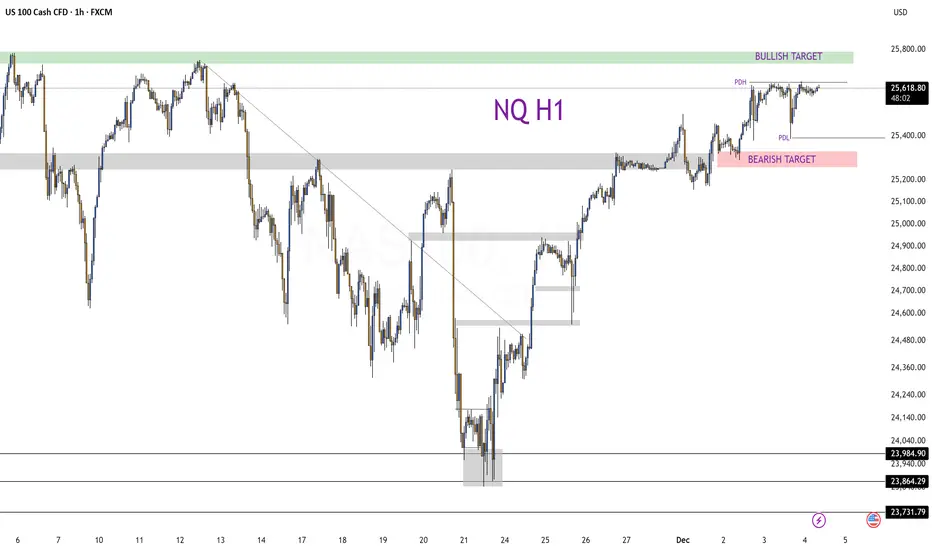
🔹 Technical Setup
Nasdaq has been accumulating between 25,600–25,650 since Tuesday, marking a clear base where buyers stepped in.
I’m watching for a break to the upside with pullback entries, aiming to complete the fractal toward 25,770, a level with previous supply/resistance.
Yesterday’s -1% drop after negative news from Microsoft was gradually erased by steady buying — a sign that underlying demand remains resilient.
The accumulation and rebound off that base may signal a renewed bullish leg, provided we see clean technical confirmation.
🌎 Fundamental & Market Context
Rate-cut hopes are returning: Traders are increasingly betting on a potential cut by the Federal Reserve next month, which tends to support growth and tech sectors.
That expectation has helped lift sentiment across U.S. equities, including the Nasdaq.
On the flip side, rising Treasury yields and macroeconomic uncertainty remain a risk; any hawkish Fed hints or weak corporate earnings could challenge the bullish view.
🎯 Trading Scenarios
➡️ Bullish:
Break of accumulation zone → long entries on pullback → target 25,770.
⚠️ Bearish / Cautious:
Failure to break up, or a sharp reversal → fallback toward lower liquidity zones/Potential PDL.
TVC:DXY SP:SPX CAPITALCOM:US100
Sell Nass100Price rejected strongly from the upper supply zone and slipped back below it. As long as price stays under that zone, bears stay in control. I’m expecting a deeper correction toward the demand zone around 24 690 – 24 700.
Bias: Bearish
Entry Zone: Below the broken supply
Target: 24 700
Invalidation: Break and hold above the supply zone

NAS100How to become successful in forex and stock trading: 1.Master fundamentals and technical analysis. 2,Build and follow a solid trading plan. 3.Apply strict risk management (1–2% rule). 4.Stay disciplined—control fear and greed. 5.Record and analyze every trade. 6.Focus on high-quality setups only. 7.Diversify across assets and markets. 8.Keep evolving—study, adapt, and grow daily.

NASDAQ (US Tech 100) Price swept liquidity below a weak low, tapped into demand, and printed a bullish CHoCH, suggesting buyers are stepping in.
🟢 BUY Bias
Price is reacting from a discount zone + demand after a liquidity sweep. As long as we stay above the demand area, bullish targets remain valid.
🎯 Targets
TP1: 25,300
TP2: 25,600
TP3: 25,700+ (Liquidity at Strong High)
🔐 Stop-Loss: below 24,080 (beneath demand & sweep)

Nasdaq : 24,000 Holds Strong — Next Stop 25,800?Price action on the Nasdaq 100 is telling a clear story: 24,000 (AVWAP + HVN confluence + Round number) is acting like a magnet for institutional buyers.
This suggests that accumulation is happening at these levels, positioning for a potential run toward 25,800 if momentum holds.
Are we front-running a breakout, or should we wait for confirmation above 25,000 first?

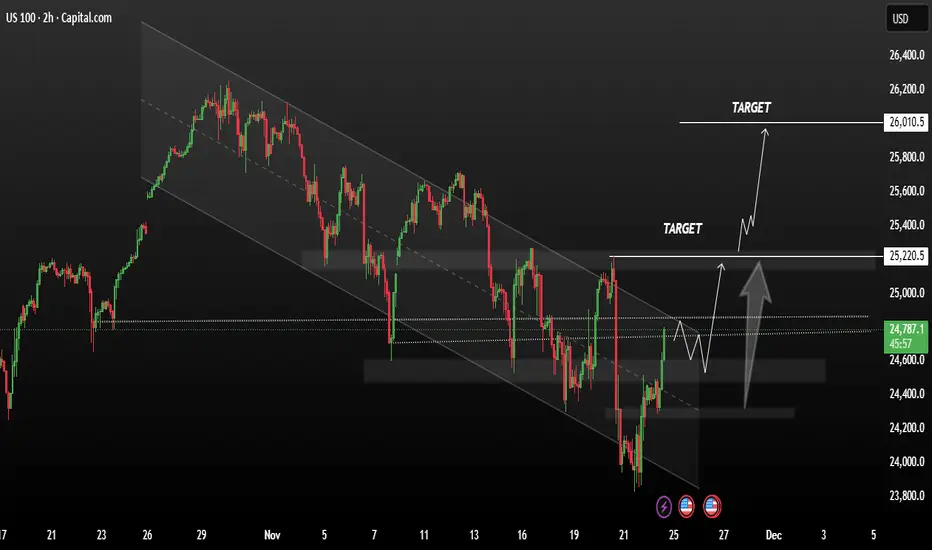
USNAS100 maintains current bullish momentumUSNAS100 moved higher on Monday, driven by gains in mega-cap stocks. Growing expectations of a potential Federal Reserve rate cut in December supported bullish sentiment, while investors monitored fresh economic data for signals on the central bank’s next policy direction.
If the index maintains its current bullish momentum, the market structure suggests a potential continuation to the upside. In the short term, we could see price movement toward the resistance zone between 25,220 and 26,010, where bullish reactions may occur if buyers remain in control.
You may find more details in the chart,
Trade wisely best of Luck Buddies,
Ps; Support with like and comments for better analysis Thanks for Supporting.

NOV.30,2025 ANALYSIS ON SPX500 & NAS100 INDICES The monthly charts have printed hanging man candles and hence if the closing of next month candle is below the body of the candle, it will confirm that the rally is over and the next months have a bearish setup. Indicators also support the rally is over based on the weekly and daily charts on both indices.
The weekly candle looks bullish but since the volume is low it does not confirm the rally and is a market maker manipulation setup for retail traders. For shorts bias use tight stop loss, price should not exceed the invalidation levels noted in the video.
The daily charts also show a hidden bearish divergence on MACD Histogram bars, Stochastic cycle & Momentum at fib resistance of 0.786 retrace and Oct, 2023 fib extension of 1) for the SPX500 and fib 0.618 retrace for the NAS100. Daily Stoch cycles support shorts more than long. Price uprise since Wed, Nov 26th, has been on declining momentum, see MACD histogram on 4H. RSI is overbought on 4H with a hidden bearish divergence too.
So, I see more bearish signal on the indices than bullish continuation.
Thank you again for supporting my publications and consider giving my publication a boost and comment with your own insights too. Iron sharpens Iron, let conquer the market together. Cheers !!

NAS100 Trade Opportunity: Will Buyers Defend the Pullback?📊 NAS100 (NASDAQ-100) Swing Trade Opportunity 🚀
Bullish Pullback Setup | Super Trend ATR + TMA Confirmation
🎯 TRADE SETUP OVERVIEW
Instrument: NAS100 (NASDAQ-100 Index)
Timeframe: Swing Trade (4H-Daily)
Bias: BULLISH ✅
Setup Type: Super Trend ATR Line Pullback + Triangular Moving Average (TMA) Confirmation
🎬 ENTRY STRATEGY - "LAYERING METHOD" 📍
This strategy employs multiple limit order placement (Layer Entry Technique) to optimize entry points during the pullback phase.
Recommended Layer Entry Points:
🔵 Layer 1: 24,500
🔵 Layer 2: 24,600
🔵 Layer 3: 24,700
🔵 Layer 4: 24,800
⚡ Pro Tip: Scale layers based on your account size and risk tolerance. Each layer reduces average entry price.
🛑 STOP LOSS (SL)
Primary SL Level: 24,300
Strategy: Placed below the latest swing low + Super Trend confirmation
⚠️ DISCLAIMER: This SL is a guideline only. You must adjust based on your personal risk management strategy and account equity. Risk is YOUR responsibility.
🎁 PROFIT TARGETS (TP)
PRIMARY TARGET (TP1): 25,700 🎯
First resistance zone
Ideal for taking partial profits
Recommended exit: 30-50% position
SECONDARY TARGET (TP2): 26,200 🔥
Strong resistance + Historical overbought zone
⚠️ TRAP ALERT: Expect potential reversal or consolidation
Recommended exit: Remaining 50-70% position
Use trailing stop for final portion
📈 TECHNICAL CONFIRMATION
✅ Super Trend ATR: Aligned bullish
✅ TMA (Triangular MA): Pullback to key level confirmed
✅ Higher Lows Pattern: Intact
✅ Volume Analysis: Supporting move
🔗 RELATED PAIRS TO WATCH 💡
Positive Correlation (Move Together):
🔴 SPY (S&P 500 ETF) - $380-395 Range
Correlation: +0.92 | Often leads NAS100 lower-cap stocks
Key Point: If SPY breaks $390, expect NAS100 momentum confirmation
Watch for divergence signals
🔴 QQQ (Invesco QQQ Trust - Nasdaq 100 ETF) - $450-470 Range
Correlation: +0.99 | DIRECT tracking of NAS100
Key Point: Primary barometer for Nasdaq sentiment
Use for volume + volatility confirmation
🔴 TECH Sector ETF (XLK) - $205-215 Range
Correlation: +0.88 | Tech-heavy holdings overlap
Key Point: Tech rotation affects Nasdaq flow
Monitor for sector strength/weakness
Inverse Correlation (Move Opposite):
🔵 DXY (US Dollar Index) - $103-106 Range
Correlation: -0.65 | Stronger dollar = Risk-off mood
Key Point: If DXY spikes, expect NAS100 pullback extension
Monitor Fed rate expectations
🔵 TLT (20+ Year Treasury ETF) - $75-80 Range
Correlation: -0.58 | Rising yields hurt growth stocks
Key Point: Check 10Y yield trend for rate pressure
Watch Fed policy announcements
Key Monitoring Points:
📌 Earnings Season Impact: Tech earnings can create ±2% moves
📌 Fed Minutes/Announcements: Watch for rate guidance changes
📌 Market Breadth: Compare Advance/Decline lines for confirmation
📌 Volatility Index (VIX): Levels above 20 = Caution; Below 15 = Risk-on
📋 BEFORE YOU TRADE - CHECKLIST ✅
Is price currently at/near Layer 1 entry (24,500)?
Does current 4H chart show TMA pullback + Super Trend confluence?
Is volume confirming the setup?
Have you set your SL below 24,300?
Do you understand you're risking X to make Y?
Is this aligned with your trading plan?
🎓 FINAL NOTES
This is a mechanical swing trade setup designed for traders who use limit orders and layering technique. The confluence of Super Trend ATR + TMA creates higher probability entries during bullish pullbacks.
Remember: Trading involves substantial risk of loss. This idea is shared for educational analysis. Your trading decisions are YOUR responsibility alone.
Happy Trading! 🚀💎

Will NAS100 Sustain Its Bullish Momentum After the Pullback?NAS100 🚀 Bullish Swing Setup | SuperTrend Pullback & Layered Entry Strategy
🎯 TRADE IDEA: NAS100 (US100) BULLISH SWING
Capitalize on a structured pullback in the NASDAQ 100! This plan leverages a proven indicator confluence for a high-probability long opportunity.
📊 ANALYSIS & CONFIRMATION:
Trend: Primary Bullish Trend is intact. ✅
Trigger: Price is pulling back into a demand zone, offering a favorable risk-to-reward entry.
Indicator: The SuperTrend ATR Line is acting as dynamic support on the 4H/Daily timeframe. A bounce from this level confirms our bullish bias.
⚡ STRATEGY: "THE THIEF" LAYERED ENTRY
This method uses multiple limit orders to average into a position, perfect for volatile markets like the NASDAQ.
Entry Zone: Look for entries between 25,200 - 25,600
Layer Example:
🟢 Limit Order 1: 25,600
🟢 Limit Order 2: 25,400
🟢 Limit Order 3: 25,200
👉 You can adjust the number of layers and prices based on your capital and risk appetite.
❗ RISK MANAGEMENT:
Stop Loss (SL): A decisive break below 24,800 would invalidate the bullish structure.
⚠️ IMPORTANT NOTE: This is MY protective stop. Dear Thief OG's 👑, you MUST adjust your position size and SL based on your personal risk management strategy. Protect your capital first!
🎯 PROFIT TARGETS:
Primary Target: 25,600 (Initial resistance & profit-taking zone).
Key Reasoning: We anticipate a reaction here due to:
Moving Average resistance.
Potential overbought conditions on lower timeframes.
A "trap" for late buyers.
👉 Smart Move: Consider taking partial profits at 25,600 and trailing your stop for the remainder. Escape the trap with your profits! 💰
⚠️ REMINDER: Dear Thief OG's 👑, your Take Profit (TP) is your own decision. Secure gains based on your trading plan and market behavior.
🔍 RELATED ASSETS & MARKET CORRELATION:
Watching these related instruments can provide confirmation and a broader market view.
TVC:DXY (U.S. Dollar Index): 🟡 NEGATIVE CORRELATION
A weakening Dollar ( TVC:DXY DOWN) is generally bullish for Nasdaq. If the Dollar is falling, it adds confidence to this long thesis.
USTECH (CFD on Nasdaq 100): 🟢 DIRECT CORRELATION
Moves in sync with NAS100. Perfect for cross-verifying price action and volume.
NASDAQ:AAPL , NASDAQ:MSFT , NASDAQ:TSLA (Mega-Caps): 🟢 HIGH IMPACT
These heavily weighted Nasdaq components drive the index. Bullish momentum in these stocks supports a rising NAS100.
FOREXCOM:SPX500 (S&P 500): 🟢 POSITIVE CORRELATION
A strong S&P 500 often lifts the Nasdaq. Monitor for overall U.S. market strength.
💬 Let me know your thoughts in the comments!
What's your entry strategy for the NAS100 this week?
#NAS100 #US100 #TradingView #SwingTrading #Bullish #SuperTrend #TradingStrategy #IndexTrading #LayeredEntry #ThiefStrategy

NAS100 Bullish Setup on 1hrNAS100 Bullish Setup on 1hr
Bullish Setup presented on 1hr
- Bullish divergence
- 1hr FVG created in this crazy sell off
- 1hr unfinished candle at my TP level
Entry: 24160
TP: 25000
SL: 23980
RR: 1:5.71

NAS100 | Bullish Bounce Off Pullback SupportMomentum: Bullish
Price is currently above the ichimoku cloud.
Buy entry: 25,308.70
- Pullback support
- 23.6% Fib retracement
Stop Loss: 25,092.80
- Multi-swing low support
Take Profit: 25,553.90
- Swing high resistance
- 127.2% Fib extension
High Risk Investment Warning
Stratos Markets Limited (tradu.com/uk ), Stratos Europe Ltd (tradu.com/eu ):
CFDs are complex instruments and come with a high risk of losing money rapidly due to leverage. 70% of retail investor accounts lose money when trading CFDs with this provider. You should consider whether you understand how CFDs work and whether you can afford to take the high risk of losing your money.
Stratos Global LLC (tradu.com/en ): Losses can exceed deposits.
Please be advised that the information presented on TradingView is provided to Tradu (‘Company’, ‘we’) by a third-party provider (‘TFA Global Pte Ltd’). Please be reminded that you are solely responsible for the trading decisions on your account. Any information and/or content is intended entirely for research, educational and informational purposes only and does not constitute investment or consultation advice or investment strategy. The information is not tailored to the investment needs of any specific person and therefore does not involve a consideration of any of the investment objectives, financial situation or needs of any viewer that may receive it. Past performance is not a reliable indicator of future results. Actual results may differ materially from those anticipated in forward-looking or past performance statements. We assume no liability as to the accuracy or completeness of any of the information and/or content provided herein and the Company cannot be held responsible for any omission, mistake nor for any loss or damage including without limitation to any loss of profit which may arise from reliance on any information supplied by TFA Global Pte Ltd.

USNAS100 📉 The US100 chart shows a strong bullish structure forming after price successfully broke above a long-term descending trendline that had been acting as resistance for several weeks. This breakout indicates a potential shift in market momentum from bearish to bullish. After the breakout, price retested the same zone, confirming it as new support, which strengthens the reliability of the bullish setup.
✅ We can also see two major demand zones marked on the chart. These zones have repeatedly pushed price upward in the past, showing strong buying pressure. The market respected the latest demand zone once again, creating a solid base for the current upside move. With buyers stepping in and defending this level, a continuation to the upside becomes more likely.
✅ Following the retest of the broken trendline and the demand area, the price has started forming higher highs and higher lows—an early sign of trend reversal. This bullish structure aligns perfectly with the upward projection shown on the chart. The first target is placed around 25,700, where previous minor resistance lies. If price manages to break this level with momentum, the rally could extend toward the second target near 26,000+, which is a stronger resistance area and a psychological level where traders often take profits.
✅ The stop-loss region is positioned below the retest zone to protect the trade in case price fails to hold above the new support. This ensures a balanced risk-to-reward setup while maintaining market structure integrity.
✅ Overall, the market setup suggests a well-defined bullish opportunity supported by trendline breakout, successful retest, strong demand zones, and improving price structure. As long as price stays above the retest level, buyers may continue to push toward the highlighted targets.
If you find it helpful please like and comments for this post and share thanks.

USNAS100: 24760–24880 Range Controlling the MarketUSNAS100 | Technical Overview
U.S. stock index futures slipped slightly on Tuesday, cooling after a strong tech-led rally in the previous session.
Investors remain cautious as they await upcoming economic data and earnings releases that will offer clearer signals on the strength of U.S. consumer spending and overall market resilience.
Technical Outlook
The Nasdaq is currently consolidating between 24760 and 24880, awaiting a decisive breakout.
Bearish Scenario:
A 1H close below 24760 will activate a bearish leg toward 24575, and a break below that level opens the way toward 24365 and potentially 24150.
Bullish Scenario:
A 1H close above 24910 will confirm bullish continuation toward 25210, with further upside potential toward 25420.
Pivot Line: 24760
Support: 24575 · 24365 · 24150
Resistance: 25210 · 25420


Nas Perspective Based on how Nasdaq is playing around withing the 30- and 15-minutes range it gives a strong signal of an upcoming strong expansion. with this idea it is much safer to trade it once it breaks out of the accumulation range. Alot of factors are playing part and will contribute to the expansion of price, expected the beginning of DECEMBER 2025 . Trading wise, I would be marking my ranges off one 15 minute candle or off 5 minutes ranges, mostly targeting Longs.

Buys or Sells1)Bullish Trend
2)Break of Structure
3)Above 50Moving Average.
I see a bullish start of the week for most markets, but very well could go to the downside to continue a very uncharacteristic 4th quarter. I believe fundamentals will play a huge part in trading decisions through the holiday season for most traders. I'm thinking about not trading at all the market is looking choppy.

NAS100 Trade Set Up Nov 26 2025Price remains in a bullish trend so as long as it stays closed above 1h swing low/London low i will look for internal SSL sweep to then target buys to higher BSL

Has the Nasdaq’s Downtrend Ended?Recently, U.S. indices witnessed declines exceeding 5%, driven by reduced expectations of an interest rate cut in the Federal Reserve’s December meeting, the key catalyst influencing market sentiment and the movement of U.S. indices.
However, the Nasdaq rebounded this week, breaking above the 25,221 level and forming a higher high, indicating a shift in trend from bearish to bullish.
The latest gains are supported by renewed expectations of a December rate cut with an 80% probability, in addition to investors buying the dip as part of their long-term investment strategies in the artificial intelligence sector.
On the technical side, if the price pulls back for a correction, it may rebound again from the 24,148 level to target 24,962 as a first medium-term target.
However, a decline below 23,830, along with forming a lower low on the 4-hour timeframe, would invalidate the bullish scenario and signal a return to a downward trend for the Nasdaq.

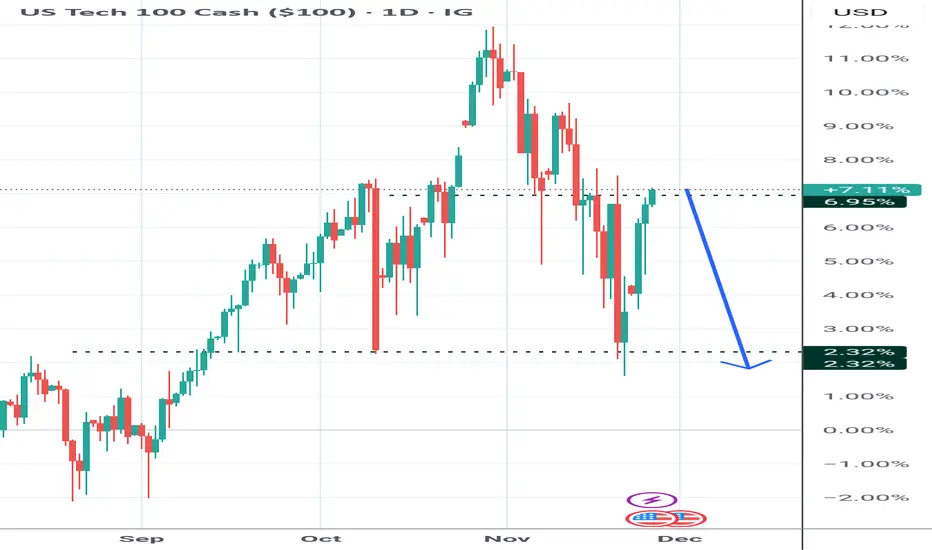
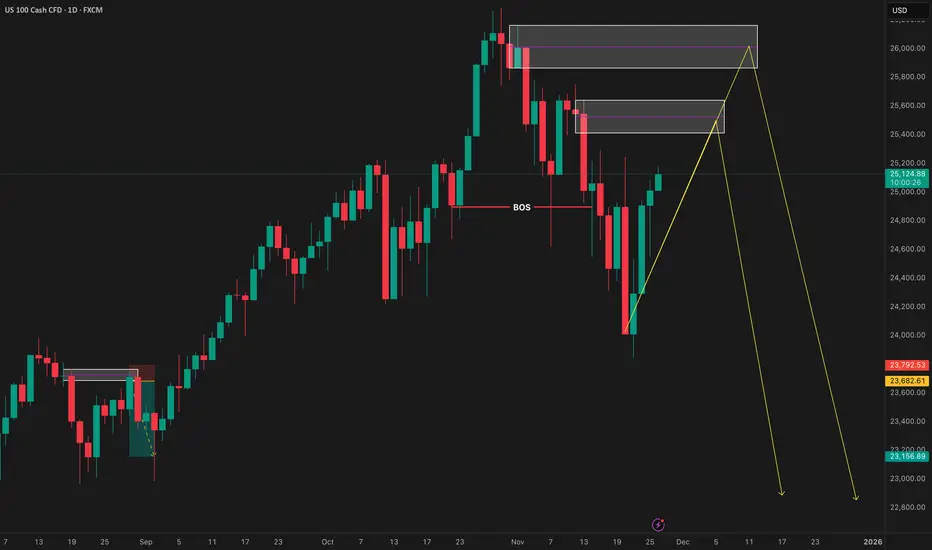
LOOKING TO SHORT NASNAS100 1D - For those of you who like to trade this CFD, I am wanting to see price continue trading us lower as the Dollar weakens over the course of the next month or so.
We will however see some temporary strength whether it be for the next week or two. However my overall bias for this market is to see it trade us lower longer term.
We have been delivered with multiple breaks in structure to the downside suggesting bearish momentum, its now a case of waiting for the opportunity to play into our hands before we take part.
As soon as price gives us the structure we need, the penetration of areas of interest this is when we can begin looking to take part, until then we stay patient, as always.
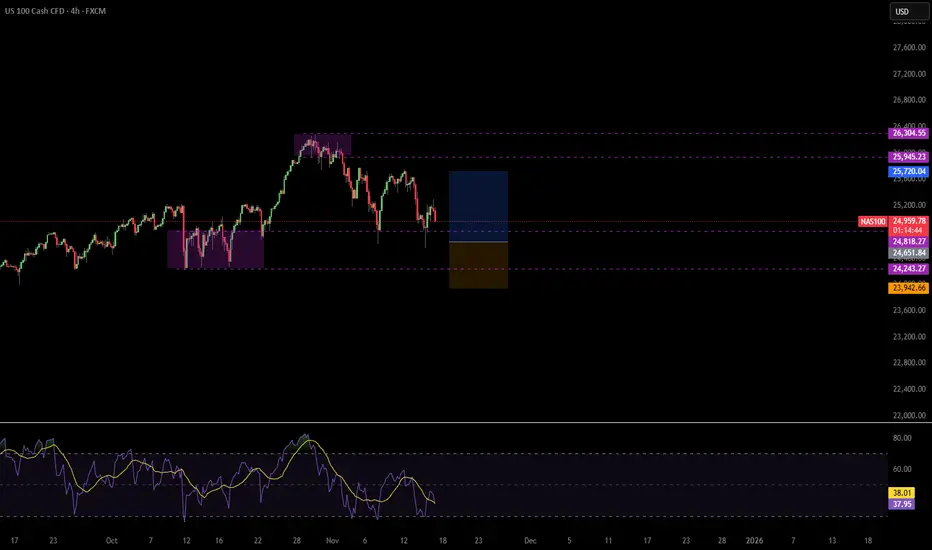
Price action Price currently testing an order block that was pervious rejected looking to go to the downside managed to fix my chart this is a clear sell