NAS100 always following the channels NAS100 now broken out into a new channel
Follow it to make some easy day trades!
Trade ideas

Nasdaq 100: Double Top or Double Bottom? (FRL Setup)Hello, dear traders! In my opinion the Nasdaq 100 is stuck between two opposite reversal structures.
• Globally: possible Double Top with neckline at 23513.
• Locally: potential Double Bottom with neckline at 23791.
According to Fractal Reversal Law (FRL), the neckline defines the real impulse.
• 🟢 Break above 23,791 → confirms Double Bottom → target 24113.
• 🔴 Break below 23,513 → confirms Double Top → target 23121.
What do you think about this? Will Nasdaq 100 confirm the local Double Bottom and push higher, or will the global Double Top take control?

USTECH Long Opportunity USTECH has been making some bullish strides and continues the overall bullish trend. Last week, price broke above the major pivot level at $23680 and seems to be maintaining its bullish structure
Price is currently in a retracement and is testing the $23680 level where i am expecting a bounce to the upside in continuation with the bullish trend.
From the higher timeframes price is trading above all 3 SMA and in the bullish region of the RSI. on the 1 hour timeframe, price is maintaining its position above the Bullish support trendline and the 200 SMA which adds to the bullish move i am looking at.
Alternatively if price continues to move down, i am targeting the support level at $23520 where buyers are sitting and having enough momentum to push the market higher.
Looking for long positions from either the $23680 or alternatively the $23520 level.

Nasdaq100, DJIA & S&P500 - Quick technical analysisThe top three US indices are near their all-time highs. Will we see new all-time highs?
Let's take a look.
MARKETSCOM:US100
MARKETSCOM:US30
MARKETSCOM:US500
Let us know what you think in the comments below.
Thank you.
75.2% of retail investor accounts lose money when trading CFDs with this provider. You should consider whether you understand how CFDs work and whether you can afford to take the high risk of losing your money. Past performance is not necessarily indicative of future results. The value of investments may fall as well as rise and the investor may not get back the amount initially invested. This content is not intended for nor applicable to residents of the UK. Cryptocurrency CFDs and spread bets are restricted in the UK for all retail clients.

NASDAQ Index Analysis (US100 / NASDAQ):The index is moving within an overall upward channel in the long term, while showing a short-term bearish trend on the hourly timeframe. Currently, it is trading near the 23,700 level.
🔻 Bearish Scenario:
If the price breaks below 23,650 and holds beneath it, the index may test the 23,550 level. A further break could open the door for deeper corrections toward lower zones.
🔺 Bullish Scenario:
On the other hand, if the price manages to break and hold above 23,800, this could support continued bullish momentum towards a new high at 23,950.

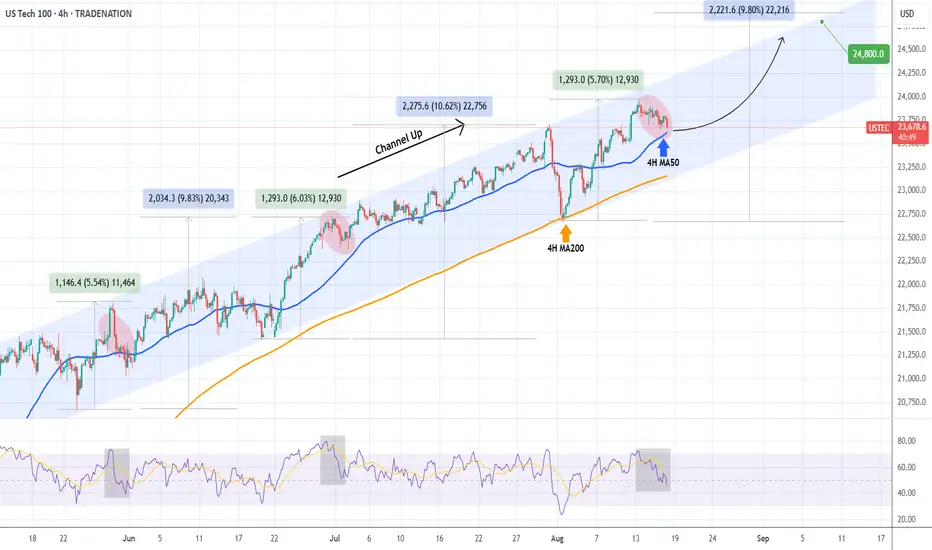
NASDAQ testing its 4H MA50. Will it offer Support?Nasdaq (NDX) has been trading within a Channel Up since May 11 and is approaching its 4H MA50 (blue trend-line) today following a Wednesday initiated pull-back.
Technically this is so far a normal correction for this pattern, which offers a short-term buy signal as the 3 times during those 4 months that it broke convincingly, it rebounded on or close to the 4H MA200 (orange trend-line).
As a result, if the 4H MA50 offers a rebound, we could see a +9.80% rebound from the 4H MA200, the minimum that this Channel Up has delivered upon a Bullish Leg. That gives a Target of 24800.
-------------------------------------------------------------------------------
** Please LIKE 👍, FOLLOW ✅, SHARE 🙌 and COMMENT ✍ if you enjoy this idea! Also share your ideas and charts in the comments section below! This is best way to keep it relevant, support us, keep the content here free and allow the idea to reach as many people as possible. **
-------------------------------------------------------------------------------
Disclosure: I am part of Trade Nation's Influencer program and receive a monthly fee for using their TradingView charts in my analysis.
💸💸💸💸💸💸
👇 👇 👇 👇 👇 👇
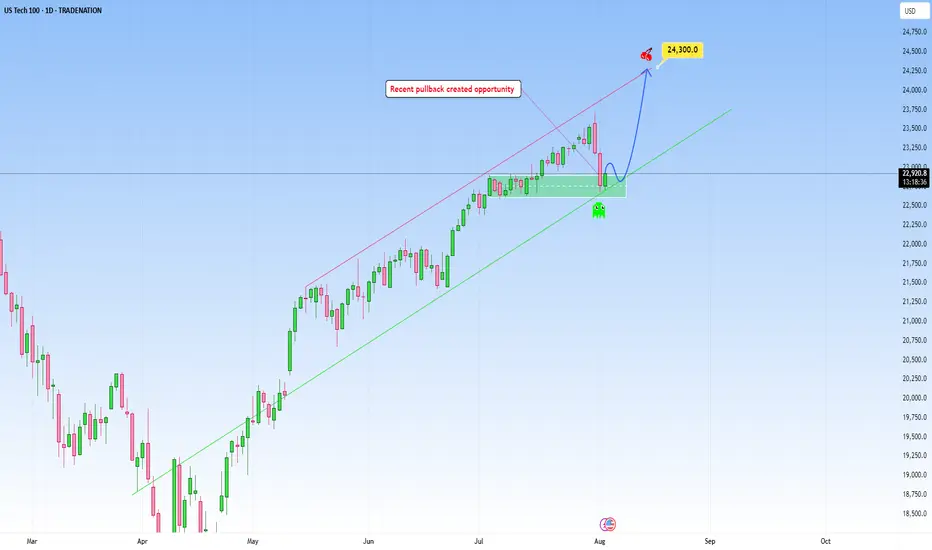
USTEC: Likely continuation following pullbackNAS100 climbed a steep uptrend and my expectation is for a continuation as marked on my chart, with an upside target at around 24,300.
This area here is where it can become a decision point, either price finds support and bounces, or it breaks below, and that’s when we might see the move start to extend lower.
If I were to take a side here, I would definitely choose more upside, but again only price action should determine next move.
But if price breaks below the trendline with conviction, it would invalidate the bullish scenario, suggesting that the uptrend may pause or could even reverse short-term.
Just sharing my thoughts for the charts, this isn’t financial advice. Always confirm your setups and manage your risk properly.
Disclosure: I am part of Trade Nation's Influencer program and receive a monthly fee for using their TradingView charts in my analysis.
NAS100 3 Drive Pattern Correction Wait For BoS📊 The NAS100 has pulled back after a strong bullish run and is currently facing some pressure 📉. I’m watching a three-drive pattern that appears to have extended into a fourth drive, followed by a corrective phase 🔄. From a smart money perspective, liquidity is often targeted after a strong expansion in trend — patterns like the three-drive can frequently lead to a deeper retracement before the continuation resumes. With that in mind, I’m anticipating the possibility of a further pullback before positioning for a potential long setup on a bullish break of structure 🚀 (not financial advice).

NAS100 - Stock Market Waiting for Jackson Hole Leak!The index is above the EMA200 and EMA50 on the 4-hour timeframe and is trading in its ascending channel. If the index corrects downwards towards the specified demand zones, you can buy Nasdaq with appropriate reward and risk.
According to a recent report from JPMorgan, the new U.S. tariffs could have significant repercussions for the American economy. The bank projects that these tariffs may reduce U.S. GDP by as much as 1% while simultaneously pushing inflation higher by up to 1.5%.
This year’s tariff hikes represent the largest increase since World War II, with the effective tariff rate rising to nearly 18%. With the expiration of tariff exemptions on imports under $800, consumer goods prices are expected to climb further.
JPMorgan has warned that both consumers and businesses may struggle to absorb these additional costs, raising the risk of stagflation. Meanwhile, monthly inflation has remained within the 0.3% to 0.5% range, suggesting that the Fed’s preferred inflation gauge could rise toward 3% to 3.5%.
As U.S. tariffs have surged to their highest levels in decades, revenues from these duties hit a record $28 billion in July. According to estimates by the Tax Foundation, tariff revenues could total about $2.2 trillion by the end of this decade. However, this is also expected to trim GDP by around 0.9%.
Research conducted by Yale University indicates that tariff policies could reduce annual household income by approximately $2,400, since part of these tariff costs are passed on to consumers by companies.
At the same time, Berkshire Hathaway, led by Warren Buffett, has made notable adjustments to its investment portfolio:
• It purchased 6.6 million shares of steelmaker Nucor.
• It added 5 million shares of healthcare insurer UnitedHealth.
• It fully divested its holdings in T-Mobile US.
• It trimmed its stake in Apple by 6.7%, reducing its position to 280 million shares.
Meanwhile, Goldman Sachs reiterated its outlook that the Federal Reserve will cut interest rates three times before the end of 2025. The projected reductions include three 25-basis-point cuts in September, October, and December. Additionally, two further cuts are expected in 2026, bringing the terminal rate down to the 3%–3.25% range. Markets have already increased their bets on a September rate cut. Recent weakness in inflation and employment data has paved the way for such accommodative policy measures.
Federal Reserve Chair Jerome Powell is scheduled to deliver a speech at the Jackson Hole Symposium on August 22, 2025—an event that has become an unofficial policy-setting platform. Analysts at Morgan Stanley expect Powell will attempt to temper market expectations for a 50-basis-point cut in September. Given the political pressures and mixed economic signals, Powell may only endorse a 25-basis-point cut, or potentially push back against easing altogether.
Any of these outcomes could disappoint markets, especially if Powell fails to deliver clear guidance. His speech may therefore play a decisive role in shaping U.S. monetary policy for the remainder of the year and could drive heightened volatility across markets.
Although this week’s economic calendar features several important housing and manufacturing reports, the spotlight will remain firmly on the Fed. On Tuesday, July housing starts and building permits data will be released. Wednesday brings the FOMC’s July meeting minutes, speeches from key Fed officials Waller and Bostic, and the official kickoff of the annual Jackson Hole Symposium.
On Thursday, markets will digest a packed set of data, including the Philadelphia Fed manufacturing index, weekly jobless claims, the preliminary August S&P Global PMI, and July existing home sales.
The highlight of the week will be Friday, when all eyes turn to Jerome Powell. His annual Jackson Hole speech is expected to provide fresh clues about the Fed’s policy trajectory—guidance that could strongly influence market direction in the weeks ahead.

NASDAQ| BULLISHHTF Bias: Bullish. Structure intact, bullish intent confirmed, previous highs broken to the upside. All bullish setups remain valid. Strong 4H levels holding; price pushing upward cleanly — past interventions not a concern.
MTF Observation: Deep liquidity formed on the sell side. We’re waiting for it to be taken out to mitigate order block areas between 23,500–23,400. Once sweep occurs, refined internal structure will align for bullish continuation.
Entry Plan: After order block mitigation, drop to lower timeframes for CHoCH confirmation and precision entry. Until then, we observe, follow price, and maintain patience.
Mindset Note: Play smart money. Stay disciplined. Hold your spot, let the market show the path, then execute with precision. Let’s go. 🚀

#NDXThis appears to be forming a wave 4 correction cycle with a 2x zig zag pattern that will be followed by another bullish 5 wave sequence.

NAS100 - Uptrend Intact, Prefer Pullback LongsPrimary trend remains up. A brief weekly break lower did not hold, so I favor continuation after a dip to let entries load. If we get the pullback into marked demand or trend support, I’ll look for longs targeting the path higher. There is overhead supply near all-time highs, so I will treat that zone as take-profit rather than assume discovery beyond it on first touch.

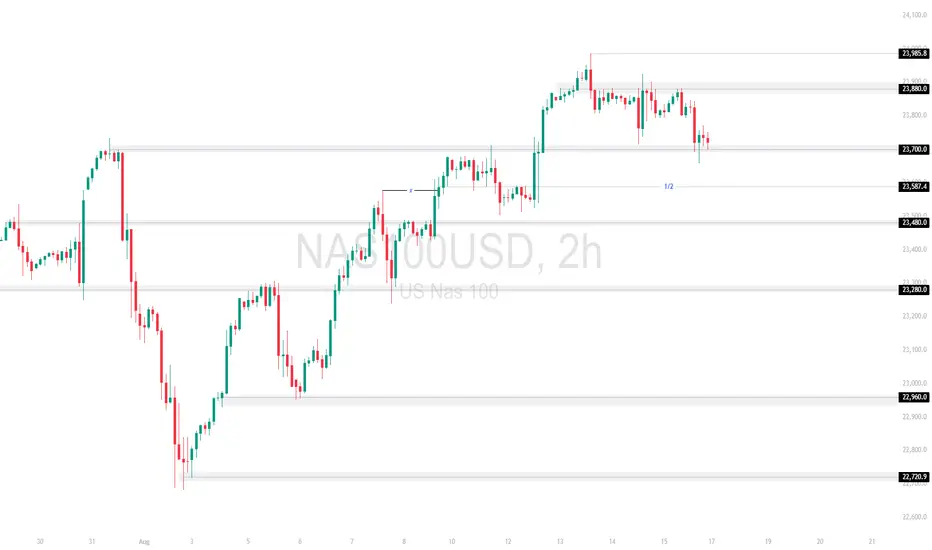
NAS100 – Key Support RetestPrice has pulled back from 23,985.8 resistance and is now testing the 23,700.0 zone. A solid hold here could fuel another leg higher, but a break lower may expose 23,587.4 and 23,480.0.
Support at: 23,700.0 🔽 | 23,587.4 🔽 | 23,480.0 🔽 | 23,280.0 🔽 | 22,960.0 🔽
Resistance at: 23,880.0 🔼 | 23,985.8 🔼
🔎 Bias:
🔼 Bullish: Holding 23,700.0 could lead to a retest of 23,880.0 and 23,985.8.
🔽 Bearish: A break below 23,700.0 shifts focus to 23,587.4 and 23,480.0.
📛 Disclaimer: This is not financial advice. Trade at your own risk.
Concern for the NASDAQIn no way certain of a large pullback on the NASDAQ NASDAQ:NDX , but I’m hedging for it. With YQQQ $YQQQ.

NASDAQ After the Fireworks: Bearish Setup LoadedAfter the classic 4th of July rally, I stepped in on the short side of Nasdaq, targeting 22,000 and 21,400 zones. The market structure shows exhaustion, and with the cloud retest failing to hold new highs, I positioned accordingly.
Technical:
• Price stalled at prior expansion highs with tight compression near 23,000.
• Daily FibCloud offered resistance confirmation.
• Bearish risk-reward skew forms after extended rally and thin retraces.
• Volume divergence spotted.
Fundamentals:
Multiple overlapping uncertainties:
• Trump confirmed tariffs will take effect on August 1, threatening a 10% surcharge on BRICS-aligned nations.
• Treasury Secretary Bessent anticipates several trade deal announcements within 48h—but stresses quality over quantity.
• Bank of America maintains its base case of 0 rate cuts in 2025, citing strong economic data and sticky inflation risks.
The combination of tariff escalation, hawkish monetary expectations, and global trade friction creates a perfect backdrop for volatility and correction—especially in overextended tech indices like the Nasdaq.
Note: Please remember to adjust this trade idea according to your individual trading conditions, including position size, broker-specific price variations, and any relevant external factors. Every trader’s situation is unique, so it’s crucial to tailor your approach to your own risk tolerance and market environment.

Nasdaq 100 can entering to bear zone In coming days all this level can see
22600
21600
20600
If this level breaks it can touch 18000
