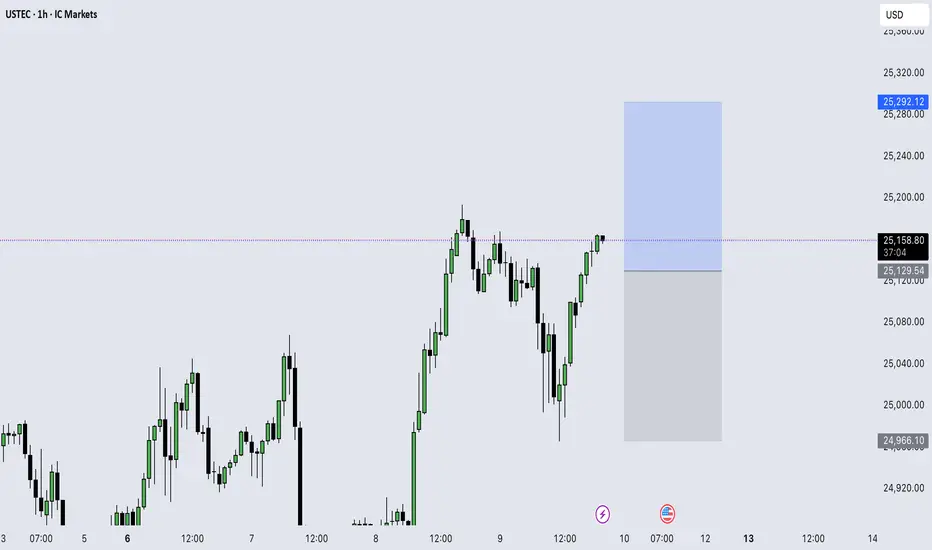
Weekly NASDAQ Outlook (NQ!)Last Friday, NQ! closed at 23,998.6, after a strong decline into the weekly close. When the market reopened on Monday, it gapped up — likely due to weekend events and news.
That gap has since been completely filled, and price has shown a solid push to the upside during the week.
For the coming week, I’m expecting NQ! to take out the all-time high and possibly form a new high.
However, before that happens, I’d like to see a retracement toward the 24,692.8 level, which could provide high-probability long setups.
There’s also a possibility that price won’t revisit this level and instead continues pushing higher directly, but a clean pullback into 24,692.8 would offer a great entry opportunity for longs.
📊 Outlook Summary:
- Expecting bullish continuation.
- Ideal retracement zone: 24,692.8.
- Main target: New all-time high above previous peak.
Trade ideas

Big Bearish Day- A Weakness or Buying OpportunityNasdaq is in a strong uptrend. It broke above 23,966 and shot up to 25,191
As it has been taking support at 50EMA multiple times on daily chart, the recent fall of more than 1200 points was contained exactly near the same level.
From the price action point of view-
The fall ceased near the previous breakout zone near 23966, previous resistance acted as support.
A single candle on the daily chart with no continuation has to be an attempt to sweep liquidity below important swing lows near 24200 and 24000 (see 4H chart).
The action near 24250 is also reflecting absorption.
The psychological round number of 25000 could stay as resistance for some time and again push it back in the 24,400 to 24,500 zone offering a short-term low risk buying opportunity.
In this backdrop, 24000 to 24250 zone, accompanied by the strong trend in the background, may again cushion the price back to new highs.
What is your point of view?
Is the recent fall a sign of weakness or an opportunity to buy?
#Educational post not a recommendation to buy or sell.

US100 Bearish Bias!
HI,Traders !
#US100 keeps growing
But a horizontal resistance
Level of 25039.3 is nearby
So after the retest of the
Level we will be expecting
A local bearish correction
On Monday !
Comment and subscribe to help us grow !

NAS100 Technical Outlook (18–25 Oct 2025)Trend Summary:
NASDAQ 100 remains in a corrective phase after rejecting near the 25,200–25,300 resistance zone. Recent price action forms a potential Wave 4 retracement within a medium-term bullish Elliott structure.
1D Chart View:
The index is hovering around key support at 24,750, aligned with the 3 8.2% Fib retracement of the prior leg and near daily EMA50. A bullish reversal from this zone would confirm continuation toward 25,800–26,000.
4H Structure:
A descending channel is observed, acting as a corrective pullback. Ichimoku Cloud shows price testing the lower edge; a break above 25,050 could signal momentum recovery. Volume divergence hints at accumulation beneath.
1H / 30M:
RSI forming a higher low while price prints a lower low — a bullish divergence setup. Bollinger Bands are tightening, suggesting volatility expansion ahead. Watch VWAP reclaim above 25,000 for confirmation of short-term trend reversal.
15M / 5M Intraday Bias:
Short-term traders should monitor the 24,800–24,750 zone for a bounce. Failure below this area exposes 24,620, while a decisive break above 25,050 may trigger an intraday rally targeting 25,250–25,300.
🎯 Trading Plan
Bullish Scenario:
Buy Zone: 24,750–24,800
Targets: 25,050 → 25,250 → 25,800
Stop Loss: 24,580 (below structure low)
Bearish Scenario (alternative):
Sell Zone: 25,250–25,300 (resistance rejection)
Targets: 25,000 → 24,750 → 24,620
Stop Loss: 25,400
🔍 Confluence Factors:
Elliott Wave: Wave 4 correction likely ending.
Fibonacci: 38.2–50% retracement aligning with structure support.
Ichimoku: Testing lower cloud — potential bullish crossover setup.
RSI Divergence: Positive momentum building.
VWAP: Reclaim signals early buyer strength.
Volume: Accumulation noted during low volatility phase.
📘 Outlook Summary:
Bias remains cautiously bullish above 24,750, targeting 25,800–26,000.
Break below 24,620 invalidates bullish structure and opens path to 24,300–24,200.
NAS100 traders should monitor intraday reactions and volume confirmations near key zones. This week may define whether the correction phase transitions into a new impulsive wave or deeper retracement.


US NAS 100Preferably suitable for scalping and accurate as long as you watch carefully the price action with the drawn areas.
With your likes and comments, you give me enough energy to provide the best analysis on an ongoing basis.
And if you needed any analysis that was not on the page, you can ask me with a comment or a personal message.
Enjoy Trading ;)

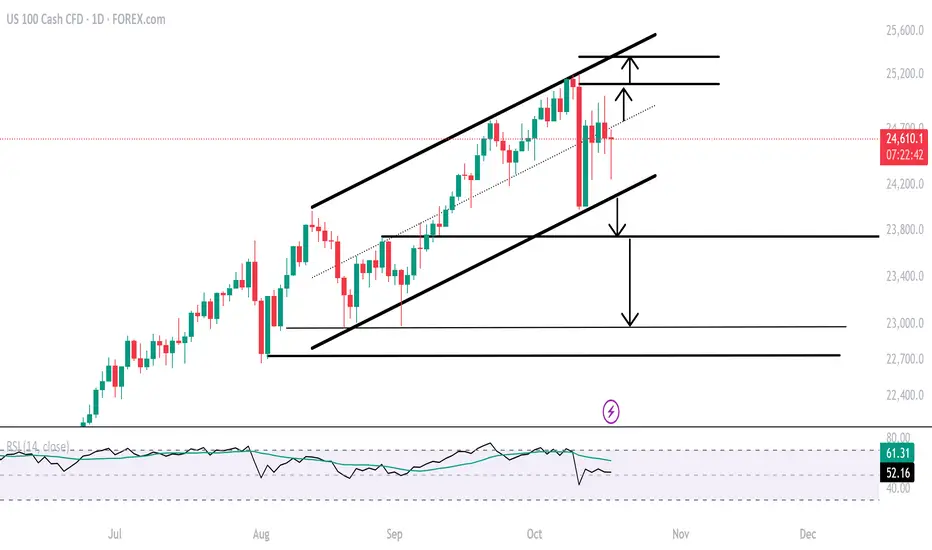
Nasdaq Outlook: Is the Correction Over?Despite the ongoing AI sector growth, the index remains under pressure alongside the broader risk-off sentiment. It is once again facing the 24,000 support and the August–October trendline. The daily RSI is leaning near the neutral 50 level, suggesting that a sustained break below 24,000 could extend the decline by another 1,000 points, testing key supports near 23,700, 23,100 and 22,700 — potentially offering another “buy-the-dip” opportunity.
On the upside, if the Nasdaq manages to hold above 24,000 and, more importantly, close above 24,800 — the mid-zone of the ascending channel respected since August 2025 — prices could advance toward the upper boundary, aligning with levels 25,000 and 25,300, marking new record highs.
- Written by Razan Hilal, CMT
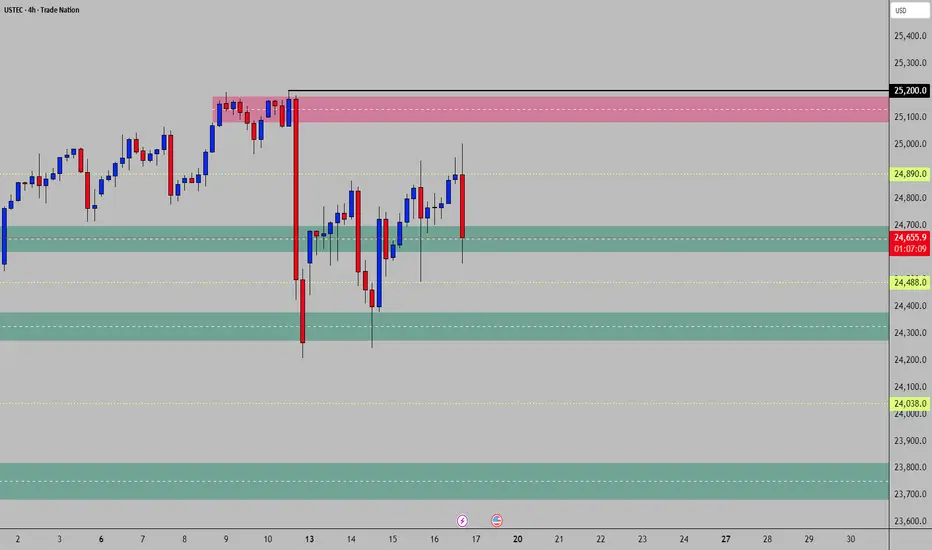
NSDQ100 Key trading levelsKey Support and Resistance Levels
Resistance Level 1: 24908
Resistance Level 2: 25050
Resistance Level 3: 25200
Support Level 1: 24376
Support Level 2: 24205
Support Level 3: 23920
This communication is for informational purposes only and should not be viewed as any form of recommendation as to a particular course of action or as investment advice. It is not intended as an offer or solicitation for the purchase or sale of any financial instrument or as an official confirmation of any transaction. Opinions, estimates and assumptions expressed herein are made as of the date of this communication and are subject to change without notice. This communication has been prepared based upon information, including market prices, data and other information, believed to be reliable; however, Trade Nation does not warrant its completeness or accuracy. All market prices and market data contained in or attached to this communication are indicative and subject to change without notice.

Us100 Beautiful price action for the Friday
NFP ,data still not released due to the shut down, this will further effect the other major economic data outputs ,
Us100 on a steady close for Friday .
24000-25000 range close .
Took out previous day low in the Asian /London sessions
Trading back above markert open
Potential push to previous week low or continue to previous day highs and Asian day high

Nas100 Trade Set Up Oct 17 2025I am overall still bearish so i want to see either a sweep of BSL/Asia highs followed by internal bearish structure to take sells down to SSL/London lows or a BOS of 15m low to then sell to SSL

NQ,1H,wait for hunt yesterday high |October 14 2025I’ve decided that during this downtrend, if the market doesn’t go sideways and the bearish trend actually takes shape — because believe it or not, I’m not a fortune teller — I’ll share every single trade with you, whether it ends in profit or loss.
so my short vision is up but in higher timeframe is down
I'll wait for a short position
In about a month, I’ll also start accepting around 20 members to collaborate with me.
So if you don’t want to lose track of my page, make sure to follow.

NAS100 - 2HR TRADING CARD
🔶 NAS100 Trading Card
🔑 Pivot Zone 24550 - 24650 (Key Pivot Area)
📊 Context: Bullish Primary Trend | Below Pivot | Current 24520
⚠️ Key Levels:
Active Supply = 25060 - 25185
Active Demand = 24245 - 24340
Halfway to Supply = 24862
Halfway to Demand = 24444
───────────────────────────────────────────
🟢 Bullish Scenario
🔄 Bias Flip: Clear breach above 24650
⚡ Trigger: Long from 24550-24650
• When price shows demand response (wick rejections/strong bounce)
🎯 T1 = 24862
🎯 T2 = 25060
🎯 T3 = 25388 (38% Fib Extension)
❌ Invalidation: Back below 24550
───────────────────────────────────────────
🔴 Bearish Scenario
🔄 Bias Flip: Clear breach below 24550
⚡ Trigger: Short from 24550-24650
• When price shows supply response (wick rejections/strong breakdown)
🎯 T1 = 24444
🎯 T2 = 24340
🎯 T3 = 24129 (38% Fib Extension)
❌ Invalidation: Back above 24650

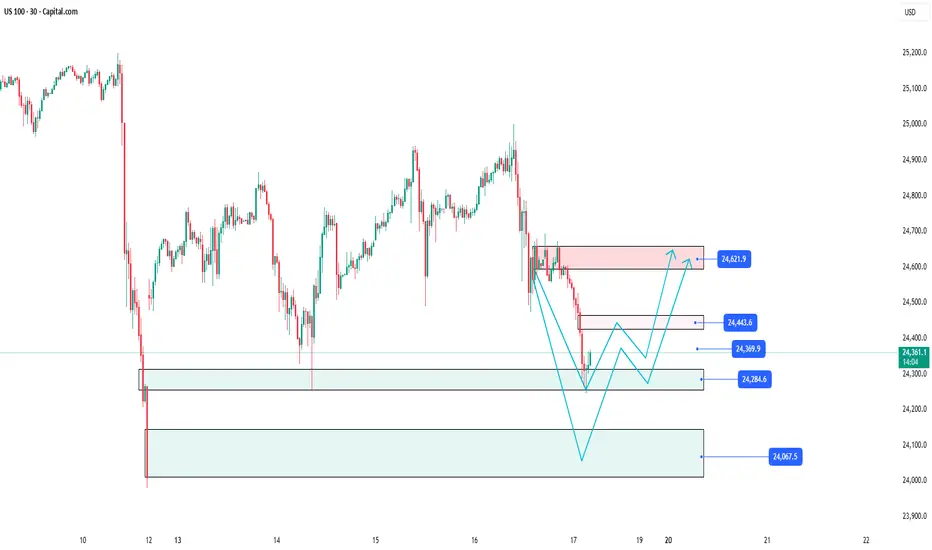
US100: Price action around important imbalance📊 SKILLING:US100 Analysis: Detailed trading scenario at key price level 24,443.6 🚀
The US 100 30-minute chart is currently illustrating a clear picture of price movements with significant support and resistance zones. At the moment, the price is undergoing a strong correction after a deep decline and is approaching crucial price areas, creating multiple potential trading opportunities for investors.
________________________________________
Support Zone 24,284.6 – The starting point for a potential bounce 💥
Currently, the price is nearing the technical support level around 24,284.6 – a key support area that is expected to hold considerable buying interest, potentially triggering a short-term bounce. Buyers may step in here to prevent further declines and initiate a recovery trend.
Careful observation of price action around this zone is essential as it will determine the market’s next momentum: whether the price will rebound or break lower.
________________________________________
Immediate Resistance Levels and the Imbalance Zone at 24,443.6 🔍
Following a bounce from the 24,284.6 support, the expected scenario is a gradual move upwards to test important resistance levels:
• First at 24,369.9, where initial selling pressure may emerge, challenging the upward momentum.
• Next at 24,443.6, identified as a significant imbalance zone on the chart — a price level where price previously moved rapidly, creating a notable supply-demand gap.
• This zone acts as a technical “wall,” a crucial checkpoint before the price can continue its upward trend or get pushed back down.
________________________________________
Detailed Price Movement Scenario 🔄
1. Price bounces from the support at 24,284.6, setting the stage for a recovery leg.
2. Price moves up to test the first resistance at 24,369.9; the reaction here indicates the buyers’ strength.
3. Price then challenges the imbalance zone at 24,443.6 — where significant selling pressure may occur.
4. At this level, two scenarios may unfold:
• Price breaks above 24,443.6, confirming the uptrend and targeting the next resistance at 24,621.9.
• Price rejects this zone, leading to selling pressure that pushes price back to retest the 24,284.6 support or even lower.
________________________________________
Downside scenario if support at 24,284.6 fails 🛡️
In the worst case, if price breaks below the crucial support at 24,284.6, further declines toward a broader support zone at 24,067.5 are likely. This level may act as the next key area for price stabilization and buyer interest before any potential rebound.
Please like and comment below to support our traders. Your reactions will motivate us to do more analysis in the future 🙏✨
Harry Andrew @ ZuperView
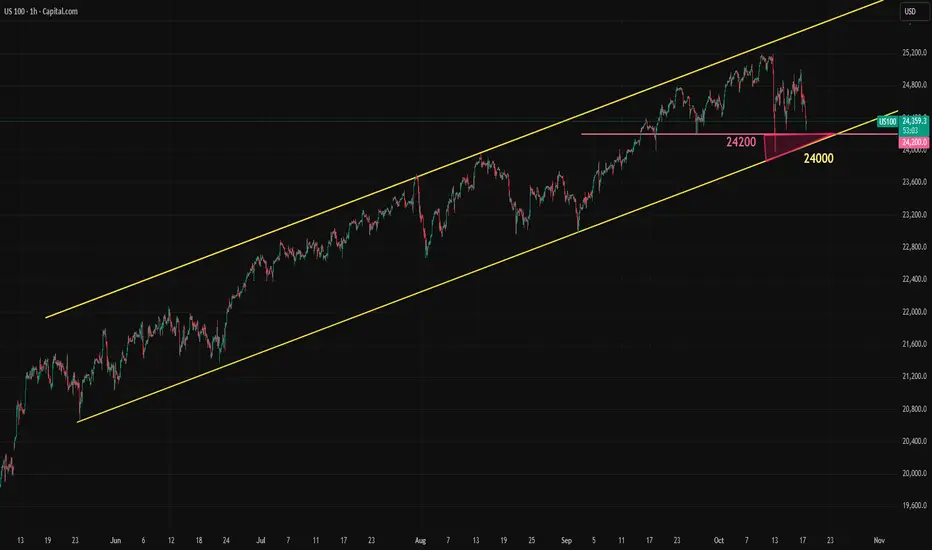
Nasdaq Nears Decision PointNasdaq remains within its bullish trend channel but is approaching a decision point. The 24,200 and 24,000 levels are two key supports holding back further downside. If these supports fail, it could trigger a multi-day selloff.
So far, the downward pressure has mostly come from regional banks, keeping the decline in Nasdaq limited. However, if concerns over the rare earth supply chain grow due to trade disputes between China and the US, this could trigger a broader selloff in Nasdaq.
NAS100 – Technical AnalysisPrice is testing the 24,300.00 support zone after failing to hold above 24,500.00, indicating sustained selling pressure within the current bearish swing. The 4H structure shows repeated rejections at 24,750.00, suggesting that buyers are losing strength while sellers remain dominant.
Support at: 24,300.00 🔽 / 23,900.00 🔽 / 23,000.00 🔽
Resistance at: 24,500.00 🔼 / 24,750.00 🔼 / 25,000.00 🔼 / 25,170.00 🔼
🔎 Bias:
🔽 Bearish: Continuation below 24,300.00 could trigger a deeper drop toward 23,900.00 next.
🔼 Bullish: A firm close back above 24,750.00 would shift sentiment back toward 25,000.00–25,170.00 levels.
📛 Disclaimer: This is not financial advice. Trade at your own risk.

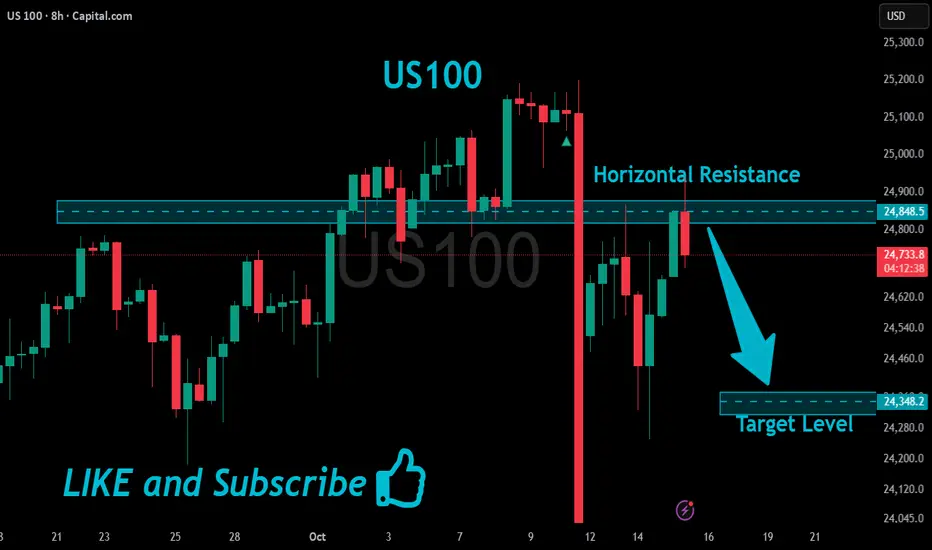
US100 Local Bearish Pullback Expected!
HI,Traders !
#US100 is hit A strong horizontal resistance
Level of 24848.5 after a sharp
Push upwards by the bulls
So a local correction is needed
From the resistance with the
Expected target being the
Local level below at 24348.2 !
Comment and subscribe to help us grow !
US100 - BEARISH POSSIBILITYPrice is already bearish in higher timeframe (H4). And is currently creating bearish tendency in the lower timeframes. We can observe a slow support breakout which can be a crucial confirmation of a bearish continuation. This is purely ideas purpose only and should not be used alone to take on a trade. Good profits traders.

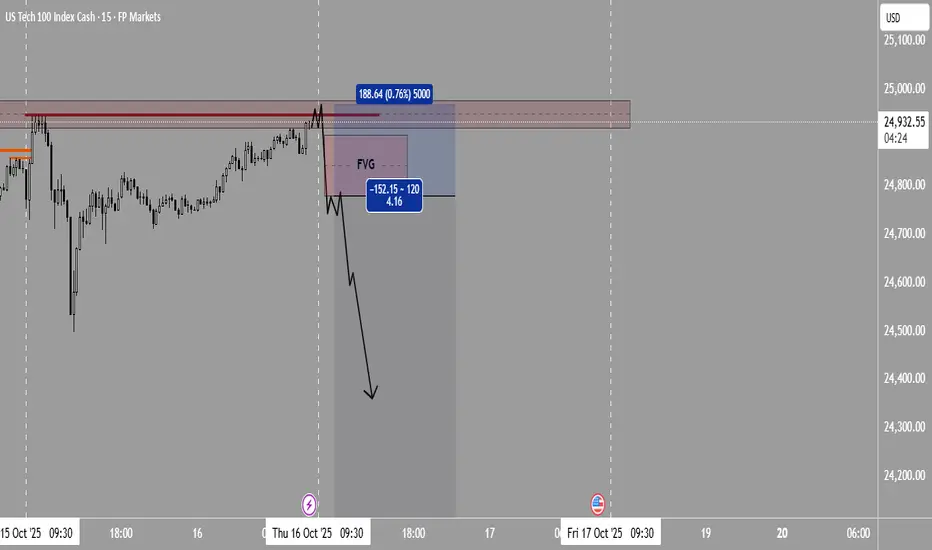
I’m getting ready for potential short position |October 16 2025If today the price goes up and hunts the high from 10 AM yesterday (New York time) — meaning it grabs the liquidity and takes out the stops above that level — and then forms a bearish Fair Value Gap (FVG) followed by signs of weakness or a rejection structure (like a lower-timeframe break, divergence, or bearish confirmation candle), that scenario would be one of the best short setups of the day.
NAS100 in a bearish move and may break 24000NAS100 recently touches all time high to 25200 and sharply retrace back to 24000 level.
The price is now going back to 24800 level. In order to continuous the short term trend , It may move back to 24000 to take the liquidity and it may go further downside to 23800 leve.

Trendline BreakThe price broke out of a bearish trendline which was a small consolidation as we are still in a bullish trend, the price made a pullback and now looks to continue its bullish run
WE ONLY TRADE PULLBACKS
Comment your thoughts

NAS100 - High Volume Control🔶 USTEC Trading Card
🔑 Pivot Zone: 24,600 - 24,700 (Primary Demand)
📊 Context: Bullish trend in correction | Current 24,776.9
⚠️ Key Levels:
Immediate Resistance = 25,080 - 25,180 (Major Supply)
Lower Support = 24,280 - 24,380
Deep Support = 23,670 - 23,820
────────────────────────────────────────────────
🟢 Bullish Scenario
Bias Flip: Already active (pullback within uptrend)
Trigger: Long from 24,600-24,700 when price shows upward demand - wick below
🎯 T1 = 24,900
🎯 T2 = 25,080
🎯 T3 = 25,180
❌ Invalidation: Back below 24,500
────────────────────────────────────────────────
🔴 Bearish Scenario
Bias Flip: Clear breach below 24,600
Trigger: Short on break below 24,600 with downward supply confirmation
🎯 T1 = 24,330
🎯 T2 = 24,038
🎯 T3 = 23,820
❌ Invalidation: Back above 24,800
NASDAQ/NAS100The Nasdaq looks shaky right now. Tech stocks are still priced high, but cracks are showing from weak momentum to rising global tensions and stubbornly high interest rates. If key support levels break, we could see a pullback.
