NASDAQ Signal : US 100 H1 / H4 : long !!!Hello Traders! 👋
What are your thoughts on NASDAQ ?
This correction could offer a buy-the-dip opportunity, with potential for a move back toward the recent highs.
NASDAQ ( US100 ) :
Market price : 24400
Buy limit 1 : 24200
buy limit 2 : 24000
Tp1 : 24600
Tp2 : 25000
Tp 3: 25700
Tp 4 : 263

SELL NAS100 - WE TRY AGAIN!Good afternoon Traders
Trade what you feel and not what you see.
Good luck.

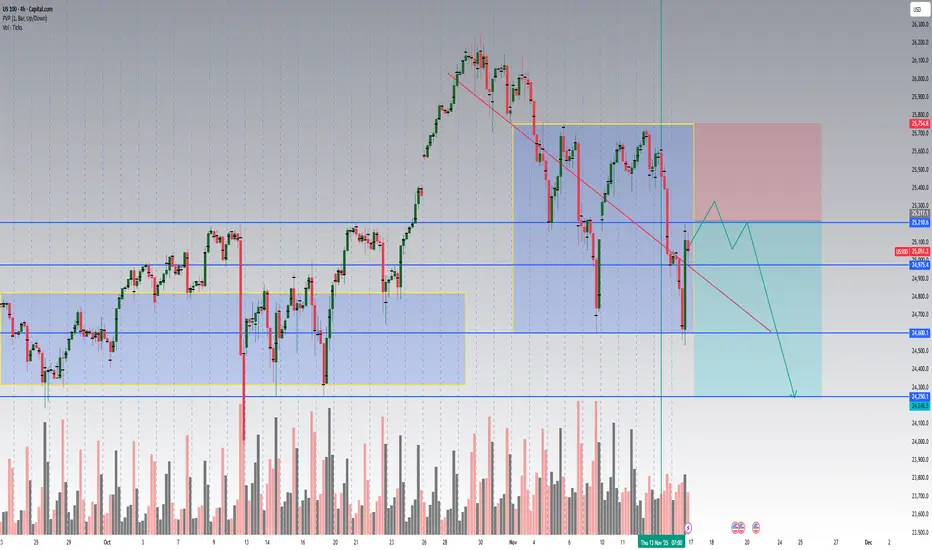
US100 Technical Outlook: Bearish Pullback Inside a Key LiquidityHey traders 👋
The US100 (NASDAQ 100) is currently sitting in a very interesting technical position on the 4-hour chart.
Let’s break it down 👇
🧭 Structure Overview
After a strong bullish leg that peaked near 25,800, the index entered a descending corrective channel.
We’ve now hit an important supp
The Deeper Logic Behind Price Delivery (Nobody Talks About This)Most traders think some pairs are slow and others are fast.
But that belief is the reason they stay confused, lose trades, and can’t read delivery.
The truth is deeper, and once you see it, you can’t unsee it.
This is the real explanation behind timing, alignment, and phase delivery — the part nobo
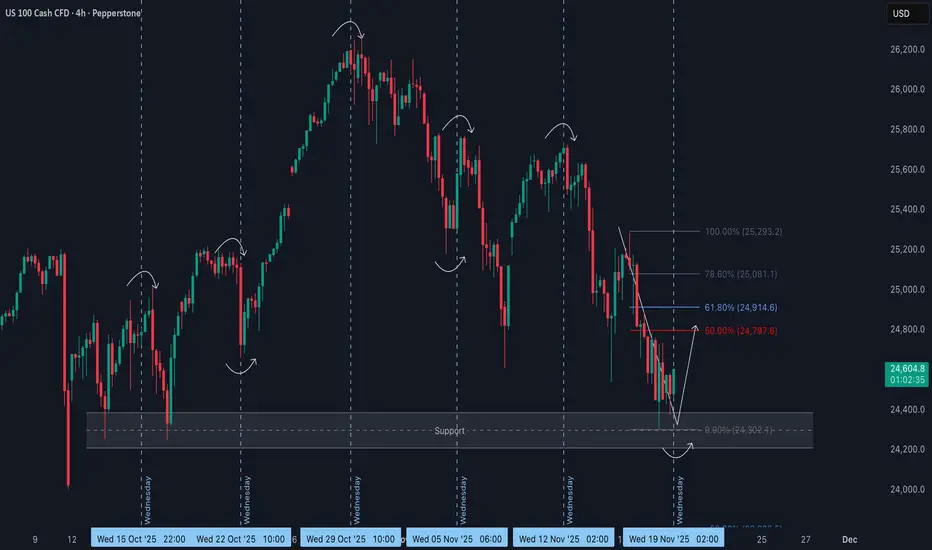
This is a "buy-the-dip" (bullish) strategy for NAS100.Wait for the price to pull back into the support area between the 0.5 Fibonacci level (25,144.7) and the 0.618 level (25,006.7).
Do not buy just because it touches the zone. Wait for a 4-hour candle to close within or above this zone, which confirms buyers are stepping in.
Your targets to take pro

NAS 100Analysis in favor of the trend we see that there is liquidity and it should go to liquidate and make the movement you can see that it is a deep retreat to go for its new movement alcita

NAS100 LONG SETUP Price continues to follow the uptrend on D1. After rejecting 26... price retraced to the 24... region meeting a stable support there to form a double bottom

NDQ Short catching the sweet double topChart says it all , attempt to catch a double top on NDQ.
Tight stop loss is a must.

NAS100 Wednesday Reversal Potential from Key SupportOver the past several weeks, the NAS100 has shown a clear tendency for aggressive mid-week reversals, with Wednesdays repeatedly triggering sharp shifts in direction 🔄. This pattern suggests a strong time-based element in the algorithmic delivery of price, rather than random fluctuation.
🗓️ Each We
NAS1001. HTF crt forming + key level
2. LTF crt + csd
Entry on the second candle of a crt (AMD) Manipulating waiting for distribution

See all ideas
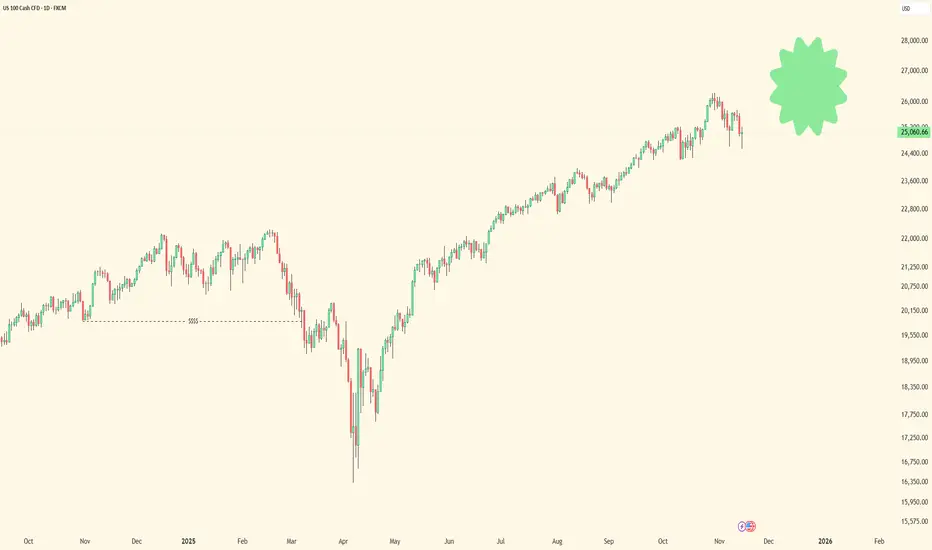
Displays a symbol's price movements over previous years to identify recurring trends.