Nasdaq - The most important structure!💰Nasdaq ( TVC:NDQ ) perfectly respects structure:
🔎Analysis summary:
Over the course of the past couple of months, the Nasdaq has been rallying an expected +50%. Still, until the Nasdaq will retest the upper channel resistance trendline, this rally won't be over. Therefore, we can still see a rally of another +10% in the very near future.
📝Levels to watch:
$25,000 and $30,000
SwingTraderPhil
SwingTrading.Simplified. | Investing.Simplified. | #LONGTERMVISION
Trade ideas

NAS100 - BullishNAS100 is bullish on 4H timeframe is currently bouncing from trendline support. Buying at current market price.

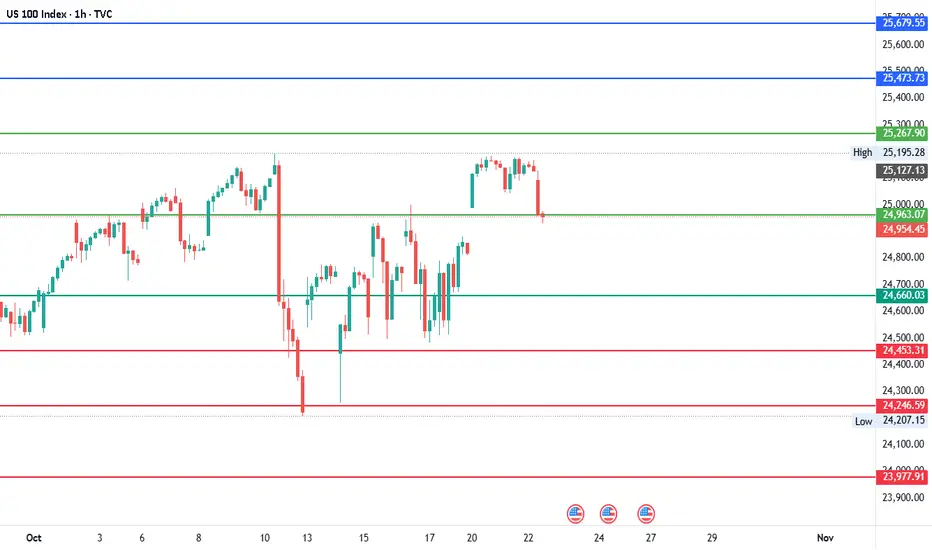
#NDQ - Short-term Range $26,216 - $23,709 | 1000 Points Move?Date: 22-10-2025
#NDQ - Current Price: $24,963.00
Pivot Point: $24,963.07 Support: $24,660.03 Resistance: $25,267.90
Upside Levels:
L1: $25,473.73 L2: $25,679.55 L3: $25,948.23 L4: $26,216.91
Downside Levels:
L1: $24,453.31 L2: $24,246.59 L3: $23,977.91 L4: $23,709.23
#TradingView #Nifty #BankNifty #DJI #NDQ #SENSEX #DAX #USOIL #GOLD #SILVER
NAS100 Bullish divergence on 1HNAS100 is showing a Bullish divergence in RSI in a 1H chart. This can be confirmed if the neckline breaks the LH at around 25270 points.

NAS100 1500 pips secured!Set up played out perfectly, breaking structure to during London session, sweep BSL, followed by internal IFVG to target 1500 pips

US NAS 100 BIG FALLPreferably suitable for scalping and accurate as long as you watch carefully the price action with the drawn areas.
With your likes and comments, you give me enough energy to provide the best analysis on an ongoing basis.
And if you needed any analysis that was not on the page, you can ask me with a comment or a personal message.
Enjoy Trading ;)

NAS100 H1 | Bullish Bounce off Key SupportNAS100 is falling towards our buy entry at 24,841, which is a swing low support level that aligns with the 161.8% Fibonacci extension level.
The stop loss is at 24,664, which is a swing low support level, while the take profit is at 25,102, which is a pullback resistance level.
Stratos Markets Limited (tradu.com/uk ):
CFDs are complex instruments and come with a high risk of losing money rapidly due to leverage. 68% of retail investor accounts lose money when trading CFDs with this provider. You should consider whether you understand how CFDs work and whether you can afford to take the high risk of losing your money.
Stratos Europe Ltd (tradu.com/eu ):
CFDs are complex instruments and come with a high risk of losing money rapidly due to leverage. 70% of retail investor accounts lose money when trading CFDs with this provider. You should consider whether you understand how CFDs work and whether you can afford to take the high risk of losing your money.

NAS100 Trade Set Up Nov 7 2025Price remains bearish so i will only looking for sells either after price sweeps internal BSL or London highs BSL before looking for 1m-5m IFVG/CISD to take sells to lower SSL levels

Nasdaq slides as volatility growsNasdaq was pushed down to the local support area, as the sentiment for the stock market has worsened due to a certain degree of deleveraging for stocks and investors moving to safety.
VIX (S&P 500 volatility index) has climbed above 20, which pushes the market’s volatility expectations higher and may trigger nervous reactions for tech stocks. The longest duration of downswings for Nasdaq is about 15-17 days, which allows us to project the downward move to a longer time period, with a further development of the bullish pullback, as shown at the chart.
Don't forget - this is just the idea, always do your own research and never forget to manage your risk!

USNAS100 – Bearish Bias Below 25230 | Targeting 24850–24350USNAS100 | Overview
Wall Street futures struggled for traction at the end of a wobbly week, as optimism around artificial intelligence—which helped drive markets to all-time highs earlier this year—has been tempered by growing concerns over monetization challenges and circular spending within the tech sector.
Technically:
The index maintains a bearish momentum while trading below the pivot line at 25230.
Currently, price action suggests a possible break below 25010, which would confirm a continuation toward 24850, with an extended downside target near 24350.
However, a 1H close above 25230 would indicate renewed bullish momentum, signaling a potential recovery toward 25430 and 25700.
Pivot Line: 25180
Resistance: 25430 · 25700
Support: 24860 · 24760 · 24350
Outlook:
USNAS100 remains bearish while below 25230, targeting 24850–24350 in the short term.
A confirmed 1H close above 25230 would shift bias to bullish continuation, eyeing 25430–25700.

Nasdaq’s Battle at the Golden Support!On the NASDAQ 100 (NDX) chart, the index has pulled back after a strong rally to around 26,000, now testing a critical support zone near 25,000–25,200. This area is technically significant because it aligns with three key factors:
1. The main ascending trendline (blue line)
2. The 50-day moving average
3. A previous horizontal support level
In the short term, if the index holds above 25,000 and forms a bullish reversal candle, it could rebound toward the next resistance around 26,200–26,500. The stop loss for this bullish scenario would be a confirmed breakdown below 24,800.
However, if the price drops below 24,800 and stays there, a deeper correction toward 23,800–24,000 becomes likely — which aligns with the lower boundary of the medium-term channel.
From a long-term perspective, as long as the index trades above its 50-day moving average (currently around 20,300), the primary trend remains bullish, with potential upside targets between 27,000 and 28,000.
In short, this current zone represents the dividing line between trend continuation and a medium-term correction for the Nasdaq 100.

Nasdaq Swing bullish setup4 hour
fibonacci Retracement 50% and 60%
1 hour
Wait for trend reversal
RRR 1:3 and hold for 1:5

Nasdaq Towards New All Time High, Buy-Stop TradeNasdaq bounced back upward after testing its support. Now going up, likely to make a new ATH.
We can take a 1:1 Buy trade here.

NDQ100 (15M) Bullish Analysis. (SMC)🧩 Market Context
After a strong bearish move marked by a 1H Fair Value Gap (FVG), the market started to show institutional accumulation.
A Change of Character (ChoCh) and a Break of Structure (BOS) confirm a shift to bullish momentum.
The identified Order Block (OB) acts as a key mitigation point supported by a well-defined support zone.
💥 Entry Idea
• Buy: 25,124
• Stop-Loss: 24,979
• Take-Profit: 25,530
• Risk/Reward: 1 : 2.6
After a Fake Out (bearish liquidity trap), price shows strong bullish reaction, indicating institutional intention to mitigate the OB and reach the Buy-Side Liquidity above.
📊 Technical Confirmations
• The SMA starts to act as a dynamic support.
• Rejection from the OB validates structure change.
• The target (25,530) aligns with a distribution zone and liquidity pool, perfect for partial or full take-profit exits.
🧭 Conclusion
Clean structure, strong institutional logic, and confluences in harmony.
This setup illustrates the accumulation → mitigation → distribution sequence, where the market sweeps liquidity before expanding upward.
A perfect example of professional market reading. 🚀
GOOD LUCK TRADERS 🦾🤓✌🏻

NDX - POTENTIAL PULLBACK IN PLAY - SHORT SHORT INTO LONGGood Morning,
Always trade with risk assessment in mind. You can lose money quickly without an exit strategy. I choose a 7% stop based on my risk.
We are looking for a .5% exhaustion gap into todays market to show initiation of the pullback.
Trade Safely
Enjoy!

US100 Will Hit Resistance Soon!
HI,Traders !
#US100 keeps growing
And the price will soon
Hit a horizontal resistance
Of 25817.8 from where
A local bearish correction
Is to be expected !
Comment and subscribe to help us grow !


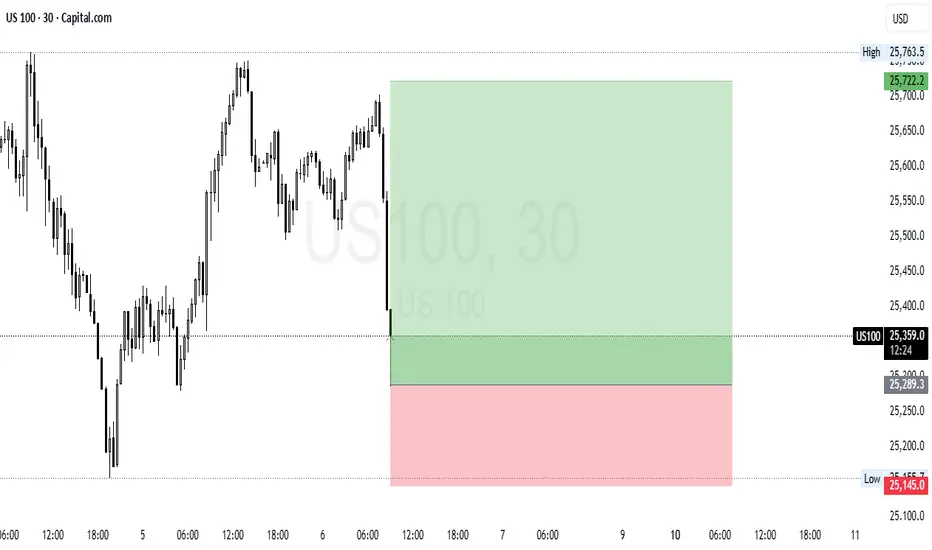
US100 (NASDAQ 100) Long SetupAnalysis:
The market formed a strong bullish leg earlier and is now pulling back to retest a key support zone around 25,300. If price holds this level and shows bullish confirmation (e.g., bullish engulfing or structure break), we could see continuation to the upside.
Bias: Bullish above 25,300
Invalidation: Break below 25,145
Setup Type: Long Position
Entry: Around 25,300 (support retest)
Stop Loss: 25,145
Target: 25,720+
#US100 #NASDAQ100 #PriceAction #TradingSetup #TechnicalAnalysis #ChartAnalysis #BuySetup #TradingView #SmartMoney #Forex #Indices
Nasdaq Fails to Return to Record HighsOver the past six trading sessions, the Nasdaq index has begun to show a notable bearish correction of more than 2.6% in the short term, reinforcing a downward bias that remains active at this stage. So far, the selling pressure has persisted as the market grows increasingly concerned about the performance of several companies linked to artificial intelligence, which have maintained significant valuations without yet reporting profits strong enough to justify those price levels. This situation has started to raise warning signals and trigger a short-term decline in confidence, which, if sustained, could become a key driver of stronger selling pressure in Nasdaq movements over the coming sessions.
Uptrend Still Holding
Despite recent corrections, the Nasdaq index has managed to preserve a steady upward trendline since around April 14 of this year, and so far, there has not been a strong enough sell-off to cause a meaningful break of this trend in the short term. However, if the current selling pressure continues, it could increase the risk of weakening the buying trendline, which has recently entered a phase of consolidation or pause over the past few sessions.
RSI
The RSI indicator line remains oscillating close to the 50 level, suggesting a technical balance between buying and selling strength over the average impulses of the last 14 trading sessions. As long as this behavior persists, the market may enter a more pronounced phase of indecision in the short term, reflecting the absence of a clear directional bias in price movements.
MACD
The MACD indicator, meanwhile, has started to show a neutral pattern, as its histogram continues to approach the zero line. This indicates indecision in the strength of short-term moving averages and could be signaling the formation of a more significant technical neutrality, where the market seeks an equilibrium point before defining a new directional move.
Key Levels to Watch:
26,000 points – Main resistance: Corresponds to the recent record highs and stands as the most important bullish barrier to watch. Movements that manage to hold above this level could confirm a stronger buying bias, potentially allowing the uptrend to continue on the chart.
25,115 points – Near support: This zone coincides with the most recent price retracements and could act as a technical barrier against potential short-term downward corrections.
23,800 points – Critical support: This level corresponds to the 23.6% Fibonacci retracement on the chart. Bearish movements that reach and break below this area could put the current trendline at risk and generate a stronger selling bias in the short term.
Written by Julian Pineda, CFA – Market Analyst

US NAS 100Preferably suitable for scalping and accurate as long as you watch carefully the price action with the drawn areas.
With your likes and comments, you give me enough energy to provide the best analysis on an ongoing basis.
And if you needed any analysis that was not on the page, you can ask me with a comment or a personal message.
Enjoy Trading ;)

NAS100 Trade Set Up Nov 6 2025Price is bullish making HH/HL on the 1h and BOS of the Asia range so i will wait for price to sweep internal SSL and/or tap into 1h FVG to then look for 1m-5m IFVG/CISD to take buys to PDH and daily FVG to fill the imbalance

NAS100 H4 | Bearish Reaction off FVGNAS100 is now rising towards our sell entry at 25,883, which aligns with the H4 Fair Value Gap and 71% Fibonacci retracement. We shall see how price reacts to this area after it breaks through the previous 2 swing high resistance levels.
The stop loss is at 26,167, which is a swing high resistance level, while the take profit is at 25,313, which is a swing low support level.
Once price reacts bearishly, do take note of the above swing low support level at 25,581 as well.
Stratos Markets Limited (tradu.com/uk ):
CFDs are complex instruments and come with a high risk of losing money rapidly due to leverage. 68% of retail investor accounts lose money when trading CFDs with this provider. You should consider whether you understand how CFDs work and whether you can afford to take the high risk of losing your money.
Stratos Europe Ltd (tradu.com/eu ):
CFDs are complex instruments and come with a high risk of losing money rapidly due to leverage. 70% of retail investor accounts lose money when trading CFDs with this provider. You should consider whether you understand how CFDs work and whether you can afford to take the high risk of losing your money.

nas longim looking for this,best look at 1m chart. if price on 1m holds, looking to long this.
we broken previous high already. if holds looking to enter this trade. best around usa opening timezone
