Dow Jones: Potential Explosive Move!Hey Traders,
In today's trading session we are monitoring US30 (Dow Jones) for a buying opportunity around the 48,400 zone. The index is trading in a strong uptrend and is currently in a correction phase, approaching the trend area at 48,400 support and resistance.
Trade safe,
Joe.

Dow Jones Faces Potential Downside Correction“The Dow Jones may start a bearish correction from the current price range toward 47,423. The level at 48,916.77 is critical.” CMCMARKETS:US30

US30 at a Critical Decision Zone | Fake Breakout or Trend ContinHello and welcome, dear TradingView followers 🌱
I hope you’re all doing great and trading safely.
Today, we’re going to analyze the Dow Jones Industrial Average (US30) together — one of the most important market indices that often leads overall market sentiment and risk appetite.
🔍 Chart Overview

US30 : Bullish Continuation ScenarioUS30 Holding Rising Channel Support – Bullish Continuation Scenario
US30 remains in a well-defined ascending pattern, respecting higher highs and higher lows on the intraday structure. After rejecting the upper boundary, price pulled back in a corrective move and is now finding support near the lo

DOW JONES INDEX (US30): Bullish Move From Support
US30 broke and closed above a horizontal resistance cluster
based on a previous All-Time High.
The broken structure turned into a strong support.
We see its retest this morning.
Probabilities will be high, that the market will rise
and reach at least 46726 resistance soon.
❤️Please, support m

US30 | Correctional Zone US30 – Technical Overview
US30 recorded a new all-time high near 48,870 last week, ahead of the FOMC.
For the current week, the index is showing signs of a correctional movement, with downside potential toward 48,410 and 48,080 before attempting another bullish push.
However, if the market closes

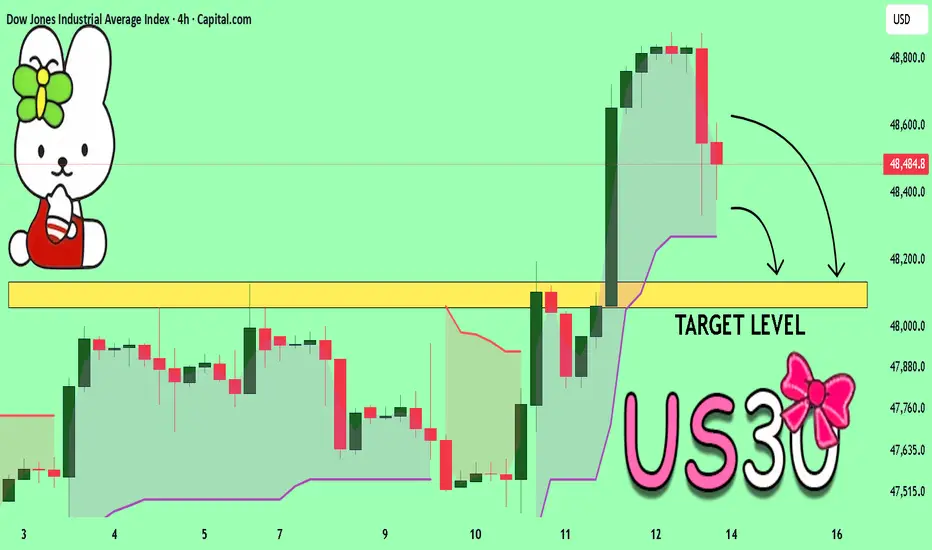
US30 A Fall Expected! SELL!
My dear followers,
I analysed this chart on US30 and concluded the following:
The market is trading on 48484 pivot level.
Bias - Bearish
Technical Indicators: Both Super Trend & Pivot HL indicate a highly probable Bearish continuation.
Target - 48132
About Used Indicators:
A super-trend indi
US30 Price consolidation bearish momentumUS30 Dow Jones price action within a rising channel structure. The index has respected the ascending trendline multiple times, confirming an overall bullish trend in recent weeks.
After reaching a local high near the upper boundary of the channel, price began to show signs of weakness and consolida

SELLS ON US30Sell order on US30. I saw a shift in momentum to the downside as marked ny the red candle on H2 time frame. i dont expect this short to work though as we are on all time highs CAPITALCOM:US30

Potential US30 Long Potential trade on US30
Trade: US30
Type: Long (Buy limit)
Entry: 48108.6 (0.5)
Entry : 47954.0 (0.382) (Major Brice point)
Entry: 47762.7 (0.236)
Sl: 47453.5
tp: 48463.3 (R/R 1/1)
tp: 49573.4 (R/R 2/1)
Confluence:
Break and retest of major price action area
On a daily up trend making (h/h and h/

See all ideas
Displays a symbol's value movements over previous years to identify recurring trends.
Frequently Asked Questions
Wall Street CFD reached its highest quote on Dec 12, 2025 — 48,887.1 USD. See more data on the Wall Street CFD chart.
The lowest ever quote of Wall Street CFD is 12,008.5 USD. It was reached on Jun 4, 2012. See more data on the Wall Street CFD chart.
Wall Street CFD is just a number that lets you track performance of the instruments comprising the index, so you can't invest in it directly. But you can buy Wall Street CFD futures or funds or invest in its components.