DJI moving according to the same analysis I chartedThis is an update to the same one mentioned, the target 53300-54000
WALLSTREETCFD trade ideas

Dow Jones/US30 crashes in the end of 2025 !!the chart clearly shows the target and it will last the upward wave to October -December 2025 😁
between 49000-52000
it is the opinion of the Writer 😁

Us30 Trade Set Up Sep 25 2025Price is now in a bearish trend making LH/LL and has broken PDL but is approaching a SSL so if price sweeps it, closes above and making internal structure creating 1m IFVG/CISD i will look for buys to the 1h FVG, and is it trades through the 1h FVG the end target will be 50% of the 4h FVG. But if prices respects the 1h FVG, I will look for bearish structure from there to continue lower
www.tradingview.com

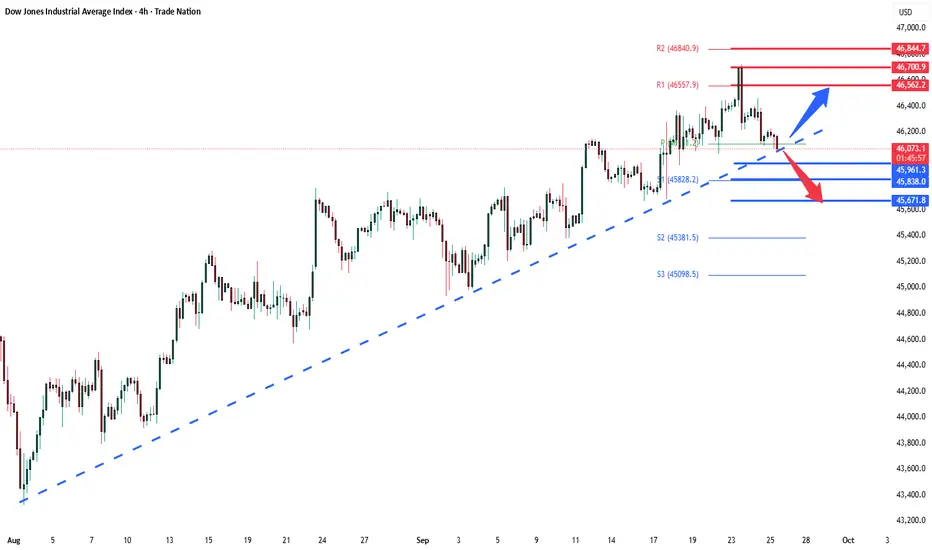
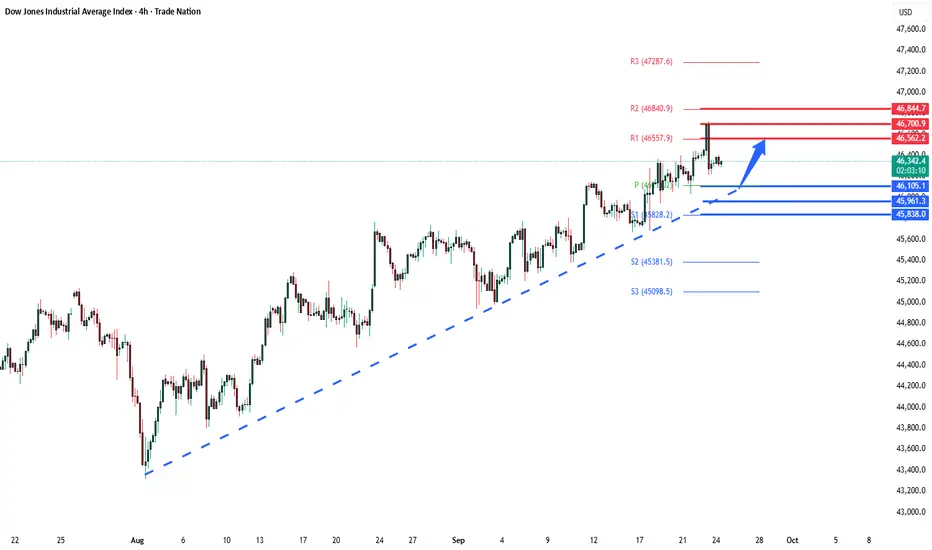
Dow corrective pullback - pivotal zone!Key Support and Resistance Levels
Resistance Level 1: 46560
Resistance Level 2: 46700
Resistance Level 3: 46845
Support Level 1: 46100
Support Level 2: 45960
Support Level 3: 45840
This communication is for informational purposes only and should not be viewed as any form of recommendation as to a particular course of action or as investment advice. It is not intended as an offer or solicitation for the purchase or sale of any financial instrument or as an official confirmation of any transaction. Opinions, estimates and assumptions expressed herein are made as of the date of this communication and are subject to change without notice. This communication has been prepared based upon information, including market prices, data and other information, believed to be reliable; however, Trade Nation does not warrant its completeness or accuracy. All market prices and market data contained in or attached to this communication are indicative and subject to change without notice.

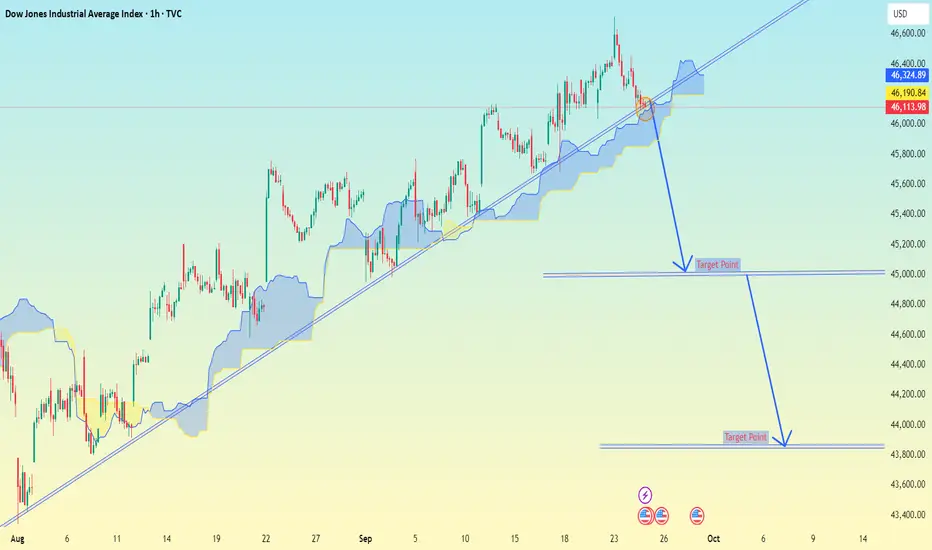
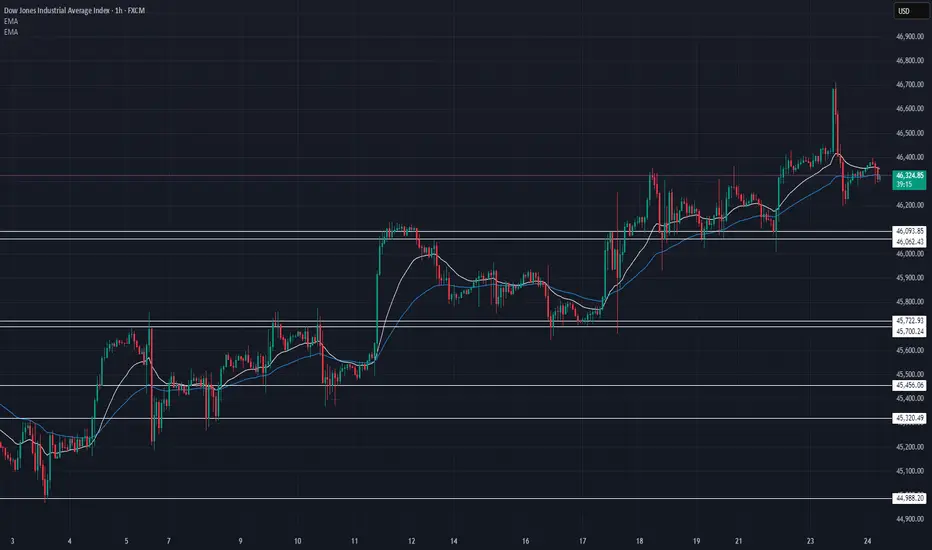
Dow Jones Industrial Average (DJI) on the 1-hour timeframe.Dow Jones Industrial Average (DJI) on the 1-hour timeframe.
From the chart:
The uptrend line is being tested.
There are two downside target points marked if the trendline breaks.
📉 Target levels shown on the chart:
1. First target zone: around 45,000 – 45,100
2. Second target zone: around 43,800 – 44,000
So if the price breaks the ascending trendline and confirms below it, the next expected supports are roughly:
45,000 area (first support/target)
43,800 area (second support/target)
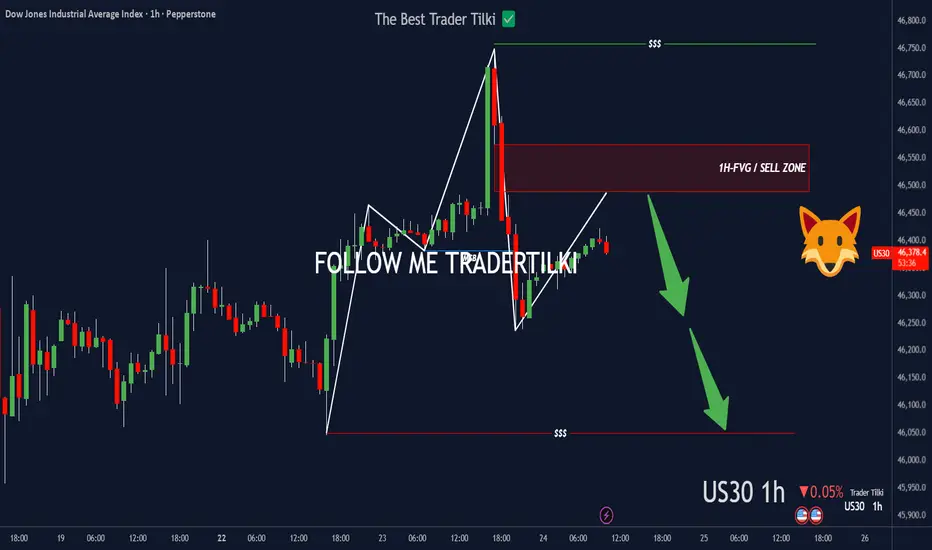
US30 left a footprint—FVG’s callin’.Hey Guys,
Once US30 hits my SELL zone, I’m pulling the trigger—targeting 46049.0
• Entry: 46574.5.0 or 46488.9
Set the stop point according to your own margin, my friends.
Every like you drop pushes me to share more setups like this. Big thanks to everyone showing support!
US30 Technical Breakdown – 09/25/2025📍 US30 Technical Breakdown – 09/25/2025
US30 dipped into the 46,100–46,000 support zone and held. Buyers stepped in right at demand, keeping the structure intact ✅.
📊 Market Behavior:
🔹 Strong defense of 46K support
🔹 Consolidating after rejection near 46,700
🔹 Bulls need 46,300+ reclaim for momentum
📌 Key Levels:
🔹 Resistance Zones:
46,300 → First hurdle for buyers
46,430 → Short-term breakout trigger
46,700 → Major top to break
🔹 Support Zones:
46,150 → Current intraday support
46,000 → Must hold for bulls
45,722 → Strong demand area
🧠 Bias:
Neutral → leaning bullish 🟢
Above 46K = healthy structure
Break below 45,700 = bearish shift ⚠️
US30 Consolidation remains firmly within a strong bullish trendThe US30 has recorded a new high zone, extending its rally as markets continue to react positively to supportive macroeconomic conditions. Optimism is being driven largely by expectations of Federal Reserve interest rate cuts, while strong consolidation in the broader market further underpins sentiment.
A Price action remains firmly within a strong bullish trend as long as the index trades above 46,000. Sustained momentum above this key support level is likely to open the path towards the 47,200 resistance zone, potentially paving the way for further upside in the near term.
You any find more details in the chart,
Trade wisely best of Luck.
Ps; Support with like and comments for better analysis Thanks for Supporting.

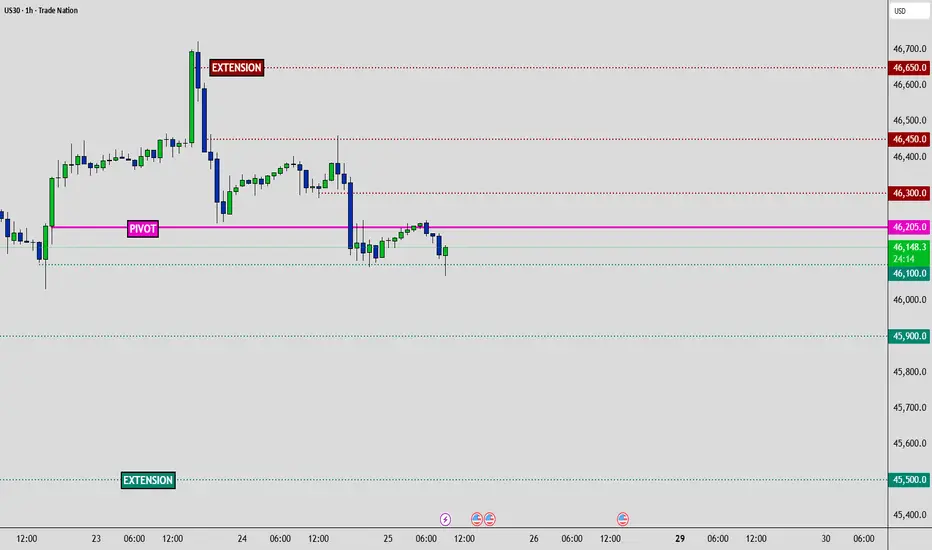
US30 - 2 Day Traders Edge📈Technical:
MARKET BIAS: Neutral-Bullish above PIVOT (holding above HVN level, testing resistance)
PIVOT ZONE: 46,205 (Current HVN magnet)
🥇 Traders Edge - Actionable & Tactical
TRADE SETUPS:
🟧 Risk Warning: Core PCE surprise = 200+ point moves
↕️ Bias Flip: Break below 46,100 (bearish) | above 46,450 (bullish)
🟢BULLISH Potential if PIVOT holds -
• Bounce from Pivot area 46300 | 46450
• Stop Loss: 46,050
🔴BEARISH Potential -
• Look for SHORT Entries: Rejections at 46300 and/or below PIVOT @ 46205
• Take Profit: 45900 | 45500 Extended Breakdown
• Stop Loss: Above 46300
🎯KEY LEVELS:
• Strong Resistance: 46,300 | 46,450 | 46,650
• Strong Support: 46,100 | 45,900 | 45,700 | 45,500
🎯PRICE TARGETS:
• Bullish Path: 46,300 → 46,450 → 46,650 (Extended breakout)
• Bearish Path: 46,100 → 45,900 → 45,500 (Extended breakdown)
🚨HIGH-IMPACT EVENTS (48H): (NY Time Zone)
• Sep 25 | 08:30 Core Durable Goods: -0.1% vs 1.1% → Manufacturing health
• Sep 25 | 08:30 GDP Q2 Final: 3.3% vs -0.5% → Growth = equity bullish
• Sep 26 | 08:30 Core PCE MoM: 0.2% vs 0.3% → RATE REPRICING RISK
• Sep 26 | 08:30 Personal Income: 0.3% vs 0.4% → Corporate earnings proxy
🛑 MASTER RISK EVENT
🟧Friday September 26 | 08:30 (NY Time Zone)
🟧 Core PCE Price Index (MoM) - Forecast: 0.2% vs Previous: 0.3%
🟧 Critical Impact: Fed's preferred inflation gauge determines rate path and USD strength
• Gold: Collapse risk if hot print
• Equities: Rate repricing volatility
• Sectors: Tech rotation sensitivity
⚠️ RISK MANAGEMENT PROTOCOL
• Reduce position sizes before Friday 08:30 EDT
• USD strength reversals impact Gold heavily
• Tech high beta to rate repricing
• Month-end flows amplify volatility
________________________________________
Analysis based on Session Volume POC clusters and HVN methodology
US30 H4 | Bearish drop offBased on the H4 chart analysis, we could see the price rise to the sell entry at 46,338.64, which is a pullback resistance that aligns with the 50% Fibonacci retracement and could drop from this level to the take profit.
Stop loss is at 46,676.09, which is a swing high resistance.
Take profit is at 45,762.38, which has been identified as an overlap support that lines up with the 50% Fibonacci retracement.
High Risk Investment Warning
Trading Forex/CFDs on margin carries a high level of risk and may not be suitable for all investors. Leverage can work against you.
Stratos Markets Limited (tradu.com ):
CFDs are complex instruments and come with a high risk of losing money rapidly due to leverage. 65% of retail investor accounts lose money when trading CFDs with this provider. You should consider whether you understand how CFDs work and whether you can afford to take the high risk of losing your money.
Stratos Europe Ltd (tradu.com ):
CFDs are complex instruments and come with a high risk of losing money rapidly due to leverage. 66% of retail investor accounts lose money when trading CFDs with this provider. You should consider whether you understand how CFDs work and whether you can afford to take the high risk of losing your money.
Stratos Global LLC (tradu.com ):
Losses can exceed deposits.
Please be advised that the information presented on TradingView is provided to Tradu (‘Company’, ‘we’) by a third-party provider (‘TFA Global Pte Ltd’). Please be reminded that you are solely responsible for the trading decisions on your account. There is a very high degree of risk involved in trading. Any information and/or content is intended entirely for research, educational and informational purposes only and does not constitute investment or consultation advice or investment strategy. The information is not tailored to the investment needs of any specific person and therefore does not involve a consideration of any of the investment objectives, financial situation or needs of any viewer that may receive it. Kindly also note that past performance is not a reliable indicator of future results. Actual results may differ materially from those anticipated in forward-looking or past performance statements. We assume no liability as to the accuracy or completeness of any of the information and/or content provided herein and the Company cannot be held responsible for any omission, mistake nor for any loss or damage including without limitation to any loss of profit which may arise from reliance on any information supplied by TFA Global Pte Ltd.
The speaker(s) is neither an employee, agent nor representative of Tradu and is therefore acting independently. The opinions given are their own, constitute general market commentary, and do not constitute the opinion or advice of Tradu or any form of personal or investment advice. Tradu neither endorses nor guarantees offerings of third-party speakers, nor is Tradu responsible for the content, veracity or opinions of third-party speakers, presenters or participants.

US30: Late-Cycle Pop or Pullback Setup?The 𝐃𝐨𝐰 is pressing fresh highs into a historically soft seasonal window with stretched momentum and limited follow-through. I’m initiating/adding to a daily timeframe short aiming for a retrace back into prior breakout territory. My baseline path is a drift lower toward 44,500–44,000 (T1) and then the broader demand band near 43,000–42,2500 (T2), where I’ll reassess.
This isn’t a “crash” call—just a tactical mean-reversion as macro tailwinds fade, breadth narrows and the first Fed cut shifts the narrative from “rates down” to “why they’re down.”
Technicals:
• Stretched swing: Price has stair-stepped higher with shallow pullbacks; we’re now extended above the 50/100-DMA stack with waning impulse on push days (smaller real bodies, upper wicks).
• Local resistance: Repeated stalls into the same supply shelf. I’m leaning into the most recent failed extension and fading the box.
Structure map:
• Entry: around/into the failed-break zone 46.4k area.
• Invalidation: daily close > recent spike highs around 47.7k-48.0k.
• Targets: T1 45,000–44,500 (prior ATH retest / micro-POC region); T2 44,000–43,000.
• Risk: 0.5–1.0R per add; scale in only on rejection prints or lower-highs.
Fundamentals:
1) The first Fed cut is not automatically bullish.
The Fed delivered a 25 bps cut in September and signaled more easing, which historically can coincide with late-cycle growth scares and choppier equity returns rather than a straight-line melt-up. The cut was framed around cooling activity and inflation progress. 
2) Growth data is mixed—manufacturing still weak.
The ISM Manufacturing PMI remained in contraction in August (48.7)—below the 50 expansion line—signaling ongoing softness in goods demand. That is typically a headwind for the Dow’s cyclical mix. 
3) ES500 (S&P 500) breadth is narrow; concentration risk elevated.
Mega-caps continue to dominate performance and index leadership, while equal-weight underperforms and concentration risk stays high—conditions that historically increase pullback vulnerability. 
4) Valuations are rich versus history.
FactSet’s mid-summer forward 12-month P/E for the S&P 500 hovered well above 5- and 10-year averages (>22x vs. ~19x/17x), leaving less cushion if growth wobbles or margins compress. 
5) Sentiment & seasonality aren’t tailwinds.
September/early Q4 are seasonally tricky—historically the weakest stretch for US equities—just as the market tries to price the path of cuts vs. growth. 
6) Policy & trade headline risk.
Tariff timelines and “reciprocal” duties remain in play (with officials signaling Aug-1 implementation and additional measures possible), a rolling overhang for global cyclicals and exporters tied into the Dow complex. 
Note: Please remember to adjust this trade idea according to your individual trading conditions, including position size, broker-specific price variations, and any relevant external factors. Every trader’s situation is unique, so it’s crucial to tailor your approach to your own risk tolerance and market environment.

Bullish continuation?Dow Jones (US30) is reacting off the pivot which acts as an overlap support and could bounce to the 1st resistance which has been identified as a swing high resistance.
Pivot: 46,123.56
1st Support: 45,765.51
1st Resistance: 46,704.98
Disclaimer:
The above opinions given constitute general market commentary, and do not constitute the opinion or advice of IC Markets or any form of personal or investment advice.
Any opinions, news, research, analyses, prices, other information, or links to third-party sites contained on this website are provided on an "as-is" basis, are intended only to be informative, is not an advice nor a recommendation, nor research, or a record of our trading prices, or an offer of, or solicitation for a transaction in any financial instrument and thus should not be treated as such. The information provided does not involve any specific investment objectives, financial situation and needs of any specific person who may receive it. Please be aware, that past performance is not a reliable indicator of future performance and/or results. Past Performance or Forward-looking scenarios based upon the reasonable beliefs of the third-party provider are not a guarantee of future performance. Actual results may differ materially from those anticipated in forward-looking or past performance statements. IC Markets makes no representation or warranty and assumes no liability as to the accuracy or completeness of the information provided, nor any loss arising from any investment based on a recommendation, forecast or any information supplied by any third-party.

Random Hater Fuel FireTo continue from previous ideas, we all know when Powell speaks we see a sharp decline and decided to take a sell until confirmation on 1h to continue the trend.
Great play continue on from the dollars increased weakness and haters tears. :)

Can You Escape the US30 High Voltage Trap in Time?💎 US30/DJ30 High Voltage Bullish Heist Plan 💎
💰 Asset: US30 / DJ30 Index CFD
🚀 Plan: Bullish — Thief OG Layered Buy Attack 🏴☠️
📍 Entry: Any price level — we’re layering in with the Bull Grid Strategy like a true market bandit.
🎯 Layered Buy Limits:
44,900 💵
44,700 💵
44,400 🔥
(💡 You can add more layers — the more vault doors you crack, the more loot you grab!)
🛑 Stop Loss: Thief SL @ 44,000 🛑 — adjust to your own risk appetite & strategy, ladies & gentlemen of the Thief OG Crew.
💎 Target: 46,300 🎯 — ⚡ high-voltage electric trap ahead! Escape with the stolen money at 46,200 before the market guards catch you.
🏴☠️ The Heist Blueprint 🏴☠️
We’re hitting US30 with multi-layer entries, scooping up the dip zones like professional vault breakers. The bull gang is in control — momentum, sentiment, and greed all lining up for a payday.
Rules of Engagement:
Use multiple buy limit layers — stack ‘em like gold bars.
Stick to longs only — don’t rob against the tide.
Place alerts at each limit level — no sleeping during the heist.
Use trailing SL to secure stolen profits while the robbery’s still in progress.
📊 Why Bullish?
US30 showing strong momentum fueled by market optimism, earnings strength, and liquidity flooding in. Macro vibes = bullish; sentiment = greedy. Bears? Scattered and broke.
⚠️ Risk & News Alert:
Avoid entry during high-volatility news drops — even thieves hate unpredictable explosions.
Manage positions like a pro — protect the stash.
💖 If this heist plan makes you richer or braver, hit that BOOST and join the Thief Trader Army. Every boost powers our next robbery.
🏆 We steal from the market, not from people.
See you at the vault door, Thief OGs. 🏴☠️💰🚀

Us30 Trade Set Up Sep 24 2025price pushed down hard yesterday but still made a HL on the 1h also created a 1h FVG so i will want to see a test of that, if it respects it i will look for internal 1m bearish structure to look for sells but if it trades through it i will look for buys to PDH
www.tradingview.com

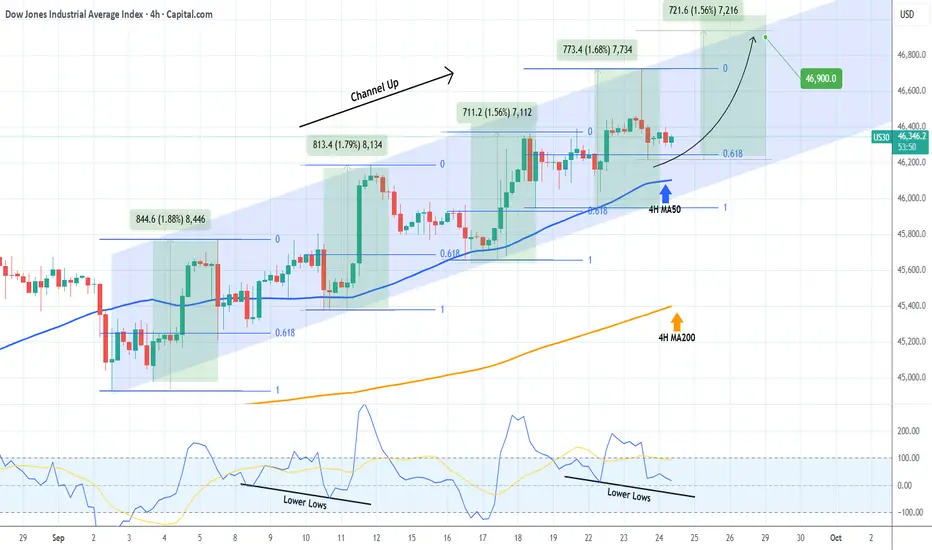
DOW JONES forming a bottom ahead of the next rally.Dow Jones (DJI) has been trading within a Channel Up since the start of September and right now it is consolidating after having hit the 0.618 Fibonacci retracement level, following a Higher High rejection at the top of the pattern.
As you can see, the 0.618 Fib was always pull-back tested after a Higher High, with the 4H MA50 (blue trend-line) also or at least coming very close to. As a result, the current 4H candle consolidation is technically a bottoming process before the new Bullish Leg.
The weakest Bullish Leg of this Channel Up has been +1.56%, which more than covers our 46900 Target.
-------------------------------------------------------------------------------
** Please LIKE 👍, FOLLOW ✅, SHARE 🙌 and COMMENT ✍ if you enjoy this idea! Also share your ideas and charts in the comments section below! This is best way to keep it relevant, support us, keep the content here free and allow the idea to reach as many people as possible. **
-------------------------------------------------------------------------------
💸💸💸💸💸💸
👇 👇 👇 👇 👇 👇
Dow overbought corrective pullback supported at 46100Key Support and Resistance Levels
Resistance Level 1: 46560
Resistance Level 2: 46700
Resistance Level 3: 46845
Support Level 1: 46100
Support Level 2: 45960
Support Level 3: 45840
This communication is for informational purposes only and should not be viewed as any form of recommendation as to a particular course of action or as investment advice. It is not intended as an offer or solicitation for the purchase or sale of any financial instrument or as an official confirmation of any transaction. Opinions, estimates and assumptions expressed herein are made as of the date of this communication and are subject to change without notice. This communication has been prepared based upon information, including market prices, data and other information, believed to be reliable; however, Trade Nation does not warrant its completeness or accuracy. All market prices and market data contained in or attached to this communication are indicative and subject to change without notice.
US30 ShortElite Strategy
Waiting price to come tap OB twice to confirm OB to TOB
Execute in smaller time frame
Targeting lower liquidity pools
Main target Structural liquidity
US30 - Short Setup – Rising Channel (4H)I'm currently eyeing a short opportunity on US30 (Dow Jones Industrial Average) based on the 4H timeframe.

US30 Technical Breakdown – 09/24/2025📍 US30 Technical Breakdown – 09/24/2025
US30 holding steady around 46,320 after yesterday’s push into the 46,700s before pulling back. Market is consolidating but still above key supports, showing buyers remain in control ✅.
📊 Current Market Behavior:
📈 Retest after breakout — healthy pullback
⚡ Buyers defending 46,000 zone strongly
🔄 Consolidation above support → bullish continuation possible
📌 Key Levels:
🔹 Resistance Zones:
46,430 → Immediate resistance
46,700 → Major upside target
47,000 → Next extension if momentum continues
🔹 Support Zones:
46,093 → First key support
45,722 → Strong demand zone
45,456 → Last line of defense for bulls
🧠 Bias:
Bullish ✅
Above 46,000 keeps momentum alive
Break below 45,700 = bearish shift
US30 Update On the low time frame, US30 is consolidating aroundUS30 Update
On the low time frame, US30 is consolidating around 46,351 – 46,398 after testing the breakout zone.
Key levels:
46,398 – 46,351 → short-term decision zone. A breakout above this area could confirm bullish continuation toward 47,170.
46,177 – 45,796 → support zone for the main uptrend. As long as price holds above this, the bullish cycle remains intact.
Upside scenario: If price reclaims and holds above 46,398, momentum strengthens for another push higher, with 47,170 as the next major resistance.
Downside risk: If price fails to hold above 46,177, deeper correction could follow, with 45,796 as first support.
Cycle level: 41,097 is the cycle start and a critical must-hold area for the long-term bullish structure.
📌 Summary
Above 46,398 → bullish continuation toward 47,170.
Hold above 46,177 – 45,796 → main uptrend safe.
Break below 45,796 → correction risk, broader weakness possible.
41,097 → cycle start and major long-term support.

[Long] US30: Dow Jones (September 23, 2025)Entry: 46319.21
SL: 46279.21
TP: 46569.21
This set up is vaild by 4am EST.
After 4am, it is not valid.
