US30 BULLISH BIAS RIGHT NOW| LONG
US30 SIGNAL
Trade Direction: long
Entry Level: 41,822.1
Target Level: 42,718.6
Stop Loss: 41,224.4
RISK PROFILE
Risk level: medium
Suggested risk: 1%
Timeframe: 9h
Disclosure: I am part of Trade Nation's Influencer program and receive a monthly fee for using their TradingView charts in my analysis.
✅LIKE AND COMMENT MY IDEAS✅
WALLSTREETMINICFD trade ideas

US30 (Dow Jones) – Major Demand Zone Hit! Will We See a ReversalThe US30 has just tapped into a high-interest demand zone around the 41,767.01 level, showing signs of bullish reaction after a strong selloff from the 42,800 supply area.
Here’s what I’m watching:
1. Demand Zone Bounce:
Price is holding above the demand zone (orange box), with increasing volume on the bounce – suggesting potential accumulation by smart money.
2. Immediate Resistance Levels:
We have two major upside targets:
42,288.87 – Minor resistance (possible retest zone)
42,810.50 – Key supply zone (major selloff origin)
3. Breakout Potential:
A break and close above 42,288.87 with strong volume could signal continuation toward the upper range.
4. Bullish Confluence:
Price is holding a bullish 15-min structure
Previous support flipped to resistance now acting as potential magnet
Double bottom structure visible within the demand range
Trading Idea:
If the demand zone holds and price breaks 42,012 resistance, I’ll look for longs targeting 42,800+, with stops below the recent low.
What do you think? Will US30 rocket from here or crash through the floor?
Like if you're watching this zone.
Comment your target for this week – bull or bear?

Short after liquidity grabThere we see it smooth.
Us30. I have not much to say but to just wait for profit

Dow Jones Index (US30): Time to Grow
As I predicted yesterday, US30 nicely respected
a wide daily support cluster.
A pullback from that is now confirmed with a violation
of a minor horizontal resistance on a 4H.
The index may reach 42200 level soon.
❤️Please, support my work with like, thank you!❤️
I am part of Trade Nation's Influencer program and receive a monthly fee for using their TradingView charts in my analysis.

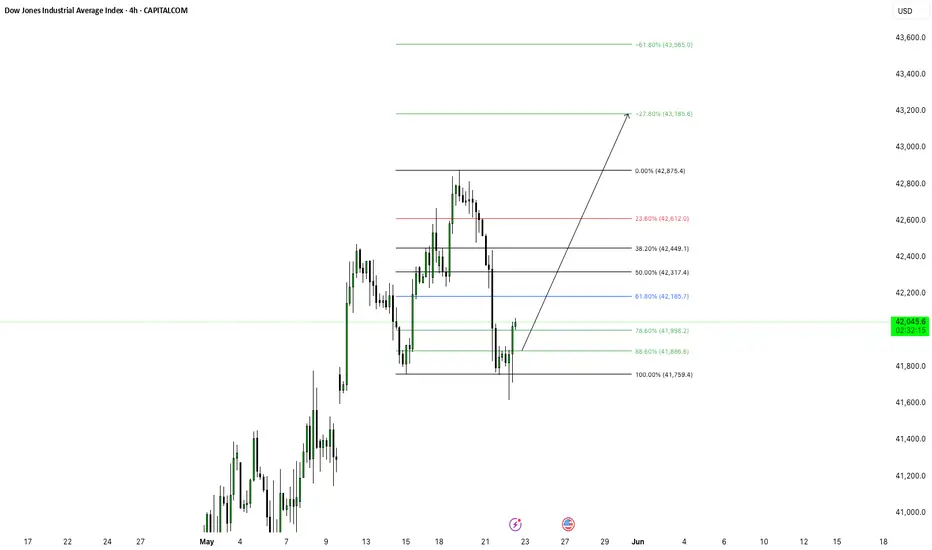
Potential bearish drop?Dow Jones (US30) is rising towards the pivot, which lines up with the 61.8% Fibonacci retracement and could drop to the 1st support.
Pivot: 42,435.88
1st Support: 41,294.81
1st Resistance: 43,025.39
Risk Warning:
Trading Forex and CFDs carries a high level of risk to your capital and you should only trade with money you can afford to lose. Trading Forex and CFDs may not be suitable for all investors, so please ensure that you fully understand the risks involved and seek independent advice if necessary.
Disclaimer:
The above opinions given constitute general market commentary, and do not constitute the opinion or advice of IC Markets or any form of personal or investment advice.
Any opinions, news, research, analyses, prices, other information, or links to third-party sites contained on this website are provided on an "as-is" basis, are intended only to be informative, is not an advice nor a recommendation, nor research, or a record of our trading prices, or an offer of, or solicitation for a transaction in any financial instrument and thus should not be treated as such. The information provided does not involve any specific investment objectives, financial situation and needs of any specific person who may receive it. Please be aware, that past performance is not a reliable indicator of future performance and/or results. Past Performance or Forward-looking scenarios based upon the reasonable beliefs of the third-party provider are not a guarantee of future performance. Actual results may differ materially from those anticipated in forward-looking or past performance statements. IC Markets makes no representation or warranty and assumes no liability as to the accuracy or completeness of the information provided, nor any loss arising from any investment based on a recommendation, forecast or any information supplied by any third-party.

uptrendIt is expected that the downward trend will end within the current support range and we will see the beginning of the upward trend. If the support range is broken, a continuation of the downward trend to the next support levels is possible.

US30 Scalp Idea ...Market didn't give us Confirmation but market take the LQ not the very high probable trade but worth to take the little risk,

Hanzo / US30 15m Path ( Confirmed Breakout Zones )🆚 US30
The Path of Precision – Hanzo’s Market Strike
🔥 Key Levels & Breakout Strategy – 15M TF
☄️ Bearish Setup After Break Out – 41750 Zone
Price must break liquidity with high volume to confirm the move.
☄️ Bullish Setup After Break Out – 41950 Zone
Price must break liquidity with high volume to confirm the move.
🩸 15M Time Frame Confluence
————
CHoCH & Liquidity Grab @ 41820
Key Level / Equal lows Formation - 41600
Strong Rejection from 42000 – The Ultimate Pivot
Strong Rejection from 41450 – The Ultimate Pivot
🔥 1H Time Frame Confirmation
Twin Wicks @ 41750 – Liquidity Engineered
Twin Wicks @ 41450 – Liquidity Engineered

US30 - LONGPrice had the big drop as expected. Didn't quite fill the gap that I thought it would. But seeing that price has now changed momentum on the higher time frames, I am expecting it to continue to rise and create a higher high.
Support and resistance bosAfter support or resistance the market will sweep liquidity and create the first bos .the market will return to the bos with immediate effect to push the price up or down

US30... theory to take out the gapAs the high hit the resistance level early yesterday and the pattern ( Head and Shoulders ) formed more today on the HTF, I think the best way to close the gap will be a complete Head and Shoulder pattern.

One of my FAVOURITE ENTRY MODELS!!!!AMD is one of my favourite ways to get into the market. Tom Camp, my mentor, has taught me this. Accumulation, Manipulation, and Distribution is known as AMD which is a certain movement in price with in a range. When price Accumulates it consolidates, engineering liquidity on both sides of the market. When price Manipulates it targets either buy-side or sell-side liquidity first then it will target the buyside or sell-side liquidity. Meaning if you're in a bullish environment and price pulls into a HTF POI on a LTF price displays AMD where it will target buy-side liquidity first then target sell-side liquidity and price will reverse. When price distributes it retraces back into the range created in the Manipulation phase. Normally Manipulation phase price displaces or there is an inverse FVG or FVG or OB you can enter off of.

sell US30📉 Technical Indicators
As of May 22, 2025, at 1:05 PM GMT, the Dow Jones 30 Futures show the following:
Investing.com
Price: 41,880.00 USD
Technical Summary: Strong Sell
Moving Averages: Strong Sell (12 out of 12 indicators)
Technical Indicators: Strong Sell (7 out of 7 indicators)
Investing.com
+1
TradingView
+1
Key indicators include:
RSI (14): 31.72 (approaching oversold territory)
MACD (12,26): -151.76 (bearish)
CCI (14): -260.43 (oversold)
Williams %R: -0.503 (overbought)
Stochastic RSI (14): 100 (overbought)
FastBull
+5
Investing.com
+5
TradingView
+5
🔍 Footprint Chart Insights
Footprint charts, which display executed buy and sell orders at specific price levels, are valuable for assessing market sentiment. Currently, the charts indicate:
Optimus Futures
+1
Wikipedia
+1
Investing.com
Sell Imbalances: Higher volume of sell orders at key price levels, suggesting strong selling pressure.
Point of Control (POC): Located at lower price levels, indicating that the majority of trading volume is occurring at these prices, reinforcing the bearish sentiment.
Lack of Buy Imbalances: Minimal indications of strong buying interest at current levels.
📊 Market Sentiment
Recent analyses from trading communities suggest a bearish outlook for US30. For instance, a TradingView analysis notes that US30 is reacting from a strong demand zone (42,400 - 42,500), showing a possible reversal after a liquidity grab below recent lows. However, the overall trend remains bearish, and traders are advised to watch price action closely and confirm momentum before entering.
TradingView
+1
TradingView
+1
TradingView
✅ Conclusion
Given the prevailing technical indicators and order flow data, the US30 is currently in a bearish phase. Traders should exercise caution and consider waiting for clear signs of reversal or stabilization before entering long positions. Monitoring key support levels and staying updated with market news will be crucial in the coming days.
For a visual understanding of US30 order flow trading, you might find this video insightful:

US30/Dow Jones Trade IdeaThis is what I believe could be cooking up currently on US30... A possible buyers control might be coming up the coming days as it looks like price is possibly heading for HTF FVG.
Remember this is just a trade idea and nothing is completely guaranteed to play out the way I'm anticipating... Following this trade idea will be on your own risk!
#us30 #dowjones #indices #nasdaq #german30 #dax

DOW JONES INDEX (US30): Your Plan to Buy Explained
There is a high chance that US30 will resume growth soon.
The index is currently testing a wide daily support cluster.
My signal to buy will be a bullish violation and a candle close above
41920 minor horizontal resistance.
A bullish movement will be anticipated at least to 42200 level then.
❤️Please, support my work with like, thank you!❤️
I am part of Trade Nation's Influencer program and receive a monthly fee for using their TradingView charts in my analysis.

Dow Jones Short Term Sell Trading PlanM15 - Strong bearish momentum
Lower lows on the moving averages of the MACD indicator.
Until the two Fibonacci resistance zones hold I expect the price to continue lower further.
If you enjoy this idea, don’t forget to LIKE 👍, FOLLOW ✅, SHARE 🙌, and COMMENT ✍! Drop your thoughts and charts below to keep the discussion going. Your support helps keep this content free and reach more people! 🚀
--------------------------------------------------------------------------------------------------------------------
Disclosure: I am part of Trade Nation's Influencer program and receive a monthly fee for using their TradingView charts in my analysis.
