US30 - Giant Break OutDear Friends in Trading,
Keynote:
As long as price remains above 45000, potential for more
Bullish continuation remains high.
Especially after yesterday's sentiment for September.
Quality:
It's a giant break-out candle.
This candle has the potential to serve as all 4 functions going forward.
I sincerely hope my point of view offers a valued insight
Thank you for taking the time study my analysis.
PS:
I really apologies for changing the format again.
I am aiming to find the golden thread between my eyes for work,
and simplified clarity for ideas.
I will settle on a standard template soon.
WALLSTREETMINICFD trade ideas

Dow Jones: Will It Finally Break All-Time Highs?While SPX 500 and Nasdaq have already smashed their all-time highs, Dow Jones is still grinding toward its breakout. In this analysis, I’ll break down the current consolidation phase, key Fibonacci levels, and precise long triggers to watch. We’ll zoom into daily and lower time frames to find actionable entries, manage risk, and avoid FOMO.
Clear, skeptical, and to the point. 🔮
Trade smart, keep risk tight, and don’t FOMO. Share your thoughts in the comments, boost if it helps <3

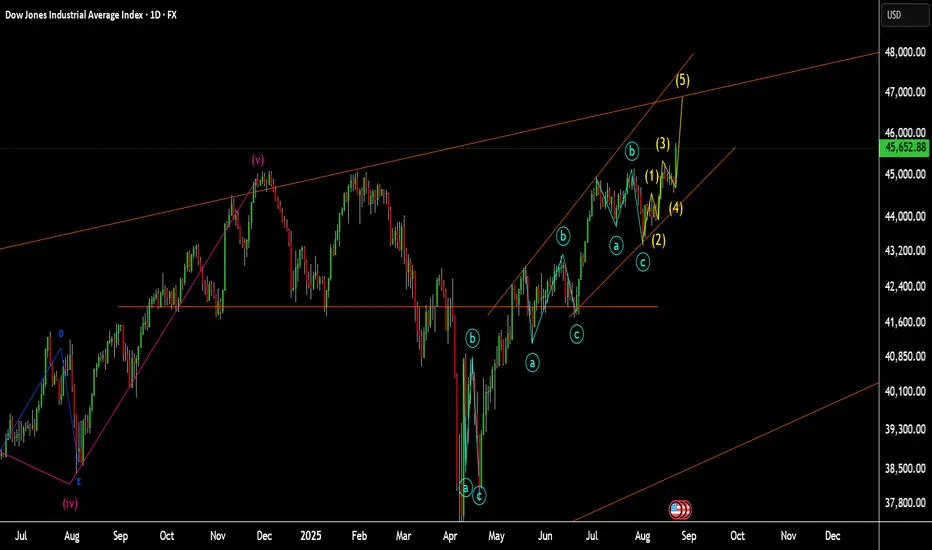
US30 in 5th waveUS30 in 5th wave
this is next long wave that start
so I assume it moves to the top resistance.
US30in my opinion, If the price reaches the range with a three push divergence, US30 will definitely fall below the specified bottom.
If this scenario doesn't happen, we have a pattern AB=CD upwards and then we will definitely fall to the specified bottom.
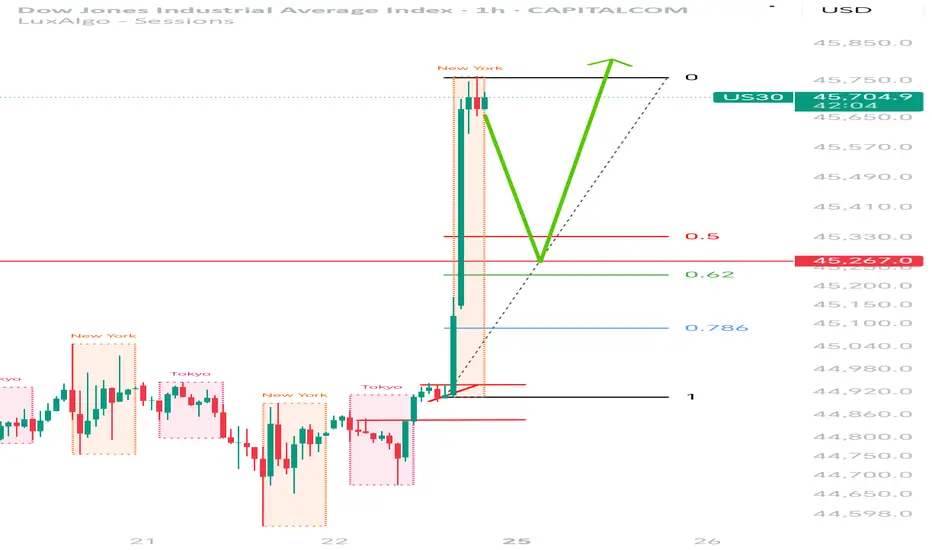
US30 New Record HighUS30 has registered a new record high.
I'm anticipating price to retrace towards the previously broken resistance level, which could act as a new support zone upon retest. I've pulled out my Fibonacci retracement tool📉📊, with particular attention to the golden ratio levels (0.618–0.65) as potential areas of interest for trade execution.🚀🎯🔥
Dow breaks Dow breaks if it sustains then market can give a handsome return following the fed rate cut

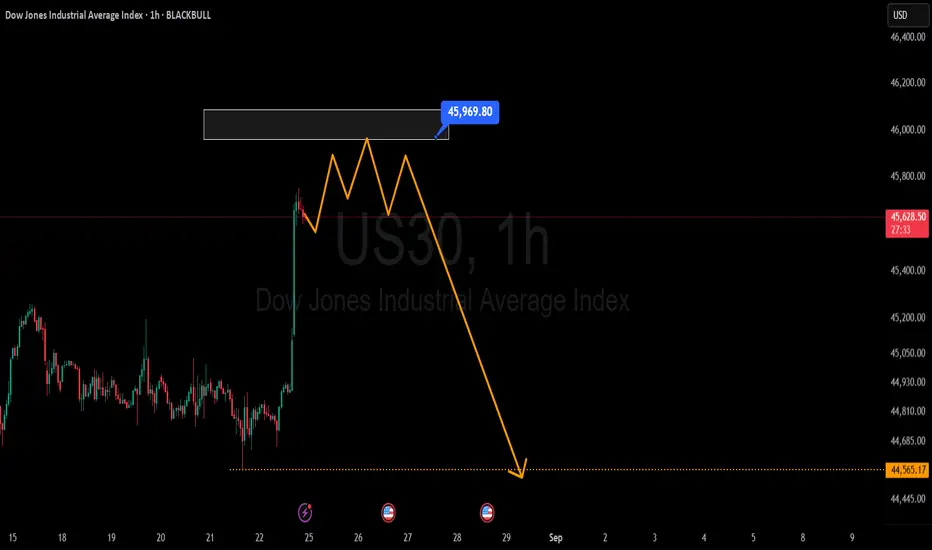
DOW JONES INDEX completed its 5 WAVES UP, what's next?Powell's speech this morning boosted the market up and creating a new high.
BUT.. It also completed the last impluse wave, wave 5.
Next movement, whether to be a correction or a massive trend reversal shoud be DOWN.
So i am SHORTING now.. A-B-C correction is going to happen anytime soon!
My expectation is 1-2 weeks ahead is correction time.
LET'S GO!

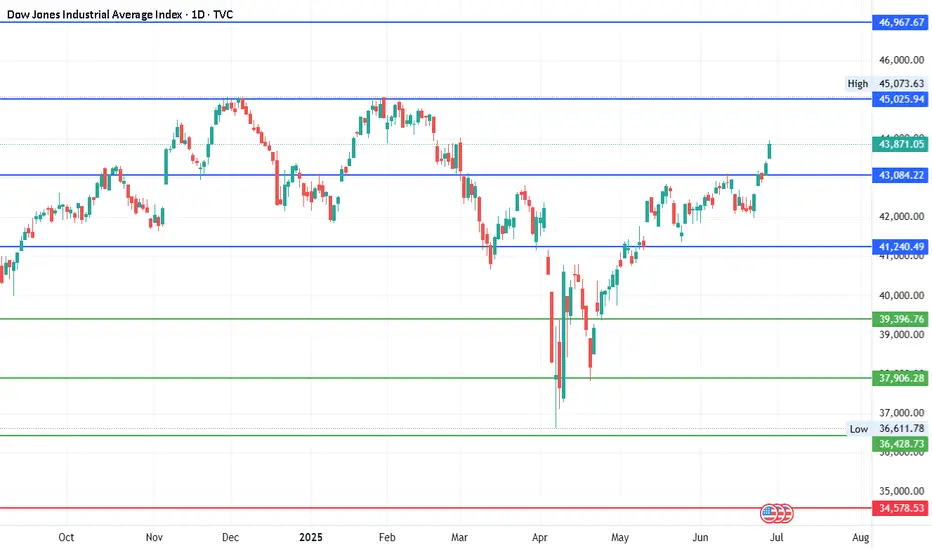
#DJI - 5000 Pts already moved out of 8000 points..Date: 27-06-2025
#DJI - 5000 Pts already moved out of 8000 points as posted on 22nd April. Another 3000 points to cover. we have different pivot for the next level up and it will be shared soon.
Old levels are as follows.
#DJI Upside Targets: 41240.49, 43084.22, 45025.94 and 46967.67
#DJI Downside Targets: 34578.53, 32728.34, 30786.61 and 28844.88
Current price is around 43,870 at the time of this post.
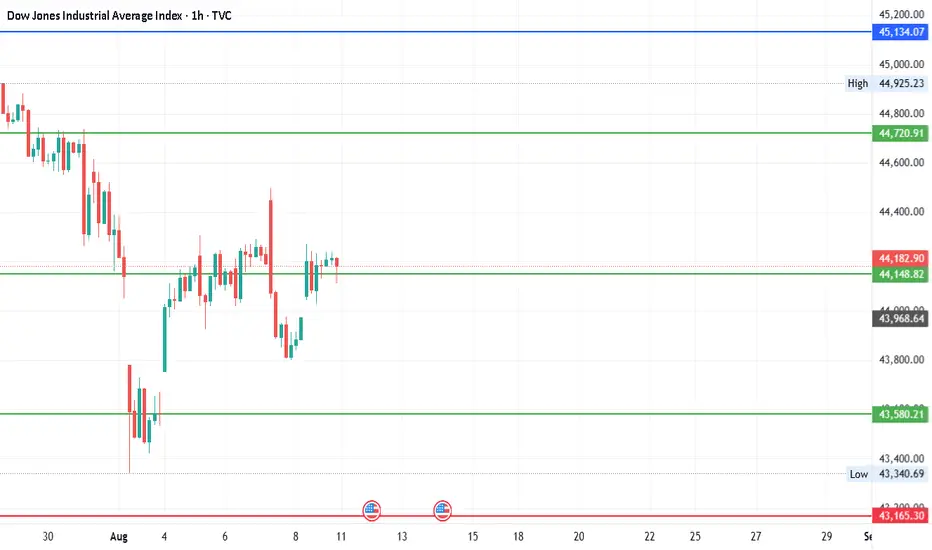
#DJI - Levels for Aug 2025Date: 09-08-2025
#DJI - Current Price: 44175.61
Pivot Point: 44149 Support: 43580 Resistance: 44721
#DJI Upside Targets:
| 🎯 Target 1 | 45134 |
| 🎯 Target 2 | 45547 |
| 🎯 Target 3 | 46072 |
| 🎯 Target 4 | 46596 |
#DJI Downside Targets:
| 🎯 Target 1 | 43165 |
| 🎯 Target 2 | 42750 |
| 🎯 Target 3 | 42226 |
| 🎯 Target 4 | 41702 |
#TradingView #Nifty #BankNifty #DJI #NDQ #SENSEX #DAX #USOIL #GOLD #SILVER
#BHEL #HUDCO #LT #LTF #ABB #DIXON #SIEMENS #BALKRISIND #MRF #DIVISLAB
#MARUTI #HAL #SHREECEM #JSWSTEEL #MPHASIS #NATIONALUM #BALRAMCHIN #TRIVENI
#USDINR #EURUSD #USDJPY #NIFTY_MID_SELECT #CNXFINANCE
#SOLANA #ETHEREUM #BTCUSD #MATICUSDT #XRPUSDT
#Crypto #Bitcoin #BTC #CryptoTA #TradingView #PivotPoints #SupportResistance
All time high. Down next couple of months. Then up again.Easy roadmap. We hit a nice all time high today. Great moment for a short position now untill early 2026.

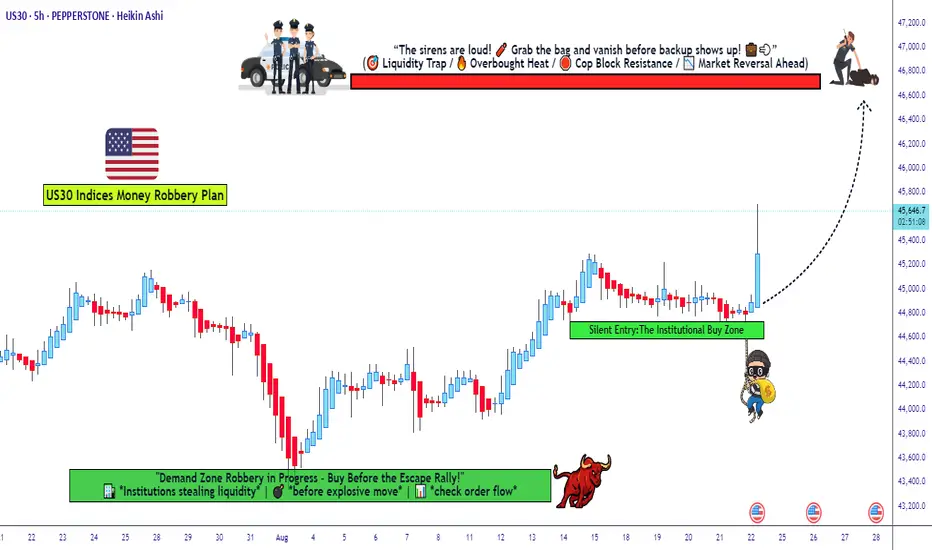
Dow Jones Bulls Preparing Another Robbery — Are You In?🚨💰 US30/DJ30 Index CFD Market Heist Plan 🏦🎭
🕵️ Dear Thief OG’s, Ladies & Gentlemen of the robbery squad… the vault is wide open again! This time we’re sneaking into the Dow Jones (US30) for a Bullish Day/Swing Heist. 🔥
🎯 Robbery Blueprint
Asset: US30/DJ30 Index CFD (Day/Swing Trade)
Plan: Bullish 📈
Entry (Thief Style):
The thief never knocks once… we layer the doors! Multiple buy limit orders 🔐:
Layer 1 → 45,600.0
Layer 2 → 45,400.0
Layer 3 → 45,200.0
(You can expand the layers depending on your risk appetite 🕳️)
Stop Loss (SL) 🛑:
📍 Thief SL @ 44,600.0
(Adjust based on your own risk & startergy – remember, survival is key in every robbery 🏃💨)
Target (TP) 🎯:
🚓 Police barricade spotted @47,000.0! Our sweet escape is planned at 46,800.0 before sirens catch us. 💰
🏆 Thief Strategy
Multiple limit order entries (layering method / scaling in).
Enter at any price level if you’re fast, but layering is the OG Thief move.
Manage your SL & risk like a pro robber – no reckless moves, or you’ll end up behind market bars! 🚔
💡 Why This Heist? 💡
The US30/DJ30 is primed for a bullish run 📈, driven by real-time market signals:
Technical Analysis: Strong support levels holding firm, momentum indicators screaming bullish! 📊
Fundamental Outlook: Check global market data, COT reports, and sentiment analysis for confirmation. 🔗👉
Volatility Watch: Stay sharp for news releases that could spike volatility. 📰⚠️
⚠️ Thief’s Risk Management ⚠️
News Alert: Avoid new trades during major news drops to dodge wild price swings. 🚫
Position Management: Use trailing stops to lock in those sweet profits. 🔐
Risk Control: Adjust lot sizes and SL based on your layered entries and risk profile. 📉
🏆 Join the Heist! 🏆
💥 Hit the Boost Button 💥 to power up our Thief Trader crew! 🚀 Let’s make bank with ease using the Thief Trading Style! 💸😎 Stay tuned for the next heist plan, and let’s keep robbing the markets! 🤑🐱👤
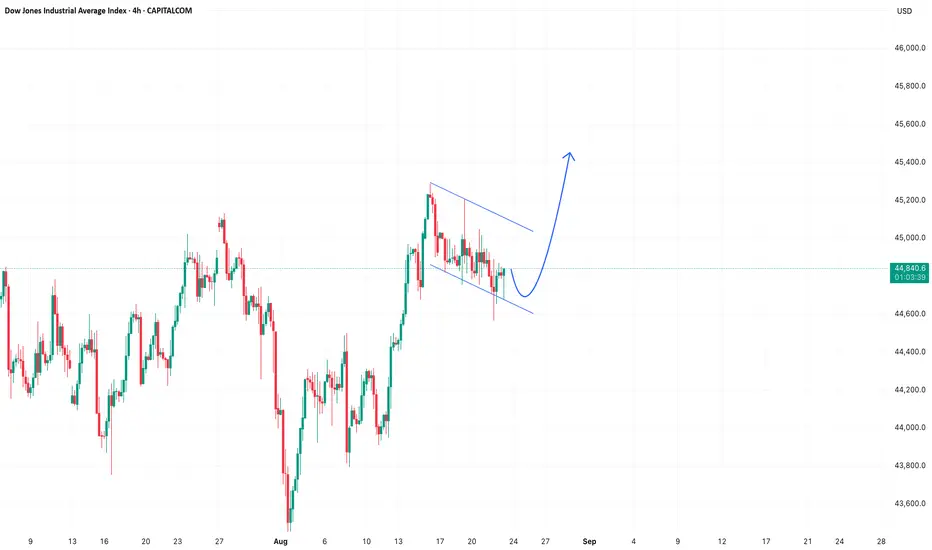
US30US30 has completed its correction phase and is now preparing for a new bullish wave. With momentum building, traders should watch for confirmation signals that could indicate the start of another upward move.
US3o Trade Set Up Aug 22 2025www.tradingview.com
FX:US30
Us30 Trade Set Up: price is making HH/HL on the 1h and is close to testing PDH, so i will wait to see if price closes above HH and PDH to continue higher towards BSL or if price sweeps PDH as liquidity, closes under and forms internal IFVG+CISD to go lower towards HL/PDL

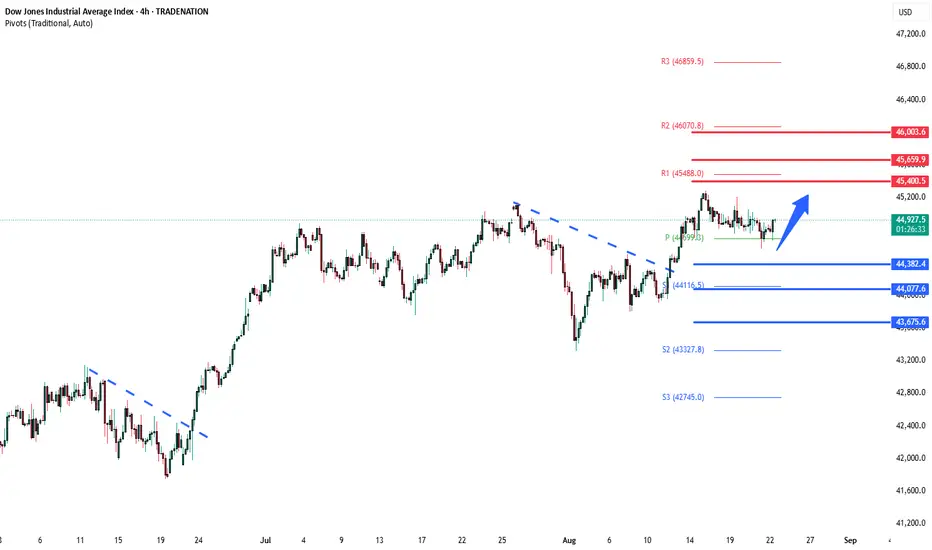
DowJones Key Trading levels ahead of Powell's testimonyKey Support and Resistance Levels
Resistance Level 1: 45400
Resistance Level 2: 45660
Resistance Level 3: 46000
Support Level 1: 44380
Support Level 2: 44080
Support Level 3: 43675
This communication is for informational purposes only and should not be viewed as any form of recommendation as to a particular course of action or as investment advice. It is not intended as an offer or solicitation for the purchase or sale of any financial instrument or as an official confirmation of any transaction. Opinions, estimates and assumptions expressed herein are made as of the date of this communication and are subject to change without notice. This communication has been prepared based upon information, including market prices, data and other information, believed to be reliable; however, Trade Nation does not warrant its completeness or accuracy. All market prices and market data contained in or attached to this communication are indicative and subject to change without notice.
US30 | Fed Meeting in Focus, Bearish Pressure Below 44950US30 (Dow Jones) – Market Outlook
Wall Street futures subdued with retail earnings and Fed meeting in focus
Market sentiment remains cautious ahead of the Federal Reserve meeting, with price action expected to stay sensitive to policy signals.
Technical Outlook
Bearish Scenario:
As long as price trades below the pivot line at 44,950, the bias remains bearish toward 44,720 and 44,610.
Bullish Scenario:
A confirmed 1H or 4H close above 44,950 would shift momentum to the upside, opening the way for 45,100 and 45,285.
📍 Key Levels
Pivot: 44,950
Support: 44,820 – 44,720 – 44,610
Resistance: 45,100 – 45,285

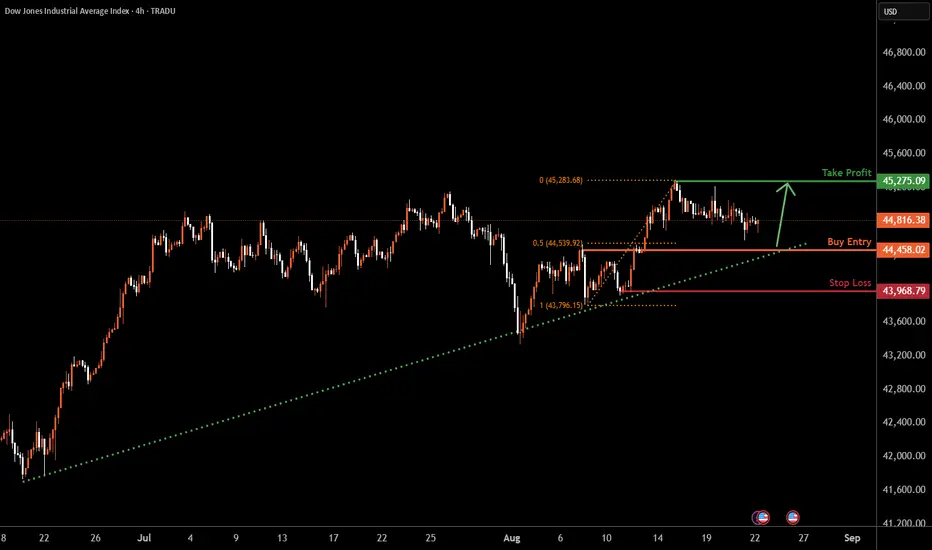
US30 H4 | Bullish momentum to extendUS30 is falling towards the buy entry, which is a pullback support that lines up with the 50% Fibonacci retracement and could bounce from this level to the take profit.
Buy entry is at 44,458.02, which is a pullback support that aligns with the 50% Fibonacci retracement.
Stop loss is at 43,968.79, which is a pullback support.
Take profit is at 45,275.09, which is a pullback resistance.
High Risk Investment Warning
Trading Forex/CFDs on margin carries a high level of risk and may not be suitable for all investors. Leverage can work against you.
Stratos Markets Limited (tradu.com ):
CFDs are complex instruments and come with a high risk of losing money rapidly due to leverage. 65% of retail investor accounts lose money when trading CFDs with this provider. You should consider whether you understand how CFDs work and whether you can afford to take the high risk of losing your money.
Stratos Europe Ltd (tradu.com ):
CFDs are complex instruments and come with a high risk of losing money rapidly due to leverage. 66% of retail investor accounts lose money when trading CFDs with this provider. You should consider whether you understand how CFDs work and whether you can afford to take the high risk of losing your money.
Stratos Global LLC (tradu.com ):
Losses can exceed deposits.
Please be advised that the information presented on TradingView is provided to Tradu (‘Company’, ‘we’) by a third-party provider (‘TFA Global Pte Ltd’). Please be reminded that you are solely responsible for the trading decisions on your account. There is a very high degree of risk involved in trading. Any information and/or content is intended entirely for research, educational and informational purposes only and does not constitute investment or consultation advice or investment strategy. The information is not tailored to the investment needs of any specific person and therefore does not involve a consideration of any of the investment objectives, financial situation or needs of any viewer that may receive it. Kindly also note that past performance is not a reliable indicator of future results. Actual results may differ materially from those anticipated in forward-looking or past performance statements. We assume no liability as to the accuracy or completeness of any of the information and/or content provided herein and the Company cannot be held responsible for any omission, mistake nor for any loss or damage including without limitation to any loss of profit which may arise from reliance on any information supplied by TFA Global Pte Ltd.
The speaker(s) is neither an employee, agent nor representative of Tradu and is therefore acting independently. The opinions given are their own, constitute general market commentary, and do not constitute the opinion or advice of Tradu or any form of personal or investment advice. Tradu neither endorses nor guarantees offerings of third-party speakers, nor is Tradu responsible for the content, veracity or opinions of third-party speakers, presenters or participants.
US30 CPI trade idea 12-aug-2025Expecting sharp move down side at cpi event, an dgrap sell side liquidity than whole day upside , expecting to grap buy side liquidity

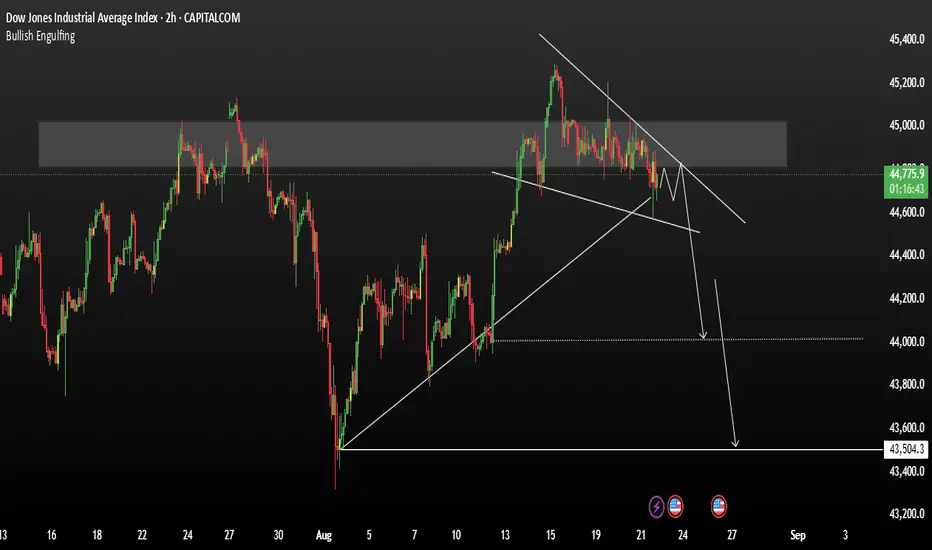
US30 (Dow Jones) 4H Chart AnalysisPotential Head & Shoulders Breakdown
Pattern: Head and Shoulders
Breakout Zone: ~44,796
Retest Expected before potential continuation lower
Entry: After confirmed rejection near 44,796 (retest zone)
Target: 43,738 (TP zone based on previous support)
Stop Loss: Above recent high (~44,837)
📉 If price respects the neckline and fails to break back above, I’ll be looking for short opportunities with favorable risk-reward.

US30-ShortBecause Powell is not lowering interest rates and due to seasonality factor US30 is a clear short in the month of August
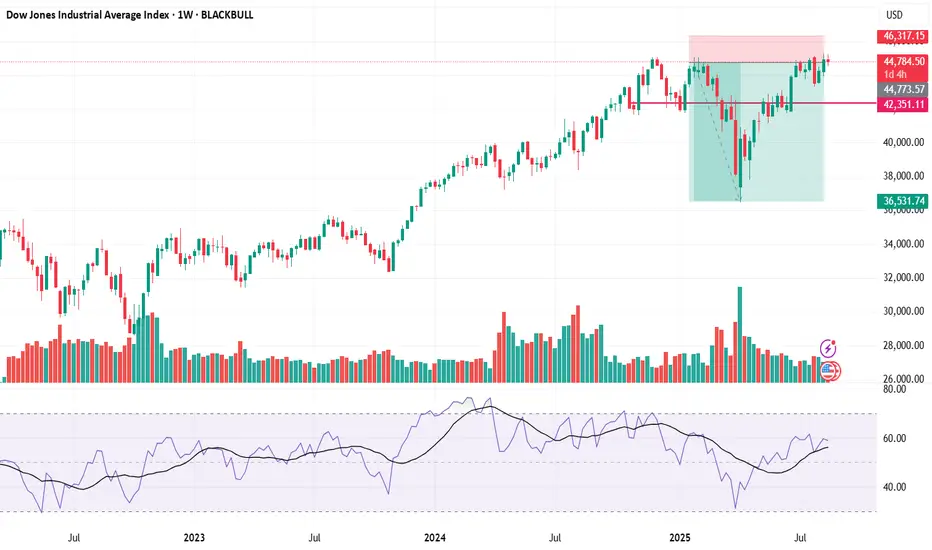
US30 breaks below the current market structureUS30 On the left side of the chart, we observed that after breaking below the second major pattern, the US30 experienced a sharp and aggressive decline. A similar structure appears to be forming once again, and notably, the index has just printed another all-time high.
If the price breaks below the current market structure—mirroring the previous breakdown—there is a strong possibility of another significant sell-off. This scenario becomes more likely if we see a clear shift in momentum toward the bearish side.
A confirmed breakdown could trigger a repeat of the past decline, especially if key support levels fail to hold and bearish volume increases.
You may find more details ion the chart.
Trade wisely best of Luck .
Ps; Support with like and comments for better analysis Thanks for supporting.
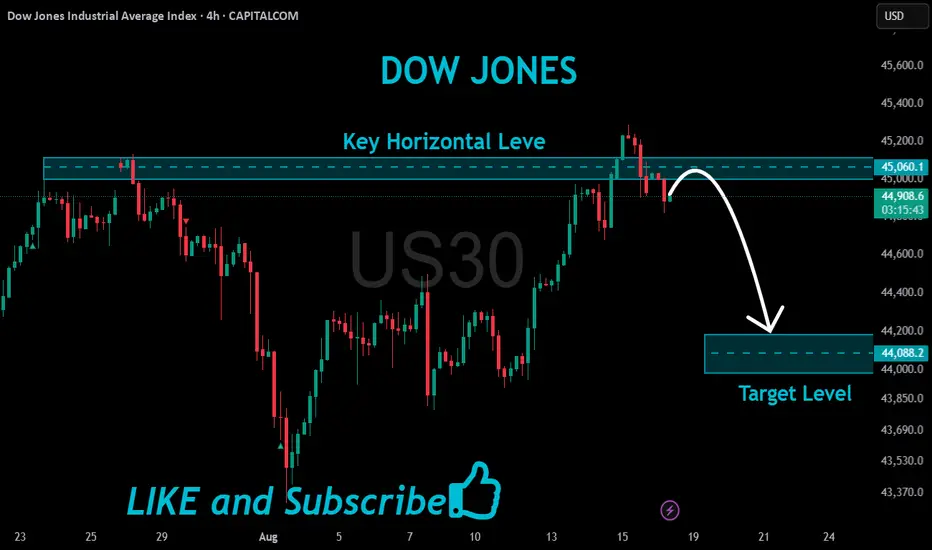
US30 Bearish Breakout!
HI,Traders !
#US30 made a bearish
Breakout of the key horizontal
Level of 45060.1 which is now
A resistance and the breakout
Is confirmed so we are bearish
Biased and we will be expecting
A further bearish move down !
Comment and subscribe to help us grow !
US30 Short Trade - Important to hit 44,600CAPITALCOM:US30 Short Trade
Entry: 44930 - 45,008
TP: 44,600
This is good trade.
Don't overload your risk like Greedy gambler!!!
Be Disciplined Trader, what what you can afford.
Use proper risk management.
Disclaimer: Trading is risky, only idea, not advice.

Just An IdeaWhen we can clear some lq and get ready to sell on this it gonna be smooth and quick once there aint any more uncertainty in the market
