WLD Market Update📊 MIL:WLD Market Update
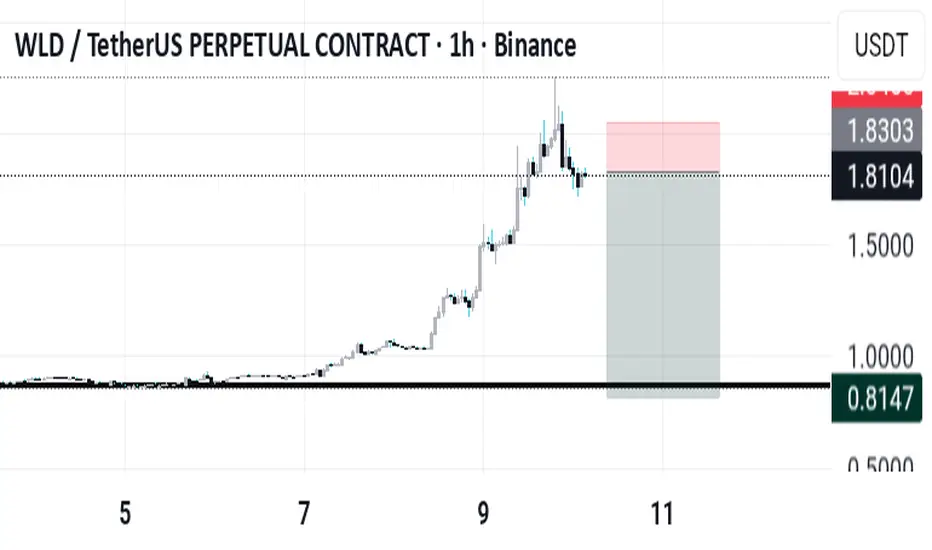
MIL:WLD is possibly forming a bullish Double Bottom pattern ✅
If it breaks out of the red resistance zone 🔴 with confirmation, the first target will be the blue line level 🎯
Trade ideas

WLDUSDT: Correction After Strong RallyOn the daily timeframe, WLD’s RSI is gradually declining, signaling a potential correction. On the hourly chart, RSI continues to fall toward 40, further confirming the corrective outlook.
I expect WLD to extend its pullback toward the two support levels at $1.523 and $1.40. At the moment, I am looking for an exit price to close 50% of my WLD holdings to ensure safety.
Disclosure: I am currently holding WLD, and this may influence my personal outlook.
This analysis is for reference only and should not be considered financial advice.

#WLD/USDT — Retest at the Golden Zone. Bullish Momentum#WLD
The price is moving within a descending channel on the 1-hour frame, adhering well to it, and is heading for a strong breakout and retest.
We have a bearish trend on the RSI indicator that is about to be broken and retested, which supports the upward breakout.
There is a major support area in green at 1.54, representing a strong support point.
We are heading for consolidation above the 100 moving average.
Entry price: 1.57.
First target: 1.59.
Second target: 1.63.
Third target: 1.67.
Don't forget a simple matter: capital management.
When you reach the first target, save some money and then change your stop-loss order to an entry order.
For inquiries, please leave a comment.
Thank you.

WLD Market Update📊 MIL:WLD Market Update
After an uptrend, MIL:WLD is now retracing 📉
👉 If the price keeps dropping to the green support zone 🟢, it could bounce up from there.
This level is where buyers previously accumulated and may push price up again with confirmation ✅
⚡ Be patient — wait for confirmation before entering.

WLDUSDT – Approaching Key Support | Long Setup AheadWLD had a powerful rally last week, but recent price action has seen a healthy retracement. This pullback is bringing the price into a critical support zone between $1.25 and $1.35, which previously acted as a strong base for bullish momentum.
The overall structure remains bullish, and this zone presents a high-confluence area for a potential long spot entry. If buyers step in here, we could see a strong reaction and continuation toward higher targets.
🔹 Trade Setup
• Entry Zone: $1.25 – $1.35
• Take Profit Targets:
🥇 $1.80 – $2.00
🥈 $2.40 – $2.65
• Stop Loss: Daily close below $1.20
#WLD #Worldcoin #CryptoTrading #Altcoins #CryptoSetup #LongTrade #TechnicalAnalysis #SupportZone #CryptoRally #SpotTrade #CryptoChart #WLDUSDT #BreakoutSetup #SwingTrade #CryptoBullish

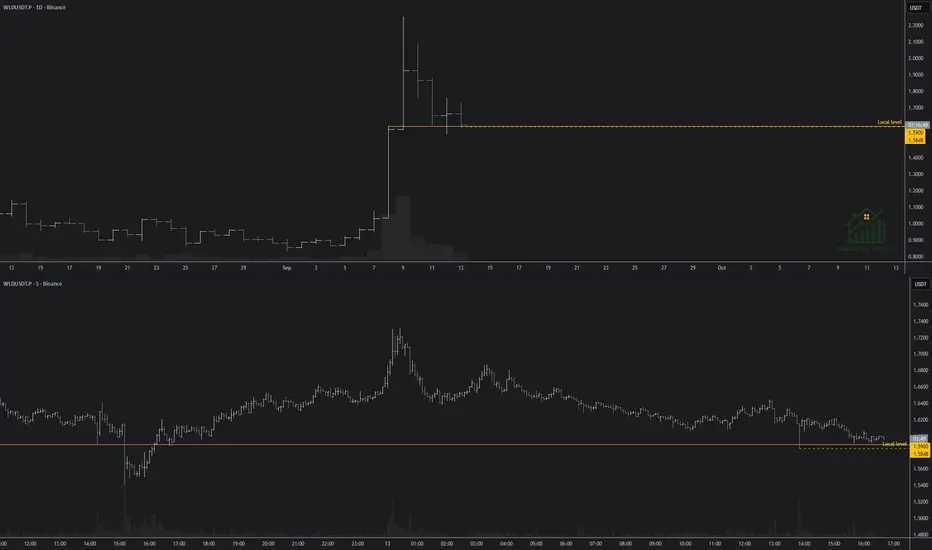
WLDUSDT: Short setup from daily support at 1.5900BINANCE:WLDUSDT.P has a mirror level, which was first resistance and is now support. Although a deep false breakout occurred yesterday, the asset reacted to the level, confirming its relevance. Today, another anomalously large bar on the 5-minute timeframe confirmed the presence of this level. Currently, a gradual squeeze toward the level with low volatility is observed.
Additional consolidation is needed to make a decision about opening a trade. I am adjusting the level to 1.5848, considering the latest false breakout.
In case of increased volatility or another false breakout, I will remove the asset from the watchlist, as it will become choppy price action at the level.
Scenario:
Price void / low liquidity zone beyond level
Volatility contraction on approach
Immediate retest
No reaction after a false break
No reaction after a false break:
Volatility contraction on approach
Momentum stall at the level
Repeated precise tests of the level ("sticking")
Consolidation with price compression (squeeze)
No reaction after a false break
#WLD/USDT — Retest at the Golden Zone. Bullish Momentum Contin#WLD
The price is moving within a descending channel on the 1-hour frame, adhering well to it, and is heading for a strong breakout and retest.
We have a bearish trend on the RSI indicator that is about to be broken and retested, which supports the upward move.
There is a major support area in green at 1.56, representing a strong support point.
For inquiries, please leave a comment.
We are in a consolidation trend above the 100 Moving Average.
Entry price: 1.70
First target: 1.77
Second target: 1.85
Third target: 1.94
Don't forget a simple matter: capital management.
When you reach the first target, save some money and then change your stop-loss order to an entry order.
For inquiries, please leave a comment.
Thank you.

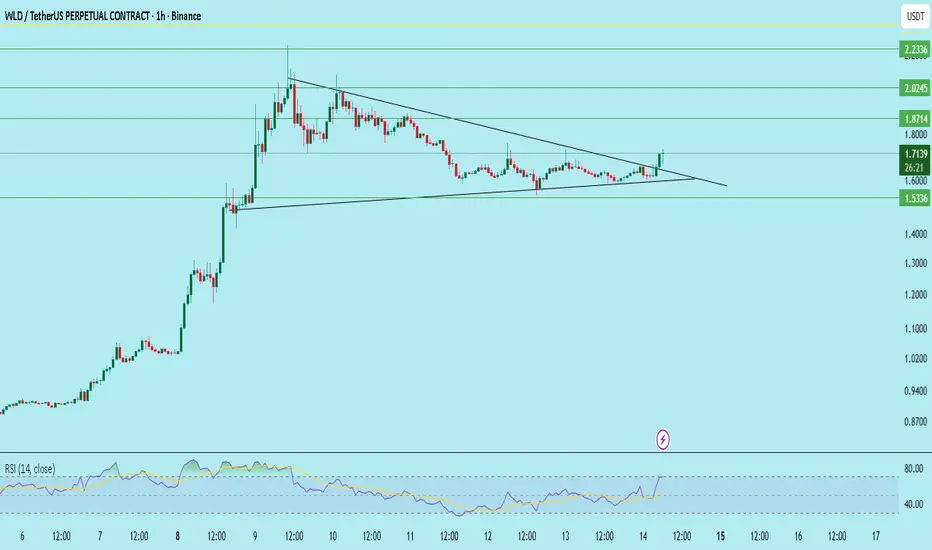
WLD/USDT — Bullish triangle breakout (1H)WLD formed a symmetrical triangle after a sharp advance. The price has broken above the triangle’s descending trendline with bullish follow-through candles. Buyers have been defending the rising lower trendline, and RSI has recovered from mid-range to ~59 — momentum is building but not overbought.
Key observations
Pattern: Symmetrical triangle → breakout to the upside on the hourly chart.
Candles: Breakout candle followed by bullish follow-through; watch for a clean retest of the breakout trendline as confirmation.
Momentum: RSI ~59 (room to run).
Support: 1.53 (strong demand area and triangle base).
Immediate resistance cluster: 1.87 → 2.02 → 2.23.
Trade plan (if you choose to take it)
Entry: 1.65 – 1.70
Stop loss: 1.53 (invalidation of triangle breakout)
Targets:
T1: 1.87 — Expected profit ≈ 10.00% – 13.33% (entry 1.70 → 1.65).
T2: 2.02 — Expected profit ≈ 18.82% – 22.42%.
T3: 2.23 — Expected profit ≈ 31.18% – 35.15%.
Risk if stopped: loss ≈ 7.27% – 10.00% (depending on entry within the range).
Risk notes / invalidation
Loss of 1.53 would invalidate the breakout and likely push price back to lower supports; treat 1.53 as the key invalidation level.
Ideal confirmation: retest of breakout trendline with clean rejection and/or volume confirmation.
Not Financial Advice | DYOR !!
WLD/USDT — Retest at the Golden Zone. Bullish Momentum Continue?📝 Full Analysis & Narrative
The WLD/USDT chart (2D timeframe, Binance) is showing one of the most exciting moves in recent months. After being pressured in a prolonged downtrend, the price finally printed an explosive breakout, breaking through significant resistance with a strong bullish candle, and leaving a long upper wick up to the 1.93 USDT area.
However, the euphoria quickly faded with a strong rejection at that resistance zone. At present, price is once again testing the Golden Zone (Fibonacci 0.5–0.618 at 1.357–1.519), which also coincides with a new support area after the role flip from previous resistance.
This makes the yellow zone a critical level:
If the zone successfully holds selling pressure, WLD has strong potential to continue its bullish rally.
On the other hand, if the zone breaks down, the market may treat the previous breakout as a false breakout, opening the way for a deeper decline.
---
🔎 Structure & Pattern
Previous trend: Long bearish phase → accumulation stage → impulsive breakout.
Current pattern: Breakout + Retest (confluence support at the Golden Zone).
Liquidity event: The long wick above 1.93 indicates a stop-hunt before retracement.
Confluence: Fibonacci retracement 0.5–0.618, historical support, and psychological level at 1.5.
This setup is commonly referred to as a “Breakout-Retest-Continuation” in price action, but it is also prone to becoming a bull trap if the support fails.
---
🚀 Bullish Scenario
1. Price holds within the 1.357–1.519 zone with a bullish rejection candle → potential rebound.
2. Additional confirmation: A 2D close above 1.93 → validates bullish momentum.
3. Step-by-step upside targets:
2.316 (minor resistance)
2.794 (major supply zone)
3.780 → 4.397 → 5.913 (mid-to-long-term Fibonacci extension and historical resistance levels).
---
📉 Bearish Scenario
1. Price breaks down and closes 2D below 1.357 → invalidation of the Golden Zone.
2. Selling pressure intensifies, opening room for further downside:
1.00 (psychological support)
0.80 (minor support)
0.573 (historical swing low, last demand zone)
3. Such breakdown would confirm a false breakout and likely trigger distribution.
---
📊 Conclusion
The Golden Zone (1.357–1.519) is the ultimate key area.
As long as price holds above this zone, the bullish trend remains valid with potential towards 1.93 and beyond.
Failure to hold opens the risk of a sharp correction back to the 1.00–0.57 area.
The 2D candle close & volume are the most important confirmations to watch.
Remember: this is an area full of both opportunity and risk. Proper risk management is essential.
---
#WLDUSDT #WLD #Altcoin #Crypto #Breakout #Fibonacci #GoldenZone #PriceAction #TechnicalAnalysis #SupportResistance #Bullish #Bearish #SwingTrade #DYOR

WLD to 0.9$ enter now SL 1.744WLD to 0.9$
Enter 1.661 - NOW-
SL 1.744
TP 0.9
If 1.54$ support don't hold it will dump hard.

W Market Update📊 $W Market Update
If $W retraces to the green zone around $1.279 🟢
👉 Potential bounce area for long entry 🚀
⚡ Trade smarter, not hope 🔑


WLD Main trend. Super pump +1118 and decline -95. 09 05 2025Logarithm. Main trend. Time frame 3 days.
Super pump +1118.42% and decline -95.16%.
Smart and stupid money. The legend of the project is quite interesting, it is quite possible that there will be attempts to implement it, but always in the first place in such projects is: "money from nothing". The chart confirms this. After the pump +1118.42%, a huge distribution zone, which formed the upper part of the pattern of one of the varieties of "head and shoulders" at an angle. Which makes it clear that the profit is huge. Even now, with a price decrease below the listing prices, from the peak of the pump by -95.16%, which is normal for assets of such liquidity, the profit of some "investors" is +25 X !! Think about what profit was when pumping +1118% (it is impossible to implement, the pump is done just for the chart, to raise the price, for "false goals" and hype, so that on rollbacks "cheap", in the distribution zone they were not afraid to buy on the conditional hype "whales bought". Although now it is unlikely that they will pour. In order to constantly sell at excess profit "at any prices", you need to make interest, both for traders and for investors, that is, volatility waves. They will pump under the market.
Local trend . Local impulse from the minimum prices. Locally, the price rested against the median, in case of its breakthrough - the implementation of the ascending pennant.

WLD - BEARISH SETUPMIL:WLD - Bearish setup 📉
Following my yesterday's view, the bearish correction is likely not over! 📉
Lower big demand zone: 1.520 - 1.500$ 🎯


WLD – Impulse, Correction, and What’s Next!Worldcoin (WLD) has just completed a massive impulse leg to the upside, followed by a sharp correction phase. Price is now retracing toward a strong demand zone, where bulls may look to re-enter.
⚡ Impulse Move: A parabolic run recently pushed WLD into new highs.
📉 Correction: Price is currently retracing in a controlled downward channel.
🟠 Demand Zone: The $1.40 – $1.50 area is a key zone where buyers previously stepped in strongly.
🚀 Potential Next Impulse: If this demand holds, WLD could launch the next bullish leg, potentially aiming back above $2.00 and beyond.
📌 The coming sessions will be crucial: will the demand zone hold and trigger another impulse, or will sellers break it for a deeper retracement?
This is an educational analysis, not financial advice. Always apply proper risk management when trading.
📚 Stick to your trading plan regarding entries, risk management, and trade execution.
Good luck!
All Strategies Are Good; If Managed Properly!
~Richard Nasr

WLDUSDT Forming Bullish PennantWLDUSDT is showing strong technical strength with the formation of a bullish pennant pattern, which is considered a continuation signal after an initial upward rally. This structure highlights a period of consolidation where the price is coiling within narrowing ranges, typically before resuming its upward momentum. With good volume supporting this setup, the chances of a breakout remain high, targeting gains in the range of 50% to 60%.
The bullish pennant pattern generally reflects healthy market conditions, where traders lock in profits after a rally while new buyers step in to sustain momentum. For WLDUSDT, this behavior signals confidence among investors that higher valuations may follow once the resistance trendline is breached. The increasing accumulation during this consolidation phase is a positive indicator of strong underlying demand.
Market sentiment around WLDUSDT has been gaining traction, with more investors taking interest in this project. This surge in attention aligns with the technical setup, further boosting the probability of an extended bullish move. If momentum continues to build, this pair could establish new short-term highs, making it a closely watched opportunity for traders.
In summary, WLDUSDT is well-positioned within a bullish pennant pattern, supported by solid trading volume and growing investor confidence. With expected gains of 50% to 60%, the breakout potential looks promising for both short-term traders and long-term investors.
✅ Show your support by hitting the like button and
✅ Leaving a comment below! (What is You opinion about this Coin)
Your feedback and engagement keep me inspired to share more insightful market analysis with you!

WLD it's time to take profitWlD was mooning like a lot but for a healthy growth it needs a deep correction other wise this is just pump and dump
WLDUSDTAccording to the previous analysis, it completed its second leg with good momentum, but it was only slightly involved in a time correction. Now, if it maintains this momentum and stabilizes, it can see the next levels.

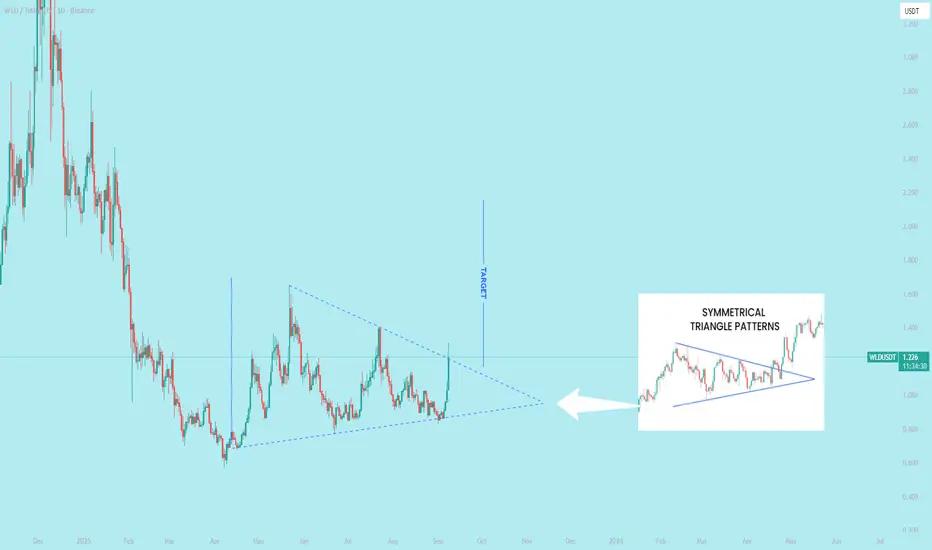
$WLD Performing Bullish Symmetrical Patterns
`charting patterns in technical analysis formed by two converging trendlines: one descending and one ascending. They signify a period of consolidation where price movements become narrower, indicating a temporary balance between buyers and sellers. A key characteristic is the decrease in trading volume as the pattern forms, followed by a surge in volume when a breakout occurs.`
DeGRAM | WLDUSD has rapidly broken out of the triangle📊 Technical Analysis
● WLD/USD broke out of a prolonged triangle pattern after a false downside move, confirming bullish reversal momentum.
● Price surged past the 1.65–1.90 resistance zone, with the next upside objectives seen at 2.15 and 2.40, while 1.65 now acts as key support.
💡 Fundamental Analysis
● Renewed investor appetite for AI-related tokens and rising trading volumes across major exchanges are fueling WLD’s rally, reinforcing the breakout’s strength.
✨ Summary
Bullish above 1.65; targets 1.90 → 2.15 → 2.40. Invalidation on a close below 1.65.
-------------------
Share your opinion in the comments and support the idea with a like. Thanks for your support!

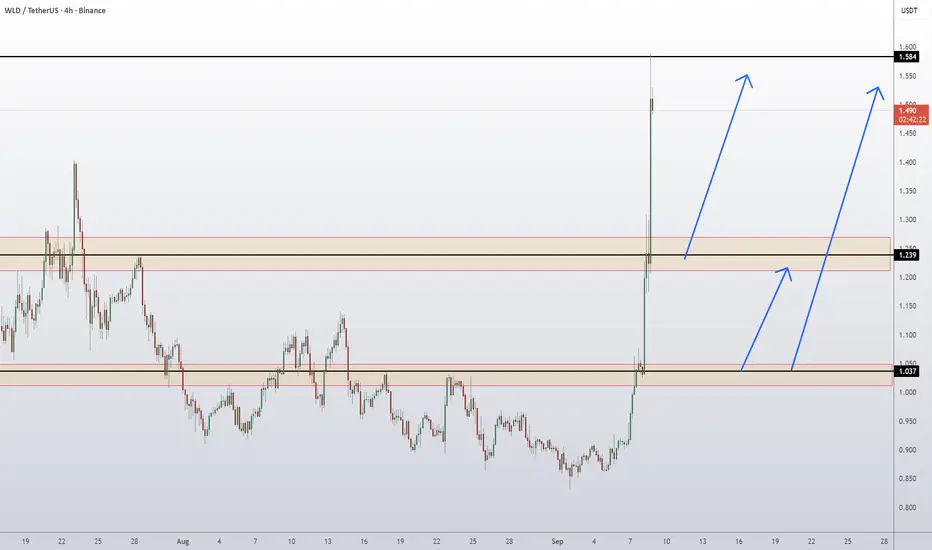
WLD Coin Worldcoin Token Price Prediction and Technical AnalysisWLD/USDT has exploded higher with a massive breakout, surging past the 1.037 resistance and clearing the 1.239 supply zone, which is now turning into support. Price is currently consolidating near the 1.494 area, with upside momentum still strong. If buyers sustain above 1.239, continuation toward the upper resistance at 1.551 – 1.584 looks likely. However, any failure to hold above 1.239 could trigger a pullback toward 1.037 demand before another push higher.
📈 Key Levels:
Buy trigger: Retest/hold above 1.239 support
Buy zone: 1.23 – 1.25 region
Target: 1.551 – 1.584 resistance
Invalidation: Daily close below 1.037 (would weaken bullish momentum)
👉 Follow me for More Real Time Opportunities.
Share your Thoughts if you have any?
WLDUSDT – Breakout Confirmed, Eyes on $1.78 and Higher📈🌐 WLDUSDT – Breakout Confirmed, Eyes on $1.78 and Higher 🚀🧠
WLD continues to deliver clean technical setups—and yesterday’s breakout gave us a perfect new entry at the base of this rising channel. This update builds on the same structure I’ve been tracking since early May, now reinforced by both fundamentals and price action.
🔍 Technical Outlook:
📌 New Support Zones:
$1.0633
$1.4185
📌 Next Targets:
🎯 Target 1 – $1.7827
🎯 Target 2 – $2.5275
and then if the markets help we can dream for:
🎯 Target 3 – $3.5074
🎯 Target 4 – $5.0708
🎯 Target 5 – $8.6900
🎯 Target 6 – Upper extension (long-term trajectory toward $16+)
The structure follows the classic market rhythm:
1️⃣ Falling Channel Breakdown
2️⃣ First Re-Entry with Support Reclaim
3️⃣ Perfect Flag Retest → New Rally Begins
🧠 Why WLD?
One of Leading Layer 2 inflows last week across all chains
Expanding ecosystem with real-world apps:
🎮 Humans vs AI
🏨 Hotels Cryptorefills
👤 Human Actions (identity layer tech)
And many many more.
Worldcoin’s biometric World ID system continues expanding in the US and Asia—bringing new users into the WLD economy
⚠️ Note: WLD is a high-volatility, speculative asset. Trade setups like this follow strong momentum patterns—but always manage risk and respect invalidation levels.
One Love,
The FXPROFESSOR 💙
