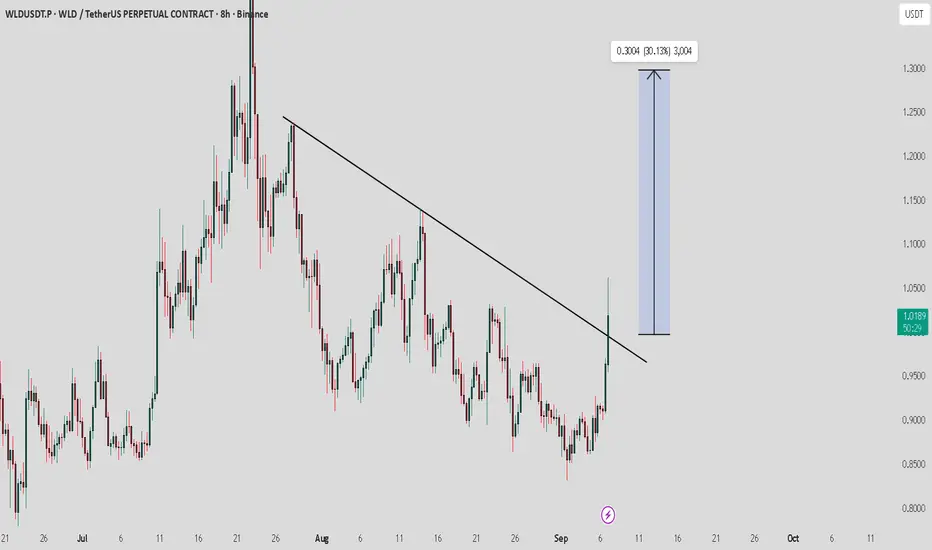
WLD CAN DO IT AGAIN..It's been a long time since WLD showed a new increasing trend.
Following the coming hours to see if WLD is able to open a new cycle
Never enter any trend directly, wait for the confirmations, and trade only depending your setups.
WLD did show before at good cycle times, that it can do even 12 usd in short term
Trade ideas

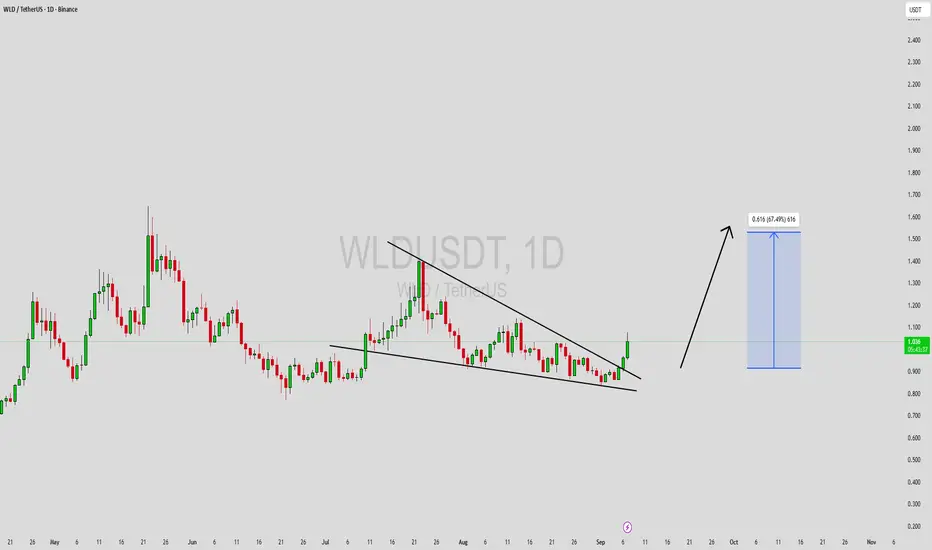
Worldcoin WLD price analysis#WLD is approaching the upper boundary of a falling channel that has been shaping the trend for more than 1.5 years.
🔎 The key area OKX:WLDUSDT sits around $1.50, and market reaction there will likely define the mid-term direction:
✅ A breakout with strong volume could trigger a continuation toward $3.50–3.75.
❌ Failure to gain momentum may lead to another decline, potentially down to $0.90.
This makes $1.50 a critical zone to monitor closely.
______________
◆ Follow us ❤️ for daily crypto insights & updates!
🚀 Don’t miss out on important market moves
🧠 DYOR | This is not financial advice, just thinking out loud.

WLD: Descending Resistance Finally BrokenMIL:WLD has broken out of the long-term descending resistance line, signaling weakening selling pressure. Price is now trading around 1.27, reclaiming the 1.25–1.35 resistance zone.
Sustaining above this area could push toward 1.60, while slipping back below may signal a false breakout with downside risk toward 1.00.
In short, WLD is at a pivotal stage, holding above keeps the breakout valid, rejection could trap late buyers.
DYOR, NFA

WLD / USDT : Breaking out with strong potentialWLD/USDT is breaking out of trendline resistance with strong potential. This breakout could signal the start of a strong rally ahead.
If the breakout holds, the next upside targets are $1.10 – $1.20 – $1.30. A successful retest would further strengthen this setup.
Always wait for a clear bullish signal and candle close to avoid fakeouts. Manage risk wisely before entering.
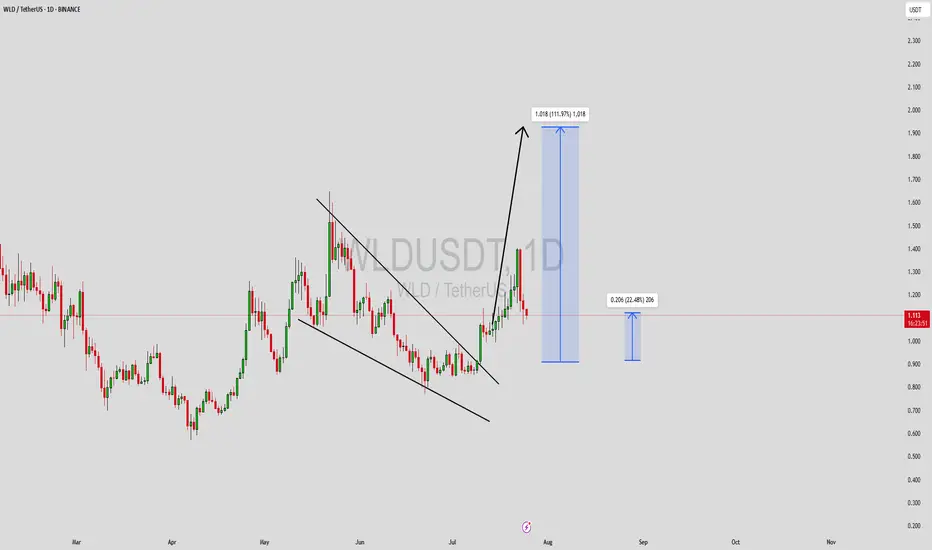
A clear impulse correction for WLDUSDTWLDUSDT has formed an impulse and done it's ABC correction.
I think it is solid to think it will continue to go up to at least
$1.6, a simple idea from your legendary trader, who forecasted HOOD
uptrend on my youtube channel. :) BINANCE:WLDUSDT

WLDUSDT Forming Bullish Falling WedgeWLDUSDT is currently showing a strong breakout setup after forming a bullish falling wedge pattern on the daily chart. This technical structure often signals a potential reversal and trend continuation to the upside. With the breakout confirmation and price momentum building, WLD is now targeting a gain of 50% to 60%+, supported by solid volume inflows.
The trading activity suggests that market participants are stepping in at key levels, indicating strong investor confidence. The breakout move is further validated by healthy buying pressure, which increases the probability of WLD reaching higher resistance zones in the coming sessions. Such technical alignment provides a favorable risk-to-reward setup for swing traders and medium-term investors.
Investor interest in WLDUSDT has been steadily growing, as the project gains traction in the broader crypto space. The combination of strong technicals, increasing volume, and heightened market sentiment is creating a positive outlook for this pair. If momentum continues, WLD could establish new short-term highs, validating the expected bullish move.
In summary, WLDUSDT’s falling wedge breakout backed by strong volume signals an optimistic outlook with potential gains of 50% to 60%+. With increasing investor interest and technical strength, this setup is one worth watching closely for a significant bullish run.
✅ Show your support by hitting the like button and
✅ Leaving a comment below! (What is You opinion about this Coin)
Your feedback and engagement keep me inspired to share more insightful market analysis with you!
WLD/USDT 4-Hour Technical AnalysisA long-term descending trendline is still intact, stretching from the top left of the chart toward the mid-section. However, the price is currently holding above key support zones, showing signs of attempting a breakout toward resistance levels.
The descending trendline has not yet been broken, but price action is approaching it with increasing buying pressure.
A 4-hour candle close above 1.074 could open the path toward 1.139.
If the price pulls back, 0.952 is the first level that must hold to maintain the short-term bullish structure.

#WLD/USDT#WLD
The price is moving within a descending channel on the 1-hour frame and is expected to break and continue upward.
We have a trend to stabilize above the 100 moving average once again.
We have a downtrend on the RSI indicator that supports the upward break.
We have a support area at the lower boundary of the channel at 0.850, acting as strong support from which the price can rebound.
We have a major support area in green that pushed the price upward at 0.840.
Entry price: 0.951.
First target: 0.981.
Second target: 1.023.
Third target: 1.074.
To manage risk, don't forget stop loss and capital management.
When you reach the first target, save some profits and then change the stop order to an entry order.
For inquiries, please comment.
Thank you.

WLDUSDTHi snipers. On the daily time frame, after a sharp price decline in the past months and the formation of a price bottom, the price is reversing. And we are witnessing the formation of a descending triangle, which according to statistics has a 40% probability of an upward breakout and a 60% probability of a downward breakout. But here we are also witnessing a divergence. The price is moving downward, the RSI is moving upward, which is a good sign for a price increase. I am learning. This is not a buy or sell offer.

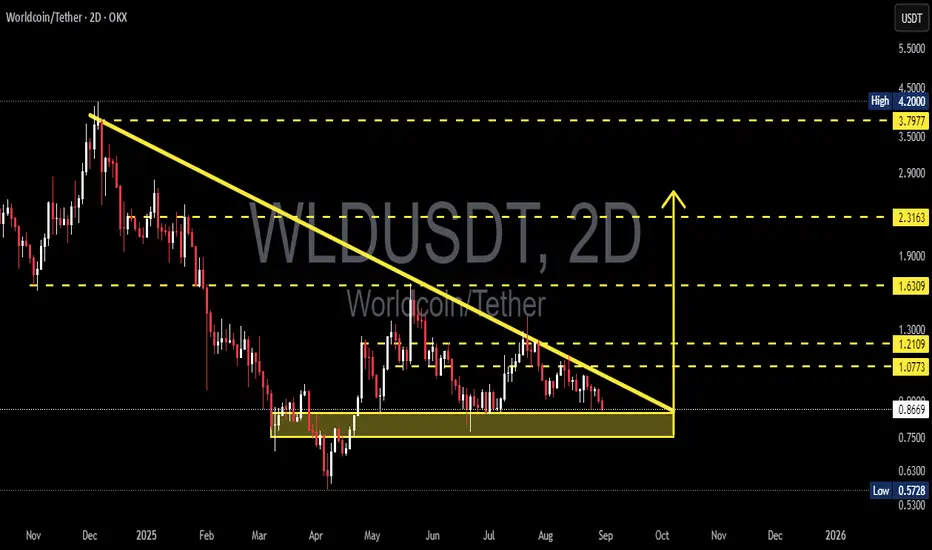
WLDUSDT — Decision Point at the Edge of the TriangleChart Structure:
WLD/USDT has been forming a large descending triangle for months.
The chart shows a series of lower highs pressing down against a flat base support at $0.80–$0.90 (yellow box).
Current price sits around $0.87, right at the critical zone where a decisive move is highly likely.
---
🔎 Technical Pattern
Descending Triangle → typically a bearish continuation pattern, but it can also trigger a false breakdown before a major reversal.
This area now acts as a battlefield of accumulation vs distribution. If buyers hold the line, a bullish reversal is possible.
---
🚀 Bullish Scenario (Potential Reversal)
1. Key trigger: 2D candle close above the descending trendline and hold >$1.08.
2. Validation: Successful retest of $1.08 as new support.
3. Upside targets:
$1.21 → first resistance
$1.63 → strong supply zone
$2.32 → mid-term target
$3.80–$4.20 → major supply zone if momentum continues
4. Invalidation: Failure to stay above $0.95 after breakout.
---
📉 Bearish Scenario (Potential Breakdown)
1. Main trigger: 2D close below $0.80 (triangle base breakdown).
2. Validation: Retest $0.80–$0.85 as resistance.
3. Downside targets:
$0.63 → minor support
$0.57 → historical low
4. Invalidation: Quick reclaim and hold above $0.90–$0.95.
---
⚖️ Conclusion
WLD is entering a make-or-break phase.
A confirmed breakout could start a recovery trend with upside targets up to $2.32 and beyond.
A breakdown, however, could lead to capitulation toward $0.63–$0.57.
As price is now compressed at the tip of the triangle, a major move is imminent.
---
✍️ Suggested Caption for TradingView
“WLDUSDT is at a critical decision point inside a descending triangle.
Bullish case: Break and hold above $1.08 → targets $1.21 / $1.63 / $2.32.
Bearish case: Breakdown below $0.80 → targets $0.63 / $0.57.
The market is about to decide — accumulation or capitulation?”
#WLDUSDT #Worldcoin #CryptoAnalysis #TechnicalAnalysis #DescendingTriangle #SupportResistance #PriceAction #Breakout #Breakdown #CryptoTrading
Worldcoin · 400% vs 1800% · Wait vs Margin/LeverageSomething simple. We've already seen hundreds and hundreds of moves in the +200% to +400% range. Hundreds of these over the years... How many times have you earned 400% in a single trade? How often? The trick is to wait.
Here we have Worldcoin (WLDUSDT) and only last month it seemed like it was already too late. Prices were moving up; the start of the next bullish wave. The market always gives a second chance and I see this happening now. A second chance to enter, a second chance to buy low, a second chance to buy and hold.
The trick is to wait.
You can do any math, tons of maths or very simple maths. A capital of $10,000 if you consider a four months wait. Can be two months or can be one month but you are ready to wait between 4 to 8. Even up to eight months without a sweat.
We see the charts over and over, and we see +300%, +400%, +500%. Can you get this one?
Buy and hold WLDUSDT, spot, wait until the 400% target hits and close the trade. It can happen within just two months or it can take more. The truth is that the market can take as long as it takes. If we are ready to wait, we've already conquered this section of the market and we can move to the more advanced tools, margin/leverage.
Thank you for reading.
Namaste.

#WLD/USDT#WLD
The price is moving within an ascending channel on the 1-hour frame, adhering well to it, and is on its way to breaking strongly upwards and retesting it.
We have support from the lower boundary of the ascending channel, at 0.946.
We have a downtrend on the RSI indicator that is about to break and retest, supporting the upside.
There is a major support area in green at 0.943, which represents a strong basis for the upside.
Don't forget a simple thing: ease and capital.
When you reach the first target, save some money and then change your stop-loss order to an entry order.
For inquiries, please leave a comment.
We have a trend to hold above the 100 Moving Average.
Entry price: 0.951
First target: 0.968
Second target: 0.994
Third target: 1.027
Don't forget a simple thing: ease and capital.
When you reach the first target, save some money and then change your stop-loss order to an entry order.
For inquiries, please leave a comment.
Thank you.

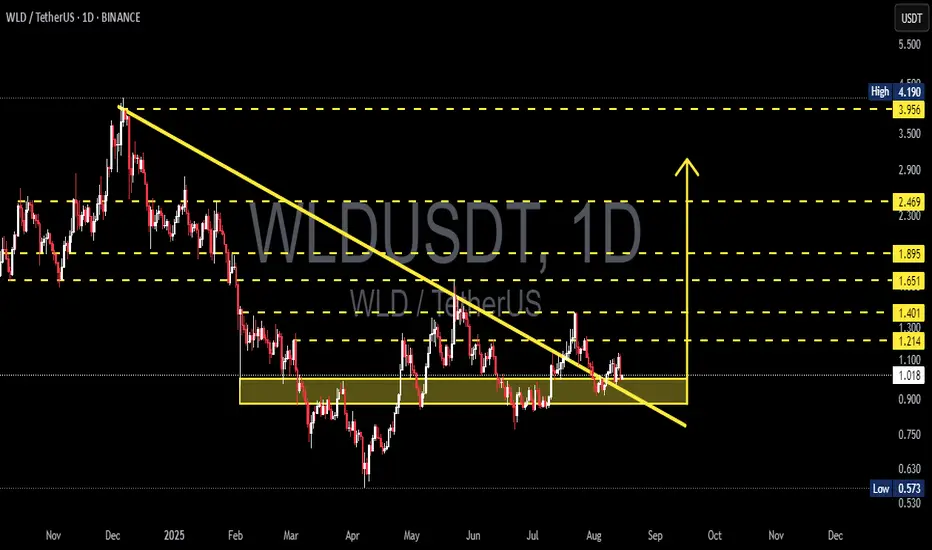
WLD/USDT — Testing Major Demand Zone — Breakout or Bull Trap?Summary:
Price is sitting right inside a major demand zone (~0.90–1.10 USDT) after previously breaking above and then pulling back around the long-term descending trendline (yellow line). This zone has repeatedly acted as a strong floor — the next move (bounce & rally vs. breakdown) will set the medium-term direction.
---
Key Levels
Current price ≈ 1.014 USDT (dotted line).
Demand / support zone: ~0.90 – 1.10 USDT (yellow box).
Resistances / upside targets: 1.214, 1.401, 1.651, 1.895, 2.469 USDT.
Structural high: ~3.95 – 4.19 USDT.
Major low: 0.573 USDT.
---
Pattern Analysis
1. Multi-month descending trendline — the yellow line shows a sustained downtrend from Dec–Jan highs. Sellers have dominated until a potential structural shift.
2. Breakout & retest — price broke above the trendline earlier but fell back into the demand zone → this could be a breakout + retest (bullish) or a false breakout / bull trap (bearish) depending on confirmation from price & volume.
3. Range / consolidation — since March–May, price has been oscillating around the yellow box → a clear accumulation/demand area.
4. Lower highs structure is still visible on the higher timeframe — sellers are not fully out of the picture.
---
Bullish Scenario
Confirmation needed: Daily close above 1.214 USDT (stronger if backed by higher volume).
Conservative plan: Wait for a daily close > 1.214 and enter on a retest; stop below 1.01), stop tight at 0.88.
Example R:R (entry 1.014, stop 0.88):
Target 1: 1.214 → +19.7% upside, ~13.2% risk → R:R ≈ 1.5:1.
Target 2: 1.401 → +38.2% upside → R:R ≈ 2.9:1.
Target 3: 1.651 → +62.8% upside → R:R ≈ 4.8:1.
Note: Hold / trail stop after 1.401 break to maximize potential.
---
Bearish Scenario
Confirmation needed: Daily close below 0.90 with strong selling volume.
Downside targets: Next major support ~0.57 USDT, with intermediate zone around 0.63–0.75 likely tested first.
Example short setup: Entry after breakdown (<0.90), stop above 1.214. Entry 0.90, stop 1.214, target 0.573 → ~36.3% profit, ~34.9% risk → R:R ≈ 1.04:1 (less attractive unless strong confirmation).
Note: A breakdown of this demand zone could trigger a sharp sell-off — use stop-loss.
---
Key Confirmation Signals
Volume spike during breakout/breakdown (volume up = stronger validation).
Daily/weekly close above resistance or below support (avoid false wicks).
Momentum indicators: Bullish divergence on RSI / MACD cross for longs; bearish momentum (falling RSI, MACD cross down) for shorts.
Trendline reaction: Long upper wicks = rejection; clean close = strength.
---
Risk Management Tips
Confirm setups on daily + 4H before entry.
Limit risk per trade (e.g., 1–2% of capital).
Beware of bull traps — don’t overleverage on weak-volume breakouts.
Use trailing stops when in profit.
---
> WLD/USDT — Testing major demand zone (0.90–1.10).
Previous breakout failed to hold momentum → price is back inside the accumulation zone. Watch for daily close >1.214 (bullish) or breakdown <0.90 (bearish). Manage your risk.
#WLDUSDT #Worldcoin #CryptoAnalysis #SupportResistance #Breakout #Retest #BullVsBear #TechnicalAnalysis #RiskManagement
#WLD/USDT#WLD
The price is moving within an ascending channel on the 1-hour frame, adhering well to it, and is on its way to breaking strongly upwards and retesting it.
We have support from the lower boundary of the ascending channel, at 0.953.
We have a downtrend on the RSI that is about to break and retest, supporting the upside.
There is a major support area in green at 0.968, which represents a strong basis for the upside.
Don't forget a simple thing: ease and capital.
When you reach the first target, save some money and then change your stop-loss order to an entry order.
For inquiries, please leave a comment.
We have a trend to hold above the 100 Moving Average.
Entry price: 0.986.
First target: 1.018.
Second target: 1.050.
Third target: 1.09.
Don't forget a simple thing: ease and capital.
When you reach the first target, save some money and then change your stop-loss order to an entry order.
For inquiries, please leave a comment.
Thank you.

$WLD Worldcoin is not gonna get any higher for now at least, maybe tries to break $1.50 but thats unlikely to happen, but the price might reach $0.50 and even might fall to $0.33 for a short time. But overall the chart is looking well long-term. (But the whole market is bullish now and i cant say for sure.)

#WLD/USDT#WLD
The price is moving within an ascending channel on the 1-hour frame, adhering well to it, and is on its way to breaking strongly upwards and retesting it.
We have support from the lower boundary of the ascending channel, at 0.890.
We have a downtrend on the RSI indicator that is about to be broken and retested, supporting the upside.
There is a major support area in green at 0.900, which represents a strong basis for the upside.
Don't forget a simple thing: ease and capital.
When you reach the first target, save some money and then change your stop-loss order to an entry order.
For inquiries, please leave a comment.
We have a trend to hold above the 100 Moving Average.
Entry price: 0.939
First target: 0.959
Second target: 0.986
Third target: 1.016
Don't forget a simple thing: ease and capital.
When you reach the first target, save some money and then change your stop-loss order to an entry order.
For inquiries, please leave a comment.
Thank you.

#WLD/USDT Approaching Breakout After Long-Term Downtrend !#WLD
The price is moving within an ascending channel on the 1-hour frame, adhering well to it, and is on its way to breaking strongly upwards and retesting it.
We have support from the lower boundary of the ascending channel, at 1.00.
We have a downtrend on the RSI indicator that is about to break and retest, supporting the upside.
There is a major support area in green at 1.02, which represents a strong basis for the upside.
Don't forget a simple thing: ease and capital.
When you reach the first target, save some money and then change your stop-loss order to an entry order.
For inquiries, please leave a comment.
We have a trend to hold above the 100 Moving Average.
Entry price: 1.08.
First target: 1.12.
Second target: 1.157.
Third target: 1.20.
Don't forget a simple thing: ease and capital.
When you reach your first target, save some money and then change your stop-loss order to an entry order.
For inquiries, please leave a comment.
Thank you.

WorldCoin Price Retracing to Golden Pocket for next leg up?After rejecting the key resistance, price is retracing and currently hovering around the 50% Fib level (1.040).
Currently, MACD crossover below signal and RSI rolling down from overbought. So, momentum has turned bearish.
I'm watching the 0.968–1.000 zone (Fib 61.8% + demand) as a critical bounce or breakdown area.
A bullish reaction here could trigger a rebound toward 1.324, 1.648, and more.
Break below 0.960 opens room toward 0.876 or lower.
The plan is to go LONG if price shows strength near 0.968 (bullish engulfing, divergence)
📌 Bearish bias short-term, but key support test coming. Staying flexible.

LONG $WLD MIL:WLD
Price pulled back from the $1.40 resistance and is now reacting to a key demand zone. This area also aligns with the 0.5–0.618 Fib retracement level, where buyers have stepped in previously.
If this support holds, we could see a bounce toward the next major resistance.
Entry Zone: Around $1.08–$1.12
Stop Loss: Below $1.00
Targets:
Target 1: $1.16
Target 2: $1.25
Target 3: $1.33
Target 4: $1.40
Leverage 5X
DYOR, NFA
#TradeSetup #Altseason

Worldcoin (WLD): Long OpportunityWorldcoin has recently broken the local bullish trend, where now the price has reached the support area. We are now looking for a proper bounce from here, where we will then be looking for BOS and entry for long as well.
Swallow Academy

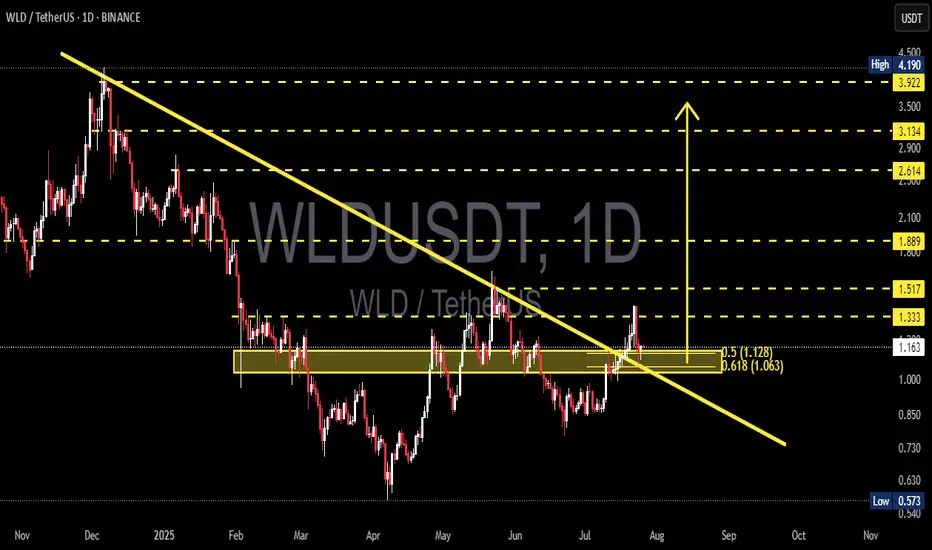
WLDUSDT at a Critical Level: Valid Breakout or Just a Fakeout?WLDUSDT is catching traders' attention after successfully breaking above a long-term descending trendline that has capped price since late 2024. But the big question now is — is this the start of a real trend reversal, or just a classic bull trap fakeout?
---
📌 Detailed Technical Breakdown
🟡 1. Major Trendline Breakout
The yellow trendline drawn from November 2024 has finally been broken to the upside.
This is a potential signal that bearish momentum is weakening significantly.
🟨 2. Key Demand Zone (Horizontal Yellow Box)
The area between 1.063 – 1.128 USDT has acted as a strong demand/support zone since March 2025.
Price is currently retesting this zone, which makes it a decisive level for validating the breakout.
🔁 3. Fibonacci Retracement Levels
Price is retesting the 0.5 (1.128) and 0.618 (1.063) retracement levels.
These fib levels could serve as a launchpad for a bullish continuation if held.
🧱 4. Layered Resistance Structure
If the bounce holds, WLD could target:
🔹 1.333 – Psychological resistance
🔹 1.517 – Previous structural resistance
🔹 1.889 – Key horizontal level
🔹 2.614 – 3.922 – Medium-term targets based on historical structure and fib extension
---
🟢 Bullish Scenario (Increasing Probability)
Price holds above the 1.063 – 1.128 zone and confirms a rebound.
A daily close above 1.333 would further confirm bullish continuation.
Formation of higher highs and higher lows would validate trend reversal.
🔴 Bearish Scenario (If Breakdown Occurs)
Price loses support at 1.063, invalidating the breakout and retest.
Possible targets to the downside:
Minor support: 0.85 – 0.75
Major support: 0.573 (Previous macro low)
---
📈 Interesting Chart Pattern
Potential formation of an Inverse Head and Shoulders, with the neckline around 1.333.
A confirmed breakout above the neckline could trigger a strong bullish impulse.
---
🎯 Conclusion
WLD is now in a golden zone that will decide its medium-to-long-term trend.
The 1.063 – 1.128 area is make-or-break. If bulls defend this zone, it confirms trend reversal. If it fails, WLD could slide back into a distribution range.
📌 Traders who wait for confirmation at this stage may have the strategic edge.
#WLDUSDT #WLDAnalysis #CryptoBreakout #TrendlineBreak #TechnicalAnalysis #InverseHeadAndShoulders #FibonacciSupport #AltcoinSetup #CryptoTrading #CryptoUpdate
WLDUSDT Forming Falling WedgeWLDUSDT is currently forming a falling wedge pattern, a bullish technical setup known for signaling a potential trend reversal. The narrowing price action within this wedge suggests that sellers are losing strength, while buyers are gradually gaining control. This setup is particularly promising when supported by a rise in volume, and in WLDUSDT’s case, the trading volume has been steadily increasing—an early confirmation of growing investor interest.
Worldcoin (WLD) has attracted major attention due to its unique identity-based ecosystem and backing by high-profile figures in the tech world. The project has recently seen renewed momentum as discussions around digital identity, privacy, and AI integration continue to heat up. The falling wedge pattern, combined with good volume and fundamental strength, increases the probability of an upside breakout. Technical projections point toward a conservative gain of 19% to 20%, making it a suitable target for short- to mid-term traders looking for solid risk-reward setups.
From a technical analysis standpoint, key resistance levels lie near the upper boundary of the wedge, and a breakout with volume confirmation could push prices swiftly toward those targets. Momentum indicators such as RSI and MACD are also showing signs of bullish divergence, hinting at a potential reversal. This setup becomes more favorable in the context of WLD's fundamental narrative and broader market sentiment.
WLD’s long-term vision and growing adoption potential position it as more than just a short-term play. While the immediate gain may be moderate compared to more speculative altcoins, its low-risk technical setup and increasing demand make it an appealing choice for both new and experienced crypto traders.
✅ Show your support by hitting the like button and
✅ Leaving a comment below! (What is You opinion about this Coin)
Your feedback and engagement keep me inspired to share more insightful market analysis with you!
wld update🚨 WLD/USDT – 4H Technical Analysis 🚨
WLD is currently trading within a well-defined ascending channel 📈. After touching the upper boundary, the price sharply dropped by over 11%, signaling a strong rejection from resistance. 🔻
🔍 Key Insights:
🔹 Support Levels:
🟦 $1.000 – major psychological and technical support
🟦 $0.883 – previous breakout zone
🔹 Resistance:
🔺 $1.30–$1.32 zone acted as strong resistance recently
🔹 RSI (14):
📉 Dropping below 50, showing bearish momentum
⚠️ Bearish crossover with its moving average
🔹 Volume:
📊 Big red candle with strong volume = heavy selling pressure
🔹 BBTrend:
📉 Bullish momentum is fading
⸻
📌 What to Watch:
If price breaks below the midline of the channel, we could see a test of the $1.00 or even $0.88 support. However, a bounce from here with volume confirmation could signal continuation toward the top of the channel 📈.
⚠️ Stay cautious – trend is bullish but clearly under pressure.
⸻
#WLD #Crypto #Altcoins #TradingView #TA #TechnicalAnalysis #USDT #CryptoTraders #PriceAction
