Trade ideas

WLD – Impulse, Correction, and What’s Next!Worldcoin (WLD) has just completed a massive impulse leg to the upside, followed by a sharp correction phase. Price is now retracing toward a strong demand zone, where bulls may look to re-enter.
⚡ Impulse Move: A parabolic run recently pushed WLD into new highs.
📉 Correction: Price is currently retracing in a controlled downward channel.
🟠 Demand Zone: The $1.40 – $1.50 area is a key zone where buyers previously stepped in strongly.
🚀 Potential Next Impulse: If this demand holds, WLD could launch the next bullish leg, potentially aiming back above $2.00 and beyond.
📌 The coming sessions will be crucial: will the demand zone hold and trigger another impulse, or will sellers break it for a deeper retracement?
This is an educational analysis, not financial advice. Always apply proper risk management when trading.
📚 Stick to your trading plan regarding entries, risk management, and trade execution.
Good luck!
All Strategies Are Good; If Managed Properly!
~Richard Nasr

WLDUSDT Forming Bullish PennantWLDUSDT is showing strong technical strength with the formation of a bullish pennant pattern, which is considered a continuation signal after an initial upward rally. This structure highlights a period of consolidation where the price is coiling within narrowing ranges, typically before resuming its upward momentum. With good volume supporting this setup, the chances of a breakout remain high, targeting gains in the range of 50% to 60%.
The bullish pennant pattern generally reflects healthy market conditions, where traders lock in profits after a rally while new buyers step in to sustain momentum. For WLDUSDT, this behavior signals confidence among investors that higher valuations may follow once the resistance trendline is breached. The increasing accumulation during this consolidation phase is a positive indicator of strong underlying demand.
Market sentiment around WLDUSDT has been gaining traction, with more investors taking interest in this project. This surge in attention aligns with the technical setup, further boosting the probability of an extended bullish move. If momentum continues to build, this pair could establish new short-term highs, making it a closely watched opportunity for traders.
In summary, WLDUSDT is well-positioned within a bullish pennant pattern, supported by solid trading volume and growing investor confidence. With expected gains of 50% to 60%, the breakout potential looks promising for both short-term traders and long-term investors.
✅ Show your support by hitting the like button and
✅ Leaving a comment below! (What is You opinion about this Coin)
Your feedback and engagement keep me inspired to share more insightful market analysis with you!

WLD it's time to take profitWlD was mooning like a lot but for a healthy growth it needs a deep correction other wise this is just pump and dump
WLDUSDTAccording to the previous analysis, it completed its second leg with good momentum, but it was only slightly involved in a time correction. Now, if it maintains this momentum and stabilizes, it can see the next levels.

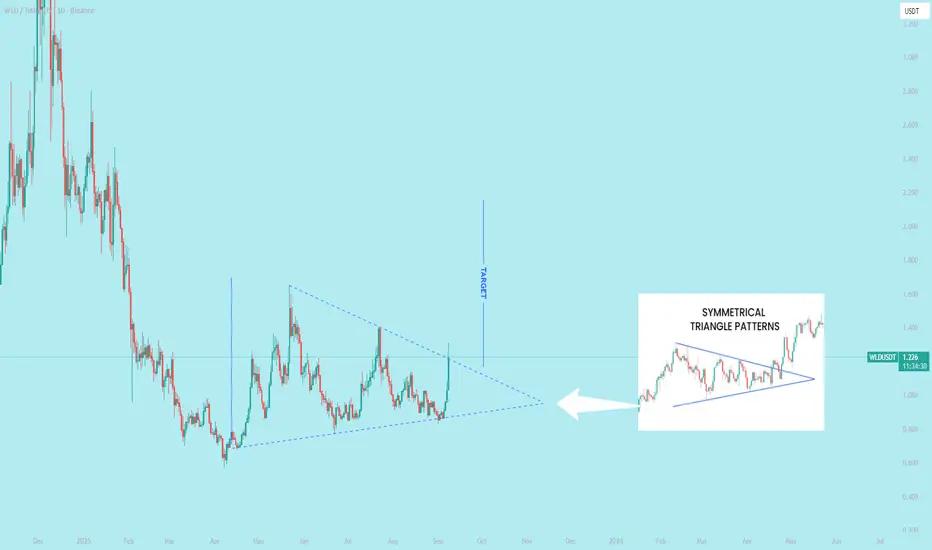
$WLD Performing Bullish Symmetrical Patterns
`charting patterns in technical analysis formed by two converging trendlines: one descending and one ascending. They signify a period of consolidation where price movements become narrower, indicating a temporary balance between buyers and sellers. A key characteristic is the decrease in trading volume as the pattern forms, followed by a surge in volume when a breakout occurs.`
DeGRAM | WLDUSD has rapidly broken out of the triangle📊 Technical Analysis
● WLD/USD broke out of a prolonged triangle pattern after a false downside move, confirming bullish reversal momentum.
● Price surged past the 1.65–1.90 resistance zone, with the next upside objectives seen at 2.15 and 2.40, while 1.65 now acts as key support.
💡 Fundamental Analysis
● Renewed investor appetite for AI-related tokens and rising trading volumes across major exchanges are fueling WLD’s rally, reinforcing the breakout’s strength.
✨ Summary
Bullish above 1.65; targets 1.90 → 2.15 → 2.40. Invalidation on a close below 1.65.
-------------------
Share your opinion in the comments and support the idea with a like. Thanks for your support!

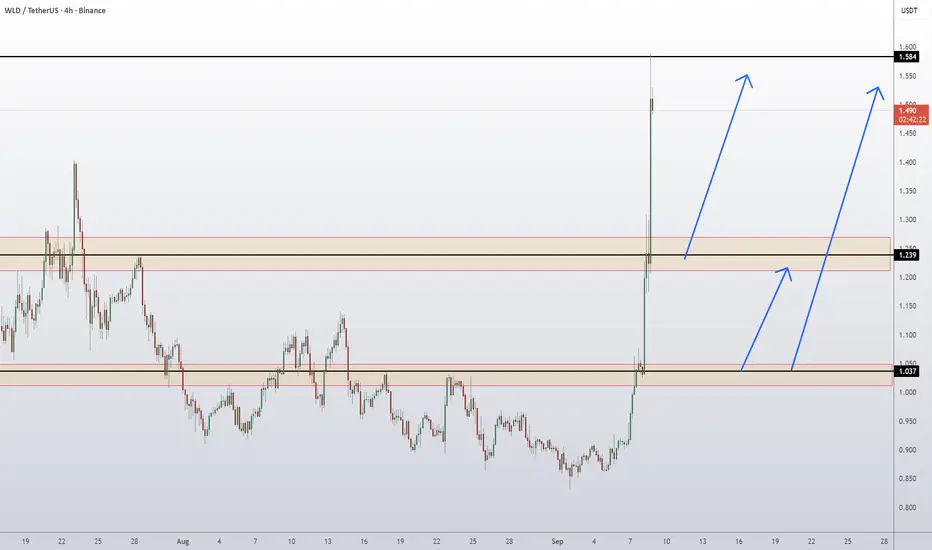
WLD Coin Worldcoin Token Price Prediction and Technical AnalysisWLD/USDT has exploded higher with a massive breakout, surging past the 1.037 resistance and clearing the 1.239 supply zone, which is now turning into support. Price is currently consolidating near the 1.494 area, with upside momentum still strong. If buyers sustain above 1.239, continuation toward the upper resistance at 1.551 – 1.584 looks likely. However, any failure to hold above 1.239 could trigger a pullback toward 1.037 demand before another push higher.
📈 Key Levels:
Buy trigger: Retest/hold above 1.239 support
Buy zone: 1.23 – 1.25 region
Target: 1.551 – 1.584 resistance
Invalidation: Daily close below 1.037 (would weaken bullish momentum)
👉 Follow me for More Real Time Opportunities.
Share your Thoughts if you have any?
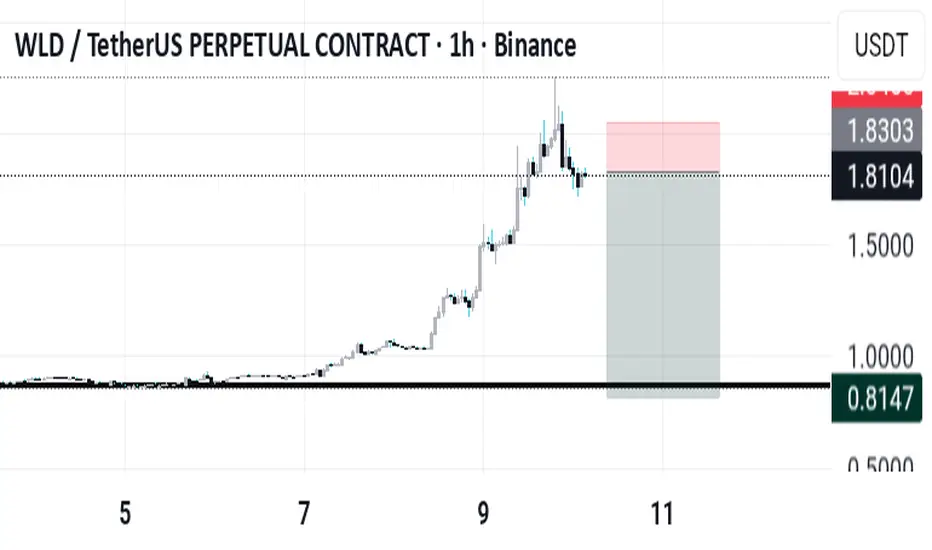
WLDUSDT – Breakout Confirmed, Eyes on $1.78 and Higher📈🌐 WLDUSDT – Breakout Confirmed, Eyes on $1.78 and Higher 🚀🧠
WLD continues to deliver clean technical setups—and yesterday’s breakout gave us a perfect new entry at the base of this rising channel. This update builds on the same structure I’ve been tracking since early May, now reinforced by both fundamentals and price action.
🔍 Technical Outlook:
📌 New Support Zones:
$1.0633
$1.4185
📌 Next Targets:
🎯 Target 1 – $1.7827
🎯 Target 2 – $2.5275
and then if the markets help we can dream for:
🎯 Target 3 – $3.5074
🎯 Target 4 – $5.0708
🎯 Target 5 – $8.6900
🎯 Target 6 – Upper extension (long-term trajectory toward $16+)
The structure follows the classic market rhythm:
1️⃣ Falling Channel Breakdown
2️⃣ First Re-Entry with Support Reclaim
3️⃣ Perfect Flag Retest → New Rally Begins
🧠 Why WLD?
One of Leading Layer 2 inflows last week across all chains
Expanding ecosystem with real-world apps:
🎮 Humans vs AI
🏨 Hotels Cryptorefills
👤 Human Actions (identity layer tech)
And many many more.
Worldcoin’s biometric World ID system continues expanding in the US and Asia—bringing new users into the WLD economy
⚠️ Note: WLD is a high-volatility, speculative asset. Trade setups like this follow strong momentum patterns—but always manage risk and respect invalidation levels.
One Love,
The FXPROFESSOR 💙

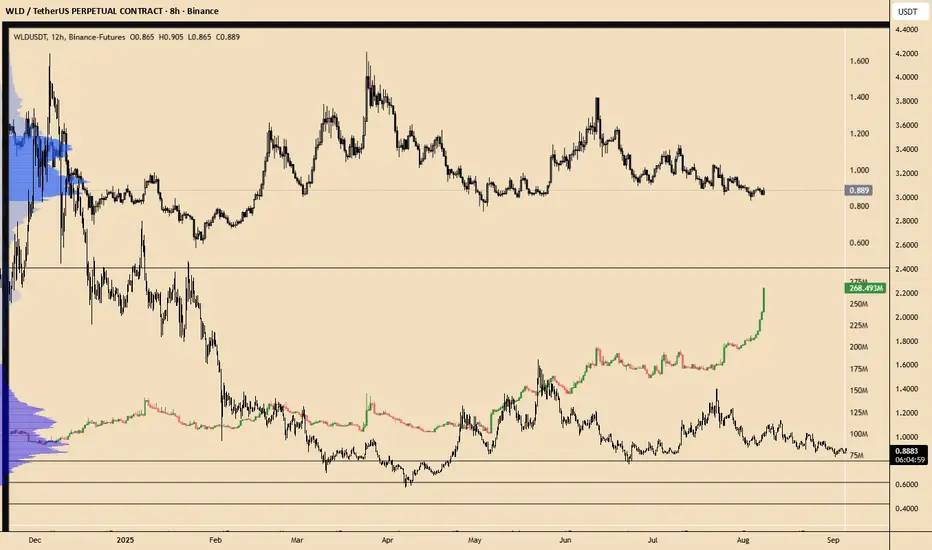
WLD - open interest increaed by 160m - something big is coming!!WLD - open interest increaed by 160m - something big is coming!!
price is at range low - chances for rise are big
WLD CAN DO IT AGAIN..It's been a long time since WLD showed a new increasing trend.
Following the coming hours to see if WLD is able to open a new cycle
Never enter any trend directly, wait for the confirmations, and trade only depending your setups.
WLD did show before at good cycle times, that it can do even 12 usd in short term

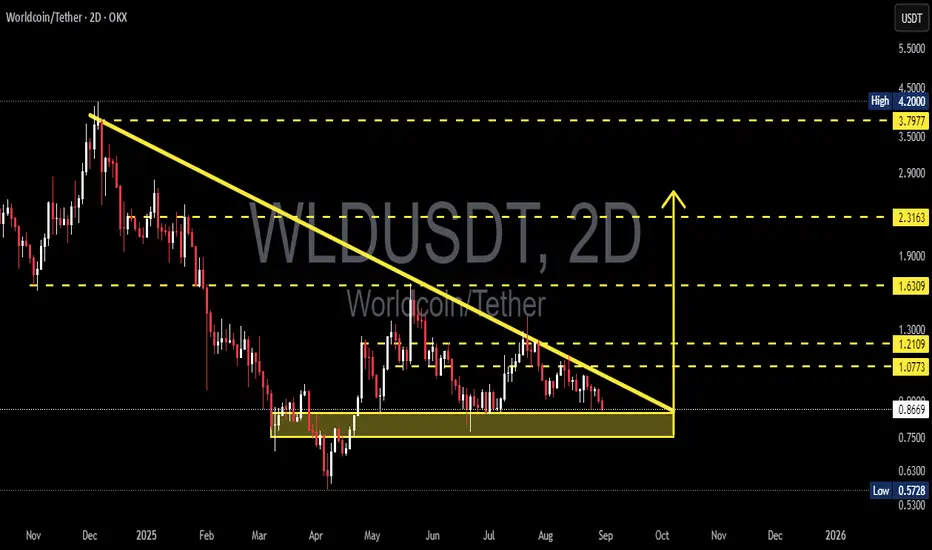
Worldcoin WLD price analysis#WLD is approaching the upper boundary of a falling channel that has been shaping the trend for more than 1.5 years.
🔎 The key area OKX:WLDUSDT sits around $1.50, and market reaction there will likely define the mid-term direction:
✅ A breakout with strong volume could trigger a continuation toward $3.50–3.75.
❌ Failure to gain momentum may lead to another decline, potentially down to $0.90.
This makes $1.50 a critical zone to monitor closely.
______________
◆ Follow us ❤️ for daily crypto insights & updates!
🚀 Don’t miss out on important market moves
🧠 DYOR | This is not financial advice, just thinking out loud.

WLD: Descending Resistance Finally BrokenMIL:WLD has broken out of the long-term descending resistance line, signaling weakening selling pressure. Price is now trading around 1.27, reclaiming the 1.25–1.35 resistance zone.
Sustaining above this area could push toward 1.60, while slipping back below may signal a false breakout with downside risk toward 1.00.
In short, WLD is at a pivotal stage, holding above keeps the breakout valid, rejection could trap late buyers.
DYOR, NFA

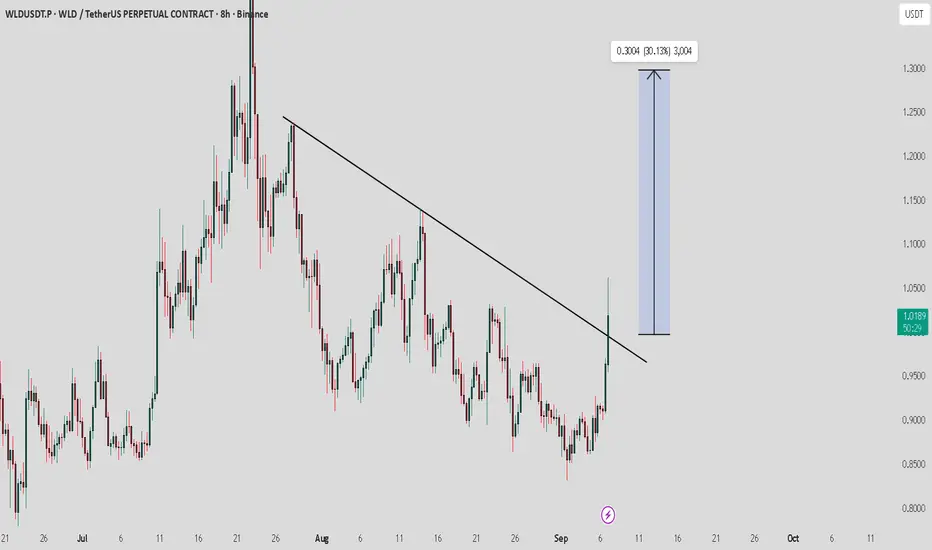
WLD / USDT : Breaking out with strong potentialWLD/USDT is breaking out of trendline resistance with strong potential. This breakout could signal the start of a strong rally ahead.
If the breakout holds, the next upside targets are $1.10 – $1.20 – $1.30. A successful retest would further strengthen this setup.
Always wait for a clear bullish signal and candle close to avoid fakeouts. Manage risk wisely before entering.
A clear impulse correction for WLDUSDTWLDUSDT has formed an impulse and done it's ABC correction.
I think it is solid to think it will continue to go up to at least
$1.6, a simple idea from your legendary trader, who forecasted HOOD
uptrend on my youtube channel. :) BINANCE:WLDUSDT

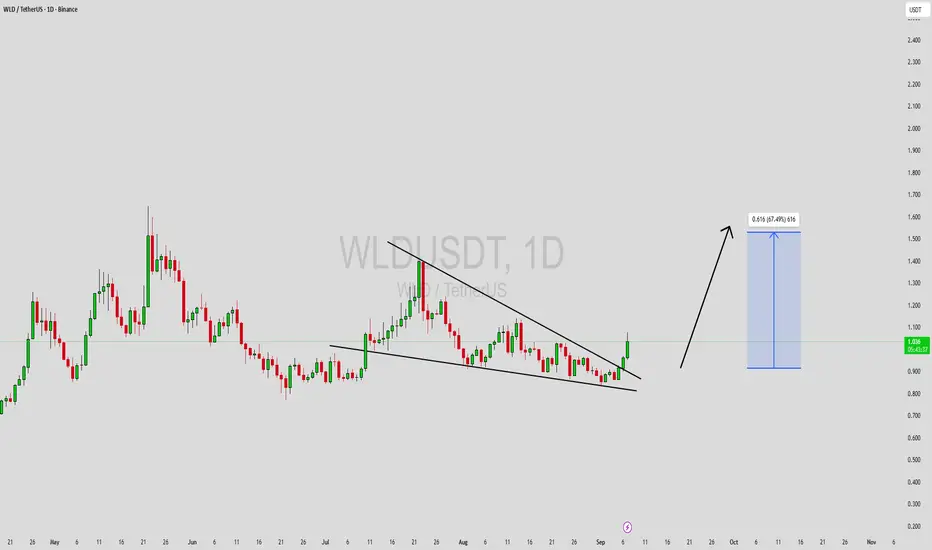
WLDUSDT Forming Bullish Falling WedgeWLDUSDT is currently showing a strong breakout setup after forming a bullish falling wedge pattern on the daily chart. This technical structure often signals a potential reversal and trend continuation to the upside. With the breakout confirmation and price momentum building, WLD is now targeting a gain of 50% to 60%+, supported by solid volume inflows.
The trading activity suggests that market participants are stepping in at key levels, indicating strong investor confidence. The breakout move is further validated by healthy buying pressure, which increases the probability of WLD reaching higher resistance zones in the coming sessions. Such technical alignment provides a favorable risk-to-reward setup for swing traders and medium-term investors.
Investor interest in WLDUSDT has been steadily growing, as the project gains traction in the broader crypto space. The combination of strong technicals, increasing volume, and heightened market sentiment is creating a positive outlook for this pair. If momentum continues, WLD could establish new short-term highs, validating the expected bullish move.
In summary, WLDUSDT’s falling wedge breakout backed by strong volume signals an optimistic outlook with potential gains of 50% to 60%+. With increasing investor interest and technical strength, this setup is one worth watching closely for a significant bullish run.
✅ Show your support by hitting the like button and
✅ Leaving a comment below! (What is You opinion about this Coin)
Your feedback and engagement keep me inspired to share more insightful market analysis with you!
WLD/USDT 4-Hour Technical AnalysisA long-term descending trendline is still intact, stretching from the top left of the chart toward the mid-section. However, the price is currently holding above key support zones, showing signs of attempting a breakout toward resistance levels.
The descending trendline has not yet been broken, but price action is approaching it with increasing buying pressure.
A 4-hour candle close above 1.074 could open the path toward 1.139.
If the price pulls back, 0.952 is the first level that must hold to maintain the short-term bullish structure.

#WLD/USDT#WLD
The price is moving within a descending channel on the 1-hour frame and is expected to break and continue upward.
We have a trend to stabilize above the 100 moving average once again.
We have a downtrend on the RSI indicator that supports the upward break.
We have a support area at the lower boundary of the channel at 0.850, acting as strong support from which the price can rebound.
We have a major support area in green that pushed the price upward at 0.840.
Entry price: 0.951.
First target: 0.981.
Second target: 1.023.
Third target: 1.074.
To manage risk, don't forget stop loss and capital management.
When you reach the first target, save some profits and then change the stop order to an entry order.
For inquiries, please comment.
Thank you.

WLDUSDTHi snipers. On the daily time frame, after a sharp price decline in the past months and the formation of a price bottom, the price is reversing. And we are witnessing the formation of a descending triangle, which according to statistics has a 40% probability of an upward breakout and a 60% probability of a downward breakout. But here we are also witnessing a divergence. The price is moving downward, the RSI is moving upward, which is a good sign for a price increase. I am learning. This is not a buy or sell offer.

WLDUSDT — Decision Point at the Edge of the TriangleChart Structure:
WLD/USDT has been forming a large descending triangle for months.
The chart shows a series of lower highs pressing down against a flat base support at $0.80–$0.90 (yellow box).
Current price sits around $0.87, right at the critical zone where a decisive move is highly likely.
---
🔎 Technical Pattern
Descending Triangle → typically a bearish continuation pattern, but it can also trigger a false breakdown before a major reversal.
This area now acts as a battlefield of accumulation vs distribution. If buyers hold the line, a bullish reversal is possible.
---
🚀 Bullish Scenario (Potential Reversal)
1. Key trigger: 2D candle close above the descending trendline and hold >$1.08.
2. Validation: Successful retest of $1.08 as new support.
3. Upside targets:
$1.21 → first resistance
$1.63 → strong supply zone
$2.32 → mid-term target
$3.80–$4.20 → major supply zone if momentum continues
4. Invalidation: Failure to stay above $0.95 after breakout.
---
📉 Bearish Scenario (Potential Breakdown)
1. Main trigger: 2D close below $0.80 (triangle base breakdown).
2. Validation: Retest $0.80–$0.85 as resistance.
3. Downside targets:
$0.63 → minor support
$0.57 → historical low
4. Invalidation: Quick reclaim and hold above $0.90–$0.95.
---
⚖️ Conclusion
WLD is entering a make-or-break phase.
A confirmed breakout could start a recovery trend with upside targets up to $2.32 and beyond.
A breakdown, however, could lead to capitulation toward $0.63–$0.57.
As price is now compressed at the tip of the triangle, a major move is imminent.
---
✍️ Suggested Caption for TradingView
“WLDUSDT is at a critical decision point inside a descending triangle.
Bullish case: Break and hold above $1.08 → targets $1.21 / $1.63 / $2.32.
Bearish case: Breakdown below $0.80 → targets $0.63 / $0.57.
The market is about to decide — accumulation or capitulation?”
#WLDUSDT #Worldcoin #CryptoAnalysis #TechnicalAnalysis #DescendingTriangle #SupportResistance #PriceAction #Breakout #Breakdown #CryptoTrading
Worldcoin · 400% vs 1800% · Wait vs Margin/LeverageSomething simple. We've already seen hundreds and hundreds of moves in the +200% to +400% range. Hundreds of these over the years... How many times have you earned 400% in a single trade? How often? The trick is to wait.
Here we have Worldcoin (WLDUSDT) and only last month it seemed like it was already too late. Prices were moving up; the start of the next bullish wave. The market always gives a second chance and I see this happening now. A second chance to enter, a second chance to buy low, a second chance to buy and hold.
The trick is to wait.
You can do any math, tons of maths or very simple maths. A capital of $10,000 if you consider a four months wait. Can be two months or can be one month but you are ready to wait between 4 to 8. Even up to eight months without a sweat.
We see the charts over and over, and we see +300%, +400%, +500%. Can you get this one?
Buy and hold WLDUSDT, spot, wait until the 400% target hits and close the trade. It can happen within just two months or it can take more. The truth is that the market can take as long as it takes. If we are ready to wait, we've already conquered this section of the market and we can move to the more advanced tools, margin/leverage.
Thank you for reading.
Namaste.

#WLD/USDT#WLD
The price is moving within an ascending channel on the 1-hour frame, adhering well to it, and is on its way to breaking strongly upwards and retesting it.
We have support from the lower boundary of the ascending channel, at 0.946.
We have a downtrend on the RSI indicator that is about to break and retest, supporting the upside.
There is a major support area in green at 0.943, which represents a strong basis for the upside.
Don't forget a simple thing: ease and capital.
When you reach the first target, save some money and then change your stop-loss order to an entry order.
For inquiries, please leave a comment.
We have a trend to hold above the 100 Moving Average.
Entry price: 0.951
First target: 0.968
Second target: 0.994
Third target: 1.027
Don't forget a simple thing: ease and capital.
When you reach the first target, save some money and then change your stop-loss order to an entry order.
For inquiries, please leave a comment.
Thank you.

WLD/USDT — Testing Major Demand Zone — Breakout or Bull Trap?Summary:
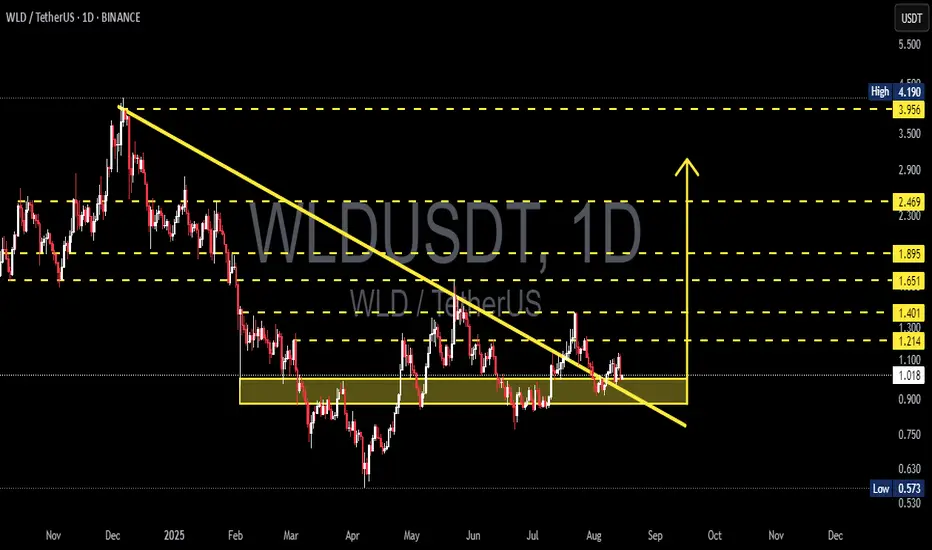
Price is sitting right inside a major demand zone (~0.90–1.10 USDT) after previously breaking above and then pulling back around the long-term descending trendline (yellow line). This zone has repeatedly acted as a strong floor — the next move (bounce & rally vs. breakdown) will set the medium-term direction.
---
Key Levels
Current price ≈ 1.014 USDT (dotted line).
Demand / support zone: ~0.90 – 1.10 USDT (yellow box).
Resistances / upside targets: 1.214, 1.401, 1.651, 1.895, 2.469 USDT.
Structural high: ~3.95 – 4.19 USDT.
Major low: 0.573 USDT.
---
Pattern Analysis
1. Multi-month descending trendline — the yellow line shows a sustained downtrend from Dec–Jan highs. Sellers have dominated until a potential structural shift.
2. Breakout & retest — price broke above the trendline earlier but fell back into the demand zone → this could be a breakout + retest (bullish) or a false breakout / bull trap (bearish) depending on confirmation from price & volume.
3. Range / consolidation — since March–May, price has been oscillating around the yellow box → a clear accumulation/demand area.
4. Lower highs structure is still visible on the higher timeframe — sellers are not fully out of the picture.
---
Bullish Scenario
Confirmation needed: Daily close above 1.214 USDT (stronger if backed by higher volume).
Conservative plan: Wait for a daily close > 1.214 and enter on a retest; stop below 1.01), stop tight at 0.88.
Example R:R (entry 1.014, stop 0.88):
Target 1: 1.214 → +19.7% upside, ~13.2% risk → R:R ≈ 1.5:1.
Target 2: 1.401 → +38.2% upside → R:R ≈ 2.9:1.
Target 3: 1.651 → +62.8% upside → R:R ≈ 4.8:1.
Note: Hold / trail stop after 1.401 break to maximize potential.
---
Bearish Scenario
Confirmation needed: Daily close below 0.90 with strong selling volume.
Downside targets: Next major support ~0.57 USDT, with intermediate zone around 0.63–0.75 likely tested first.
Example short setup: Entry after breakdown (<0.90), stop above 1.214. Entry 0.90, stop 1.214, target 0.573 → ~36.3% profit, ~34.9% risk → R:R ≈ 1.04:1 (less attractive unless strong confirmation).
Note: A breakdown of this demand zone could trigger a sharp sell-off — use stop-loss.
---
Key Confirmation Signals
Volume spike during breakout/breakdown (volume up = stronger validation).
Daily/weekly close above resistance or below support (avoid false wicks).
Momentum indicators: Bullish divergence on RSI / MACD cross for longs; bearish momentum (falling RSI, MACD cross down) for shorts.
Trendline reaction: Long upper wicks = rejection; clean close = strength.
---
Risk Management Tips
Confirm setups on daily + 4H before entry.
Limit risk per trade (e.g., 1–2% of capital).
Beware of bull traps — don’t overleverage on weak-volume breakouts.
Use trailing stops when in profit.
---
> WLD/USDT — Testing major demand zone (0.90–1.10).
Previous breakout failed to hold momentum → price is back inside the accumulation zone. Watch for daily close >1.214 (bullish) or breakdown <0.90 (bearish). Manage your risk.
#WLDUSDT #Worldcoin #CryptoAnalysis #SupportResistance #Breakout #Retest #BullVsBear #TechnicalAnalysis #RiskManagement