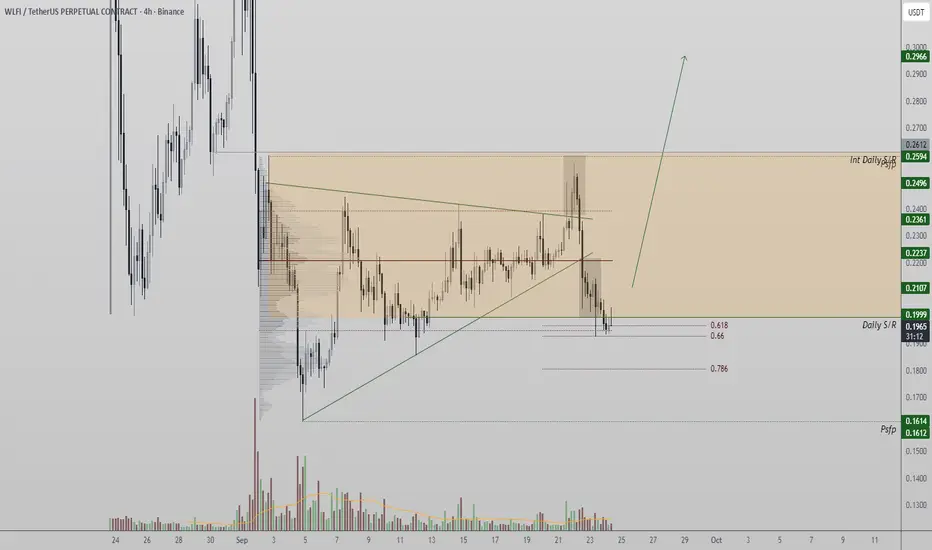
Liberty Financial (WLFI) – High Confluence Zone Signals Bullish Liberty Financial is holding firm at a critical confluence zone, where VWAP, the 0.618 Fibonacci, and daily SR overlap. Technical conditions support the potential for a bullish rotation from current levels.
Following recent corrective moves, WLFI has entered a zone of stacked confluences that often act as strong reversal regions. The setup also coincides with the development of a harmonic pattern, adding further weight to the bullish outlook.
Key Technical Points:
Price is testing VWAP and the 0.618 Fibonacci retracement.
Daily support-resistance levels align at the same zone.
Harmonic pattern formation suggests potential for bullish expansion.
The overlap of VWAP, Fibonacci retracement, and internal SR highlights a high-probability support cluster. WLFI’s reaction to this zone will determine whether price can launch a meaningful recovery. The formation of a harmonic structure also adds bullish confluence, suggesting that a breakout could lead to new all-time highs.
The key challenge remains volume confirmation. Without meaningful inflows, price may stagnate at current levels before another attempt higher. However, if buying pressure builds, WLFI’s technicals favor expansion.
What to Expect in the Coming Price Action:
If the confluence zone holds, WLFI could rotate upward with potential for all-time high retests. Failure at this level risks extended consolidation or deeper pullbacks.
WLFIUSDT.3S trade ideas

WLFI/USDT: Your Plan to Buy $WLFI Explained⚠️WLFI is currently consolidation around a strong intraday/daily support level.
To open a new buy position with confirmation, we recommend monitoring the resistance level within the established range on the 4-hour timeframe.
A bullish breakout, validated by a 4-hour candle closing above 0.2100, would offer a dependable bullish confirmation.
The target price is projected to be 0.251.
Conversely, if the price action forms a new lower low on the 4-hour chart, this setup will be invalidated.

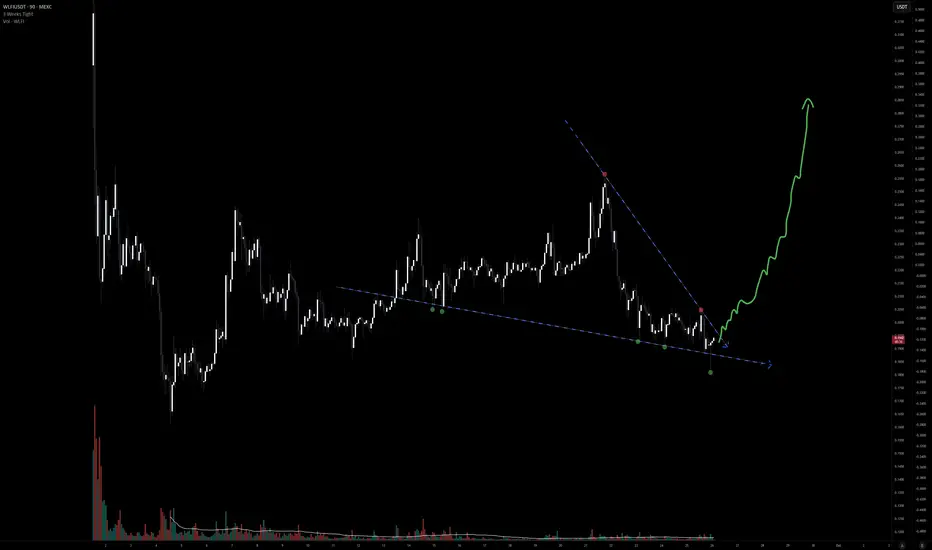
The Biggest Breakout in History ! #WLFIHas you can see in this chart the price is compressing a massive channel. once this channel break FOMO and traders will jump in making price breaking previous highs.
Im taking a massive long position and looking for closing around 1$

#WLFI Falling Wedge Pattern Breakout!WLFI Token is forming a falling wedge pattern and it will break any time soon, i really beleive we are going to see a huge spyke to the upside. Massive positive news for the token and crypto space rise in the next week on during the weekend!
WLFI will make millionaires i beleive and billioanires!
WLFI Bright Future AheadAfter an insane week, crypto is back and made the god candle in the monday opening.
So far the crypto market is hot, and more growth to come in the Q4.
- Debit card
- DEX
- DEBANKIN
- BURN TOKENS
- ERIC TRUMP, DONALD TRUMP
- POWER INTERESTS
Plus open interest has fallen and market keep rising this means leverage and shorts are not placed compare to spot buying and burn has well!

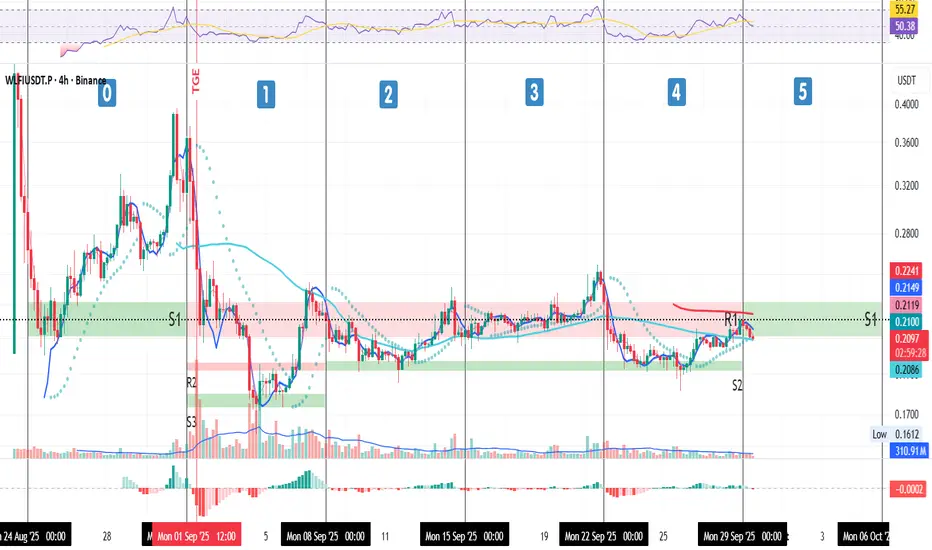
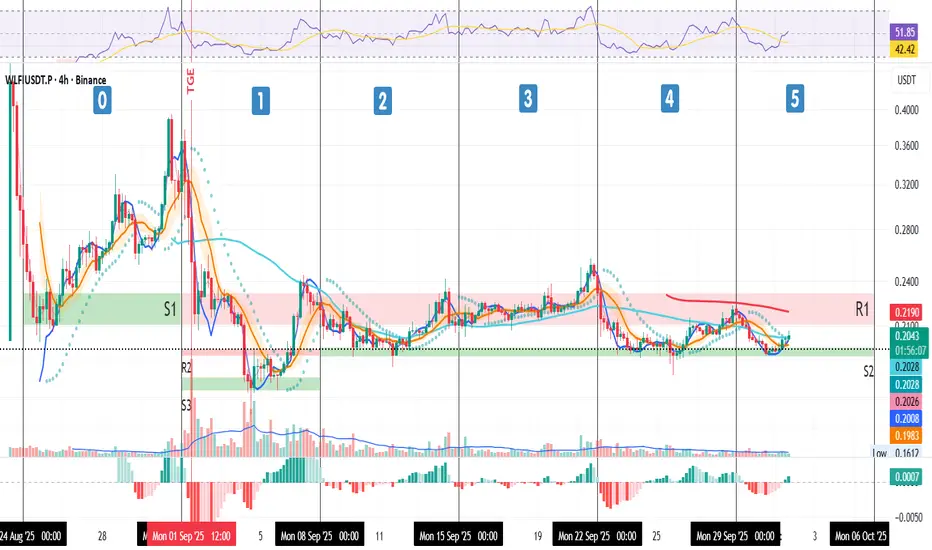
Week 5 Update – WLFI (4H)
Week 5 Update – WLFI (4H)
After holding S2 last week, price pushed higher into the red resistance zone, broke above the 50MA, and stopped right at the newly-formed 200MA, sitting perfectly in the middle of that red zone.
Today (Monday), price is testing the bottom of the S1 zone as support, which is now aligned with the 50MA, an important confluence level.
📈 Position:
I’m still long and plan to hold for a longer period, as long as the structure stays intact.
⚠️ Risk Management:
If price closes under S2, I’ll start scaling out to protect capital and avoid liquidation.
Always take profits and manage risk.
Interaction is welcome.
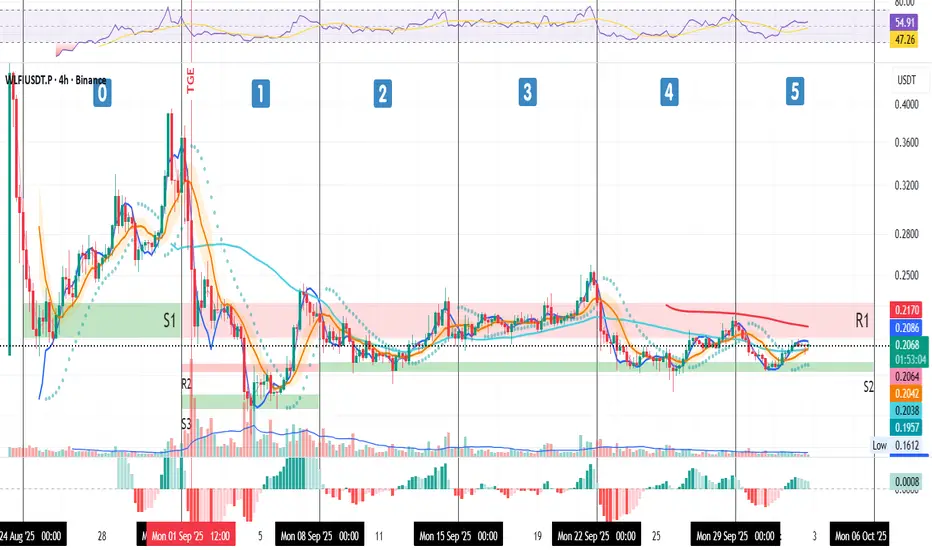
Week 5 / Oct 2 – WLFI 4H UpdateWLFI 4H Update – Week 5 / Oct 2
Price action holds above 50MA, SMA (pink), BB center, and MLR. The 200MA at R1 remains the ceiling to watch.
PSAR has flipped bullish, MACD positive, RSI steady above mid-level. Momentum structure points upward as long as support holds.
On the fundamentals, sentiment is boosted by Token2049 exposure and the new Aptos partnership, adding real weight behind the chart.
⚠️ Risk Management:
If price closes under S2, I’ll start scaling out to protect capital and avoid liquidation.
Always take profits and manage risk.
Interaction is welcome.
WLFI – Swing Trade Setup at Key SupportWLFI is currently testing a major support zone between $0.2000 – $0.2100, which aligns with a rising trendline on the 4H chart. This zone has previously acted as a strong base, and current price action suggests the potential for a bullish reversal. We're watching this area closely for a long swing trade opportunity.
📈 Entry Zone: $0.2000 – $0.2100
🎯 Take Profit Targets:
• TP1: $0.2200 – $0.2300
• TP2: $0.2400 – $0.2800
🔻 Stop Loss: 4H candle close below $0.1950 (invalidates the trendline support)
If price holds this zone and confirms with bullish structure, this trade offers a solid R:R. Always wait for confirmation and manage risk appropriately.

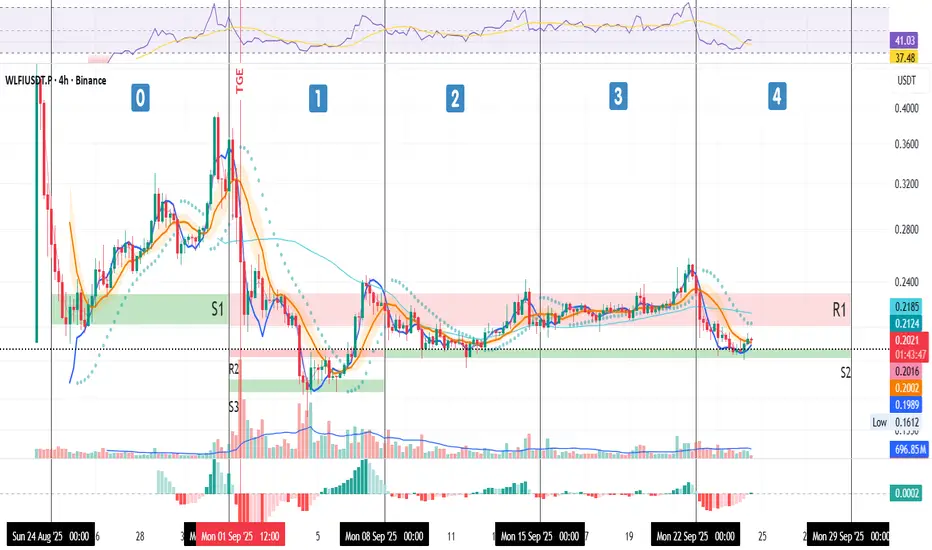
WLFI – Week 4 Test at SupportThis is $WLFI on the 4H
We’re now in week 4 since TGE, and some key price zones are starting to stand out:
🔹 S1 / R1 Zone: Started as support in week 0 (pre-TGE), flipped to resistance in week 1, and has remained resistance ever since.
🔹 R2 / S2 Zone: Started as resistance in week 1, flipped to support, and continues to hold.
🔹 S3 Zone: Acted as support only during week 1.
Right now, price is finding support at the S2 zone, after making a higher high above R1 last week. The recent 25% drop came with the broader crypto liquidation event early Monday, one of the largest in months. But here’s what stands out: selling volume wasn’t as heavy as week 1, suggesting sellers aren’t pushing as aggressively.
From a system perspective:
✅ Price is now above the pink SMA, orange BB center, and blue MLR → signs of leveling out.
⚠️ Price is still under the PSAR and the cyan 50MA → technically still in a downtrend.
I can’t predict what happens next, but I can prepare for scenarios.
🎯My focus: this looks like a good area to scale in, but risk management is key: if price loses S2, I’ll start scaling out to derisk and avoid liquidation.
Fundamentals Back the Case:
WLFI’s roadmap is getting stronger:
• USD1 stablecoin adoption is accelerating
• App launch + debit card are near
• Community engagement & governance are growing
🎯 My Plan:
Yes, this is an area where I scale in, but with strict risk management.
If price loses S2, I scale out to de-risk.
🔥 Conclusion:
This is where TA meets fundamentals.
If WLFI holds S2, the setup could become explosive.
Respect your risk and let the chart tell the story.
Always take profits and manage risk.
Interaction is welcome.
WLFI Tests Key Fibonacci and Value Area Support After LiquidityWorld Liberty Financial has retraced into a high-confluence support zone after a liquidity sweep on both ends of its range. The 0.618 Fibonacci retracement and value area low now hold the key to its next move.
WLFI has shown volatility in recent sessions, with a bullish expansion quickly reversing back below dynamic support. This whipsaw action reflects a classic liquidity trap, where traders on both ends of the market are caught offside. Price now sits at a critical technical area, where volume support and Fibonacci retracement levels converge. How the asset reacts here will determine whether a bullish reversal materializes or further downside risk opens up.
Key Technical Points:
- Liquidity Trap: Expansion quickly reversed, sweeping traders both sides.
- 0.618 Fibonacci + Value Area Low: Confluence of support currently tested.
- Volume Node Reaction: Bullish influx needed to sustain reversal.
Liquidity traps occur when price extends in one direction before reversing sharply, catching both longs and shorts. WLFI’s recent behavior fits this template perfectly, with an initial bullish expansion that quickly reversed back below dynamic support. This shakeout not only liquidated late buyers but also hunted liquidity from short-side participants.
The critical area now lies at the 0.618 Fibonacci retracement and the value area low. This confluence creates a technical foundation where reactions are often decisive. Historically, WLFI has shown strong responses from such regions, making this a pivotal area for bulls to defend.
Volume nodes in this region also indicate the presence of buyers. However, for a true reversal to take shape, bullish inflows must increase. Without this participation, the current structure risks becoming a failed auction, opening further downside exploration.
Market structure context is equally important. WLFI remains within a broader range, and this current low-end test offers the possibility of range rotation back toward higher levels. A strong bounce here would validate the equilibrium pattern, while failure would shift sentiment toward prolonged weakness.
What to Expect in the Coming Price Action:
WLFI is positioned at a high-confluence support zone, and the next sessions will be critical. A bullish influx of volume could propel price back toward the upper end of the trading range, while failure to hold this level risks extending the downside.
WLFI (SIGNAL)
Hello friends
Regarding the price flooring in the specified support area and the creation of higher floors, it can be said that if the specified resistance is broken, the price can move to the specified targets.
*Trade safely with us*

WLFI Huge trade Opportunity.With all the markets in the world rising, $WLFI will be the biggest gainer because is related to $trump they are going to do all to make it bounce up!
They have the money and the conections ...
In terms of tecnicals, price is rescpecting vwap now and we are jumping again has we jumped before at 0.18$.

WLFIUSDT.P - September 12, 2025This is a high-risk trading setup. The probability of success for this trade is low, and there is a significant chance of a full loss.
Entry Price: 0.1994
Stop Level: 0.1694
Profit Target: 0.2445

WLFIUSDT Forming Bullish MomentumWLFIUSDT is showing strong signs of bullish momentum with a clear bullish wave pattern forming on the chart. The recent price action suggests accumulation, backed by consistent trading volume, which is a positive indicator of potential continuation to the upside. Market sentiment appears to be shifting in favor of buyers, and investors are increasingly taking interest in this project.
With volume support and improving technicals, WLFIUSDT holds the potential for a significant upside move in the coming sessions. The bullish wave pattern highlights the possibility of breaking key resistance levels, which could trigger a strong rally. Technical traders are closely watching for confirmation candles to validate this move and drive momentum further.
If bullish pressure continues, WLFIUSDT may deliver impressive returns with an expected gain range of 90% to 100%+. This setup provides traders with a favorable risk-to-reward opportunity, making it an attractive pair to monitor in the current market environment. Long-term investors also view this development as a chance to accumulate before a larger breakout unfolds.
✅ Show your support by hitting the like button and
✅ Leaving a comment below! (What is You opinion about this Coin)
Your feedback and engagement keep me inspired to share more insightful market analysis with you!

WORLD LIBERTY FINANCE(#WLFI): Strong Bullish Signs?!📈WLFI may have completed the accumulation
Period following a completion of a strong bearish movement after launch.
I see a bullish breakout of a resistance line of a symmetrical triangle
on a 4H time frame.
This seems to indicate considerable buying interest.
The price could potentially continue to rise, possibly reaching the 0.30 to 0.50 level.

WLFI/USDT — Ascending Triangle Pressing: Major Breakout?📊 Full Analysis
The WLFI/USDT pair on the 4-hour timeframe is forming a clear Ascending Triangle pattern:
A strong horizontal resistance around 0.2410, repeatedly tested but not yet broken.
Higher Lows along the ascending trendline (yellow) show growing buyer strength and continuous accumulation.
This structure is a classic bullish continuation pattern, signaling that the market is building momentum for a potential breakout.
Still, crypto markets are never one-sided. Failure to break higher could lead to a sharp rejection or even a breakdown.
---
🟢 Bullish Scenario
1. A valid breakout occurs if the 4H candle closes above 0.2410–0.245 with strong volume.
2. If confirmed, upside targets based on the measured move are:
Conservative target: 0.28 – 0.30
Full measured move: 0.30 – 0.32
3. Watch for a possible retest of 0.241 as new support. A successful retest bounce would reinforce bullish continuation.
---
🔴 Bearish Scenario
1. If the price fails to break 0.2410, a rejection may send it back toward the ascending trendline support.
2. A confirmed breakdown below 0.225–0.228 invalidates the ascending triangle.
3. Bearish downside levels to watch:
First support zone: 0.20
Major support: 0.161 (previous significant low).
---
🎯 Key Levels
Resistance zone: 0.2410 – 0.245
Dynamic trendline support: 0.225 – 0.228
Next supports: 0.20 → 0.161
Bullish targets: 0.28 – 0.32
---
⚖️ Conclusion
WLFI/USDT is at a critical crossroads. The Ascending Triangle signals that buyers are steadily pressuring resistance. A confirmed breakout above 0.2410 with volume could unlock the path toward 0.30–0.32.
However, failure at resistance combined with a trendline breakdown could trigger a correction back to 0.20 or even 0.161.
Best strategy: wait for confirmation (breakout or breakdown), manage risk carefully, and scale out profits at key target levels.
---
#WLFI #WLFIUSDT #Crypto #Altcoin #AscendingTriangle #ChartPattern #Breakout #Bullish #Bearish #SupportResistance #PriceAction #TechnicalAnalysis

WLFI / USDT : Attempting breakout from horizontal resistanceWLFI/USDT is attempting to break out from horizontal resistance. If the breakout is confirmed, a short-term bullish rally towards $0.25 – $0.30 can be expected.
Always wait for confirmation before entering and manage risk properly.

Bring those high to me WLFIEasy Pattern same old story. Market Structure is awesome 😎.At Support. Also good fair price.

WLFI Daily on SPOT
Looking at the daily SPOT chart with Fibonacci levels, price action is showing some key spots.
Support: 0.5 Fib at $0.1984 (aligns with S2 from the 4H series).
Resistance: 0.236 Fib at $0.2354.
Technicals show early signs of strength: price is above the BB center and SMA, though PSAR is still bearish. RSI sits above its MA but remains under the mid-level.
Overall, the chart suggests price is condensing before a move. Considering the macro (rate cuts pushing risk-on), positive crypto news, and a historically bullish Q4, odds lean upward.
Patience and risk management remain key, otherwise you risk getting liquidated and watching price climb without you.
Always take profits and manage risk.
Interaction is welcome.

Week 5 / Oct 1 – WLFI 4H Update
Price action is holding support.
After bouncing off S2 as support, price is now pushing toward R1, where the 200MA sits, already proven resistance once.
Currently trading above the 50MA, SMA (pink), BB center, and MLR. PSAR looks ready to flip bullish. MACD has already crossed up, while RSI is above its MA and pressing into mid-range.
Momentum is cautious but tilting upward, shy signs of strength are building.
⚠️ Risk Management:
If price closes under S2, I’ll start scaling out to protect capital and avoid liquidation.
Always take profits and manage risk.
Interaction is welcome.

$WLFI TO $1THE TECHNICALS LOOK SO STRONG BUT OTHER THINGS INCLUDE: Its Long overdue for a crime pump, dont think trump family will just sit and do nothing.
Rate cut catalyst, Still seeing bullish rumours, more whales buying, more country adding to their reserves and DAT activities.

WLFI Consolidates in Equilibrium as Breakout LoomsWorld Liberty Finance Coin (WLFI) is trading at a critical inflection point, with price consolidating within an equilibrium structure. A breakout from this apex could define the next major move, with $0.36 emerging as the key upside target.
The altcoin market is experiencing periods of compression, and WLFI stands out as one of the clearest examples of structured consolidation. The coin has been oscillating around its point of control and daily support/resistance zone, with consecutive higher lows and lower highs forming a triangular apex.
This tightening price action is building pressure, and a breakout appears imminent. Traders are closely watching how WLFI resolves this equilibrium, as the outcome will dictate whether momentum continues to the upside or flips bearish.
Key Technical Points
WLFI is consolidating around the point of control and daily SR level.
Equilibrium apex forming with converging highs and lows.
A bullish breakout could accelerate price toward $0.36, backed by volume.
WLFI’s recent price structure highlights the textbook qualities of market equilibrium. Higher lows have demonstrated that buyers are defending support levels, while lower highs reveal seller pressure capping rallies. As these forces converge, a triangular apex has formed. Historically, such formations lead to significant volatility once resolved, and WLFI is positioned exactly at such a juncture.
This consolidation is occurring around the point of control, the area where the highest volume has transacted. The significance of this region lies in its ability to act as a magnet for liquidity. If buyers reclaim dominance here, price could quickly accelerate, targeting higher nodes on the volume profile.
