WLFI is doomed, aparently BINANCE:WLFIUSDT.P is definitely not a product-led demand or a real solution, but pure hype combined with influence first, and innovation later, if ever.
Read more:
www.cointrust.com
WLFIUSDT.3S trade ideas

$WLFI at the Edge: Support or Freefall?
This is $WLFI on the 1h TF.
The green zone looks like the last clear support. Price is testing a higher low inside it and aiming for a higher high just above, right under the 200MA; the 50MA is crossing down below the 200MA (death cross). That signal can cut both ways, curious about the two scenarios? Ask.
System-wise it’s still a downtrend: MLR < SMA < BB center, PSAR bearish. No doubt there.
My question: does price hold this green zone or not?
Context: I’m long here with basically zero liquidation risk. The real risk is a total fade, but my gut says WLFI survives and eventually melts faces, after shaking out plenty first. This ride will be one to remember.
Always take profits and manage risk.
Interaction is welcome.

World Liberty Financial · The Bullish Impulse—200% Target MappedThis is a very wide channel but I am sure you get the picture.
WLFIUSDT recently produced a crash, very strong bearish volume and a major low. But there is good news, the low ended up as a higher low compared to 24-August, the market bottom.
We have a clear trend, specially when considering the higher highs.
The initial trading was a sure drop, easy drop, easy to see.
The remaining portion of the chart simply shows a new project starting to wake up. It is becoming alive. It is growing and will continue to grow based on the signals coming from this chart.
As you can see, even with extreme pressure the bears were not able to produce a new low.
We have a classic ABC correction. After a classic correction, we get the bullish impulse, a 1,2,3,4,5 up-wave pattern. This looks like a good chart setup, another one.
Thank you for reading.
I appreciate the fact that you keep on coming back;
I appreciate your time and energy.
Your support is highly appreciated.
Namaste.

WLFI is bearishWLFI is bearish – Downward trend and potential continuation of the decline below the 0.2342 level, as indicated by the descending channel formation.

WLFIUSDT ReportWLFIUSDT Report
🔎 Technical Outlook
The chart shows a strong impulsive bearish leg after a failed continuation attempt near the resistance zone.
Before the drop, price moved in a steady upward channel, followed by consolidation and a breakout.
Current structure reflects a correction phase with potential for short-term recovery attempts, but broader sentiment remains cautious.
Market rhythm indicates liquidity sweeps to the downside before any sustainable upward momentum resumes.
🌍 Fundamental Outlook
Crypto Market Sentiment: General risk-off tone in digital assets has pressured smaller-cap tokens, leading to increased volatility.
Liquidity Conditions: Bitcoin dominance and institutional flows continue to affect altcoin performance, with WLFI moving in correlation.
Adoption & Utility: Being a project-based token, its demand depends on ecosystem developments, partnerships, and ongoing adoption progress.
Macro Drivers: Global monetary policy easing expectations can support crypto demand, but risk aversion creates short-term headwinds.
Investor Behavior: Current market shows defensive positioning, with capital concentrating into majors (BTC, ETH), reducing short-term altcoin strength.

Play the LONGTERM GAME with $WLFIPlay the LONGTERM GAME with TSXV:WLF
Remember that $TRUMP did 17x
$WLFI is going to 20usd - that's 92X
STOP SHORTING TODAY
Think LONGTERM

WLFIUSDT → Liquidation of hamsters before the rally to 0.3300BINANCE:WLFIUSDT.P is Trump's project. This relatively new coin is demonstrating aggressive and manipulative trading, but there are key areas on the chart that can be used as a guide...
We all know about the manipulative games of Trump's projects ;) and this can be used in trading... The WLFI coin has growth potential, but we need to wait for confirmation. Technically, this is a rather aggressive and manipulative game. A sharp drop and liquidation of all “hamsters” to the 0.25 - 0.20 zone. However, the price has stopped updating lows, volatility is decreasing (consolidation). If the price returns to the range, there will be potential for growth. At the moment, the price is not allowed to fall, consolidation is forming, with resistance at the 0.2521 trigger. The market is testing this trigger... At the same time, Bitcoin is strengthening and may support altcoins...
Resistance levels: 0.2521
Support levels: 0.2250, 0.2042
Technically, if the local structure does not break down and the price continues to storm 0.2520 - 0.255, this could lead to a return of the price to the trading range, which would open up the possibility of growth to 0.33.
The structure will break if the price breaks through the support level of 0.225 - 0.22.
Best regards, R. Linda!

$WLFI $BTC $TRUMPMr. President! Is it really this simple maybe not?Global markets eyeing financial liberty, targeting sub-0.2 zones, and buying on the reclaim!


WLFI Launch At Ridiculous Valuation | Stablecoin ComparisonBINANCE:WLFIUSDT.P is a protocol affiliated with the Trump family and managed by Chase Herro and Zak Folkman - both with a notorious past with Herro reffering to himself as the 'scumbag of the internet'.
World Liberty Financial has a major product in USD1. As of today its the sixth larget stablecoin by supply. $2.4b circulating with increasing adoption. USD1 is the main product of WLFI.
In the video I compare WLFI and USD1 to its competitors in BINANCE:ENAUSDT and USDe, NYSE:CRCL and USDC.
With this comparison you see a massive overvaluation of WLFI at ~$23b compared to $2.4b supply of USD1. Relative to ENA at $9b with $12b USDe supply. Circle is $30b with $70b USDC.
This shows an extreme extra cost added to WLFI with no real current product to rationalise it. Not to say that there wont be new products or a major expansion of USD1.. only that its priced as if theyve already achieved it.

WLFI 30min 200MA Break — Trouble Ahead?WLFI on the 30min TF
Up to TGE (black vertical line), the 200MA acted as support.
Today that broke, price closed below after rejection at the previous day’s close.
MLR < SMA < BB Center and PSAR is bearish, confirming a downtrend.
RSI is just above oversold, MACD is red, and sell volume is rising.
The key now is whether the green support area can hold.
Always take profits and manage risk.
Interaction is welcome.

WORLD LIBERTY FINANCE HAS LAUNCHED!Will it kick off this Bull market into hyperdrive?
Here are the Fib extensions based on the Futures price action so far.
Can it break a dollar?
Has it cemented #ETHEREUM as the dominant layer 1 for serious money?
Whilst relegating #SOLANA to gen Z high speed casino?
We shall find out in the coming 6 months.

Any idea how to trade this with weekly candle ? HahahahaThis chart is so funny I gotta share and laugh about it. What's the next weekly candle be like?

WLFI/USDT Bullish Reversal; Targeting 0.39 - 0.439Current Price: $0.2690
WLFI/USDT is showing a bullish recovery pattern on the 1H chart after bottoming near $0.245. Price has reclaimed short-term support and is pushing toward Fibonacci extension levels. A trade setup here offers a favorable risk/reward ratio (2:1 to 3:1+), with defined stop-loss support and upside targets aligning with $0.317, $0.344, and $0.392+
Support Zone: $0.2450 – $0.2600
Fibonacci Levels:
0.2911 (161.8%)
0.3164 (227.2%)
0.3446 (300%)
0.3685 (361.8%)
0.3929 (423.6%)
Upside Targets (from your chart projections):
Target 1: $0.3175 (+50.7%)
Target 2: $0.4103 (+69.1%)
Stop Loss Zone: $0.2450 – $0.2460
✅ Trade Setup
Entry: $0.268 – $0.270 (current zone)
Stop Loss: $0.245 (below key support) → ~9% downside
Take Profit 1: $0.317 (short-term Fibonacci target) → ~18% upside
Take Profit 2: $0.344 – $0.368 (medium-term fib targets)
Take Profit 3: $0.392 – $0.410 (long-term stretch target)
⚖️ Risk/Reward
R/R ratio for TP1 ≈ 2:1
R/R ratio for TP2 ≈ 3:1+
Best suited for short-term swing or breakout trade.
🚨 Note: This is not financial advice — just a trade idea based on chart. Always size positions carefully and use stop-loss discipline.

WLFI Bullish Reversal; Taregting 0.42 - 0.55 & 0.70WLFI/USDT is showing bullish recovery around 0.32 USDT after consolidation. If momentum sustains, upside targets are 0.38–0.42 short-term, 0.49–0.55 mid-term, and possibly 0.70+. Key support is 0.246–0.28; losing this may retest 0.20.
WLFI/USDT trading at 0.32 USDT, showing bullish recovery after consolidation.
🎯 Targets
Near-term: 0.38 – 0.42
Mid-term: 0.49 – 0.55
Extended: 0.70+ if momentum sustains
🛡️ Support / Risk
Strong support: 0.246 – 0.28
Breakdown risk: Retest of 0.20
⚠️Disclaimer: This is for educational purposes only, not financial advice. Crypto is highly volatile—trade at your own risk.

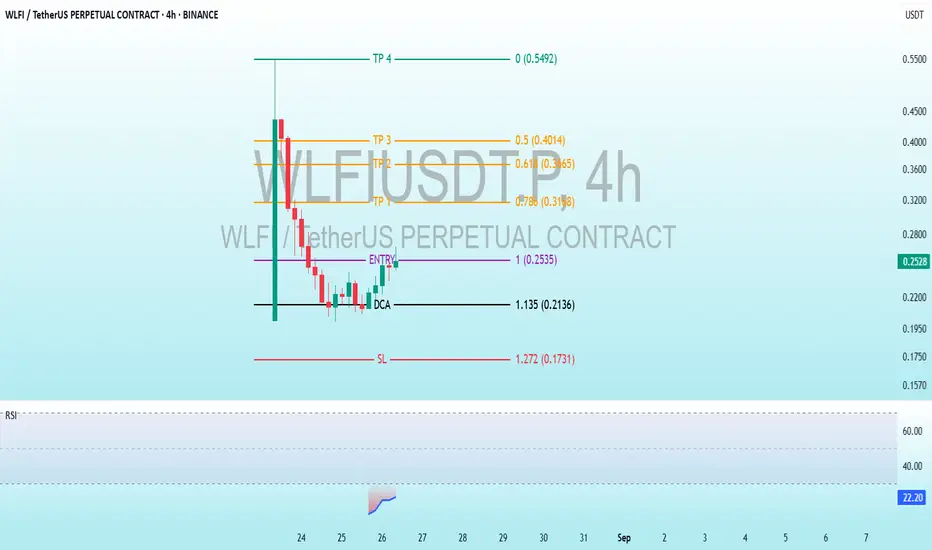
$WLFI Shocking Crash & Rebound Potential Exposed!BINANCE:WLFIUSDT.P
Entry Level: Marked at 1 0.2535 0.2560 USDT, indicating the intended entry point for a long position.
DCA (Dollar Cost Averaging): Set at 1.135 (0.2136) USDT, suggesting a level to add to the position if the price dips further.
Take Profit (TP) Levels:
TP1: 0.786 (0.3198) USDT
TP2: 0.618 (0.3665) USDT
TP3: 0.5 (0.4014) USDT
TP4: 0.0 (0.5492) USDT
Stop Loss (SL): Set at 1.272 (0.1731) USDT, above the entry to limit potential losses.
The price has dropped significantly below the entry and DCA levels, suggesting the strategy may need adjustment or that the stop loss has been triggered.
Technical Indicators
RSI (Relative Strength Index): The RSI at the bottom shows a sharp decline, moving into oversold territory below 30 (23 - 24). This indicates the price may be oversold and could see a potential reversal or consolidation soon.
Observations
The take profit levels are structured with decreasing targets, indicating a strategy to secure profits as the price moves lower from the entry.
The RSI entering oversold territory aligns with the sharp price drop, hinting at a possible bounce or stabilization if buying interest returns.
Conclusion
The chart outlines a trading strategy with a defined entry, stop loss, and multiple take profit levels for a long position in WLF/USDT perpetual futures. The significant price drop and oversold RSI suggest the price may be nearing a support level, potentially offering a buying opportunity near the current price or DCA level if bullish momentum resumes.