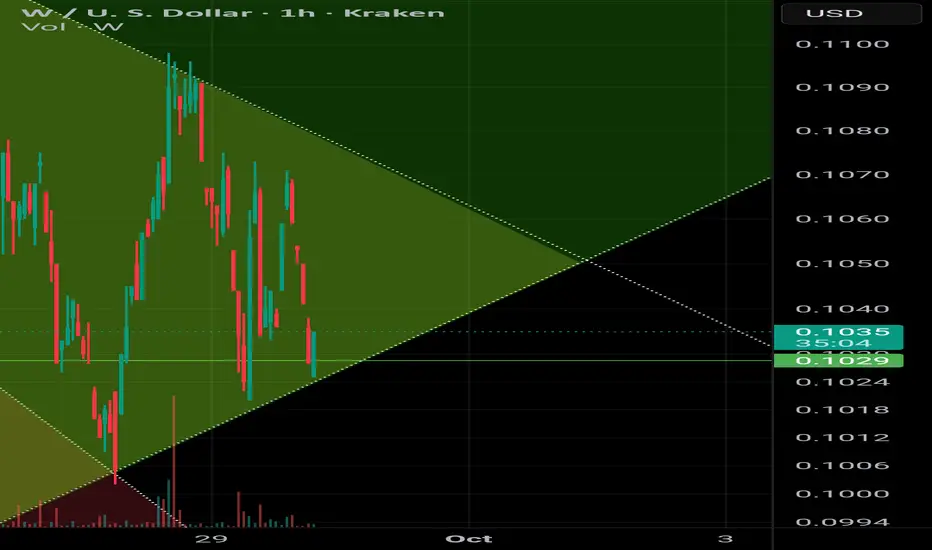
Testing new Strategy1. Broke above descending pennant and confirmed support.
2. Created a symmetrical triangle. Entering on support.
3. Predict that price will break above the symmetrical triangle- and use parallel channel as next resistance.
Theory: Price action goes from bearish, to neutral to bullish.
If price e
Key stats
Trading activity
Transactions 1.8 K
BuysSells
857943
Volume 410.08 KUSD
Buys volumeSells volume
225.92 K184.16 K
Traders 193
BuyersSellers
86107
About WSOL_CWHUXN.USD
Related DEX pairs
W / USDT Main trend. 23 03 2025Logarithm. Time frame 3 days. Descending channel, price in local clamping in consolidation at dynamic support of the internal channel. From listing -94% at the moment.
Local percentages, medium-term and long-term to key zones of chart logic and liquidity, are shown on the chart as a guide for build

WUSD will rise, so simpleTwo oscillation intervals, low near the lower boundary support position of the downtrend channel, followed by an uptrend

See all ideas
Summarizing what the indicators are suggesting.
Oscillators
Neutral
SellBuy
Strong sellStrong buy
Strong sellSellNeutralBuyStrong buy
Oscillators
Neutral
SellBuy
Strong sellStrong buy
Strong sellSellNeutralBuyStrong buy
Summary
Neutral
SellBuy
Strong sellStrong buy
Strong sellSellNeutralBuyStrong buy
Summary
Neutral
SellBuy
Strong sellStrong buy
Strong sellSellNeutralBuyStrong buy
Summary
Neutral
SellBuy
Strong sellStrong buy
Strong sellSellNeutralBuyStrong buy
Moving Averages
Neutral
SellBuy
Strong sellStrong buy
Strong sellSellNeutralBuyStrong buy
Moving Averages
Neutral
SellBuy
Strong sellStrong buy
Strong sellSellNeutralBuyStrong buy