CRUDE OIL (WTI): Strong Bullish Confirmation?!
Update for my yesterday's idea for WTI Crude Oil.
The price retested a recently broken structure and we see a
strong bullish reaction to that today.
A bullish violation of a resistance line of a falling wedge pattern
indicates a strong buying pressure.
I think that the market will continue growing and reach 64.65 resistance soon.
❤️Please, support my work with like, thank you!❤️
I am part of Trade Nation's Influencer program and receive a monthly fee for using their TradingView charts in my analysis.
WTI trade ideas

Crude Oil: Bearish FVG in Play Amid ConsolidationFenzoFx—Crude Oil is trading at $64.18, slightly below the bearish fair value gap. The sweep of yesterday’s lows suggests potential for a test of higher resistance. Immediate support is at $63.80. If this level holds, Oil may fill the bearish FVG and test resistance at $65.00. A break above could extend gains toward $66.50.
However, if price declines and stabilizes below $63.80, the bullish outlook is invalidated. In that case, the downtrend may resume, targeting the equal lows at $62.20.

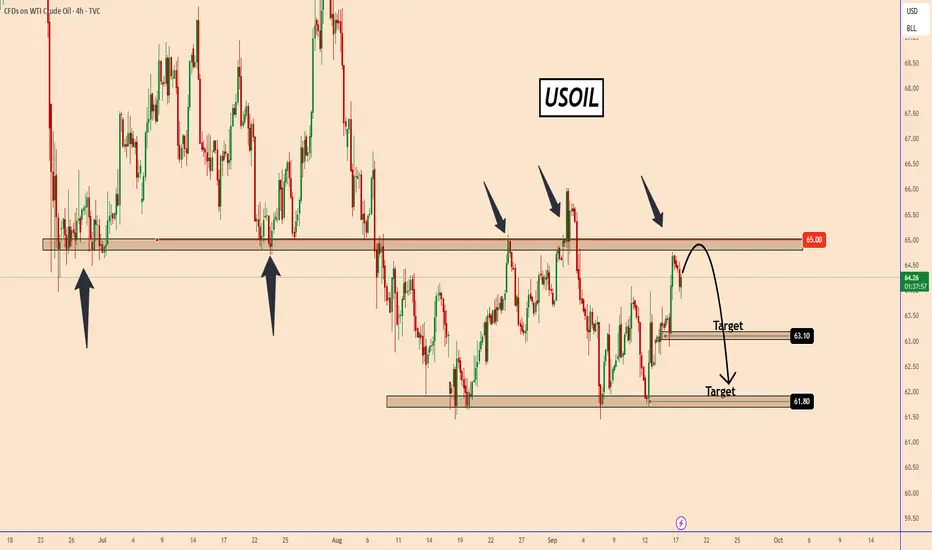
USOIL Analysis- Bearish OutlookUSOIL Analysis- Bearish Outlook
Crude oil is once again testing the resistance zone near $65.00, a level that has been rejected multiple times in the past. Sellers seem to remain strong at this area, keeping the price from breaking higher.
Currently, the chart suggests a possible pullback from resistance. If the bearish move continues, the first target is around $63.10, followed by the lower support area at $61.80.
As long as the price stays below $65.00, the short-term outlook remains bearish.
You may find more details in the chart!
Thank you and Good Luck!
❤️PS: Please support with a like or comment if you find this analysis useful for your trading day❤️
Oil’s rebound looks temporary amid various supply and demand prOil’s rebound looks temporary amid various supply and demand pressures.
Technical View
USOIL is currently rebounding from the support at 61.50, breaking above the previous swing high, while moving within a sideways range between 61.50 – 66.00, which should only be a short-term consolidation.
However, the broader trend remains bearish, as seen from series of lower swings, bearish EMAs, and the two-year Descending Channel. Once the consolidation phase ends, prices are likely to break below the lower bound downward.
So, the current rally in USOIL is expected to be only a short-term rebound, with resistance at 66.00 and at the upper bound of the descending trend channel just above 70.00.
On the downside, if USOIL falls below the lower bound of the sideways range at 61.50, it may retest the support at 55.00, the lowest point in 4.5 years, which if breaks, the prices could fall lower below 50.00.
Fundamental View
At present, oil prices are rebounding due to Fed easing expectation, which supported risk assets, while the weaker dollar is also helping to lift oil prices, which look like sentiment driven, not a solid fundamental.
Therefore, this recovery is likely only short-lived because, in the longer term, there are various pressures to the price:
Supply-side pressures :
Increased production from OPEC+ and non-OPEC countries has led to an oversupply in the oil market. For example, U.S. production at 13.4–13.6 mb/d covers most domestic needs, changing the country's positioning to a net exporter.
Demand-side pressures :
Global oil demand is slowing, particularly from China, amid sluggish global economic recovery and even recession risks in some regions, which have reduced overall energy consumption.
Growing investment in renewables and the gradual adoption of electric vehicles signal a structural transition that is likely to weigh on oil demand over the long term, reinforced by legislative bans on internal combustion engines in several countries.
Policy shifts from the US government also aim to push oil prices lower in order to control inflation.
Analysis by: Krisada Yoonaisil, Financial Markets Strategist at Exness

USOIL 66.0000It will be soon 66
and more content
stay with me
ask your question about your trades
😇😇

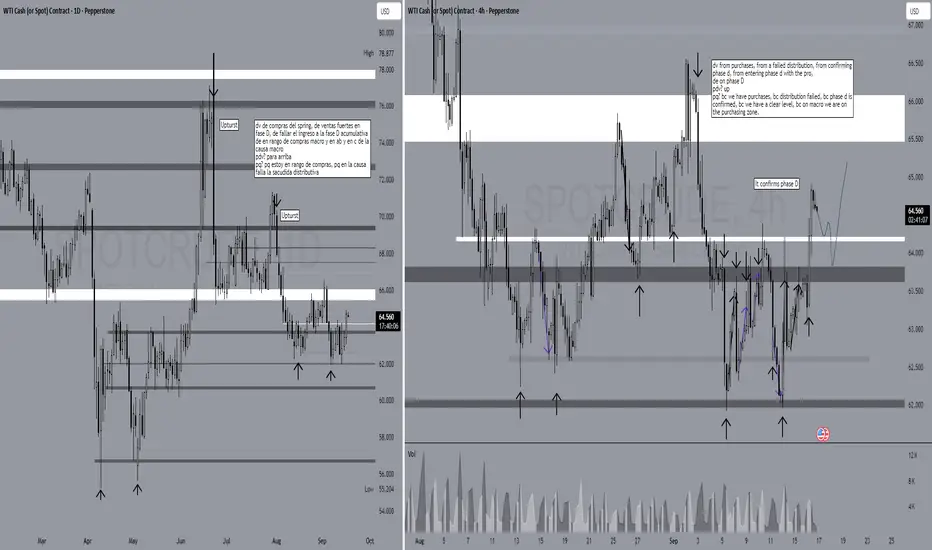
playing on C macroIt seems that we are on c macro, also the price just confirmed that we are on phase D. We only have to wait for the shakeout. start covering at 65.448 at least half of the position, then play aggressively with your st because we are facing a wall, however, it the wall is broken, we will start reaching higher prices till at least 68.262
this is not financial recommendations.
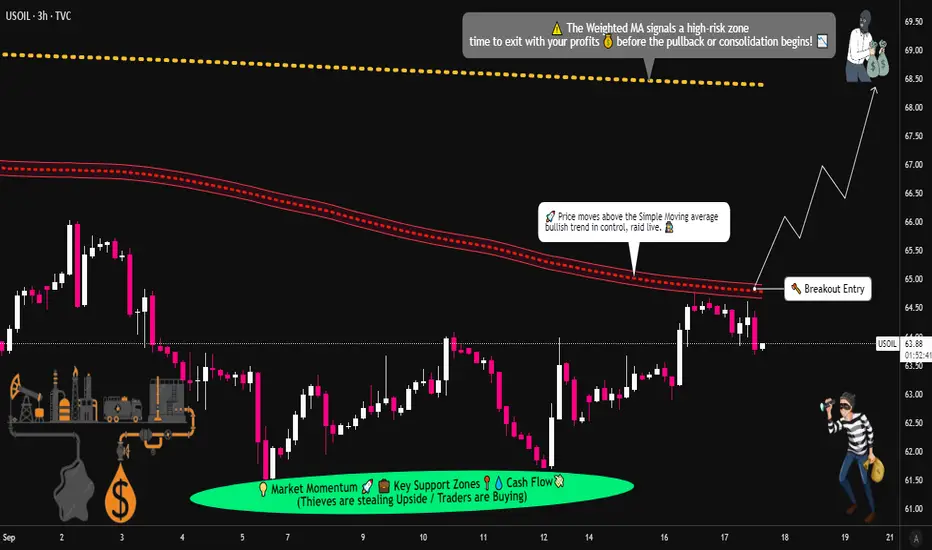
Can USOIL Break Higher? SMA Breach & Target at $68🛢️ USOIL Energy Market | Cash Flow Management Strategy (Swing/Day Trade)
📌 Trading Plan:
👉 Bias: Bullish (pending order setup)
👉 Confirmation: When Simple Moving Average (SMA) is breached by buyers, trend confirmation is valid.
👉 Entry Style: Layered buy-limit entries after breakout confirmation (Thief Strategy 🕵️♂️ = multi-layer entry).
📥 Layered Buy Limit Orders (example setup):
64.00 ✅
64.50 ✅
65.00 ✅
65.50 ✅
(You can increase the number of layered entries based on your own style — flexibility is the thief’s edge!)
⚠️ Important: Buy-limit layers are only valid AFTER breakout confirmation. Do not jump in without confirmation.
🎯 Risk Management (SL & TP):
📌 Stop Loss (Protective Level)
Example stop placement: 63.50
(🔑 Note: This is my style. Manage risk in your own way — never copy-paste without adapting!).
📌 Target Zone
Projected resistance near 68.00, aligned with:
Weighted Moving Average (WMA) resistance
Overbought conditions
Possible “trap” zone ⚠️
💡 Best approach: Secure profits step by step. Escape once the target region is approached.
📢 Note for Traders (Thief OG’s):
I’m not recommending only my SL or my TP. This is just a framework. You’re responsible for your own money management, profits, and exits. Trade at your own risk, and take the bag when you feel it’s right. 💰
🔗 Correlation & Related Pairs to Watch:
Energy markets are heavily correlated across multiple assets:
🛢️ TVC:USOIL / BLACKBULL:WTI – Main setup
🛢️ BLACKBULL:BRENT – Moves in sync with USOIL, watch for confirmation
💵 TVC:DXY – Stronger USD often pressures crude oil prices
💹 AMEX:XLE (Energy Sector ETF) – Tracks US energy stocks, gives indirect flow confirmation
🪙 FX:NGAS – Energy sector cousin, can sometimes give early signals of demand shifts
Keep an eye on these related pairs/assets for flow confirmation and stronger conviction.
🧾 Key Points Recap:
✔️ SMA breach = buyers’ control confirmed
✔️ Layered entries (Thief Strategy 🕵️♂️)
✔️ Stop loss = personal choice (mine @63.50)
✔️ Target = 68.00 escape zone
✔️ Risk & reward = your own responsibility
✔️ Watch related assets for confirmation
✨ “If you find value in my analysis, a 👍 and 🚀 boost is much appreciated — it helps me share more setups with the community!”
#USOIL #WTI #CrudeOil #EnergyMarkets #SwingTrade #DayTrade #TradingStrategy #PriceAction #ThiefStrategy #LayeredEntries #XLE #BRENT #DXY #NGAS
OIL Trade Insights📲 NFX TRADE ALERT
📊 TRADE TYPE: SWING TRADE
♻ PAIR: GBEBROKERS:USOIL
⬇️ SELL AT MARKET
📝 ORDER TYPE: MARKET ORDER
👨🏻💻 ENTRY : $64.45
⭕️ SL: 65.450
✅ TP: $62.00
📝 REASONS FOR TRADE: H1 Confirmation of Price Rejection at Resistance - SR Holds📈
Multiple reversal candles spotted on H4 around supply zone, indicating weakening bullish momentum.
Pay close attention to US Inventory report later the morning.
I expect report to be bearish for oil given the high supply as seen last week.

WTI OIL This is the bigger picture.WTI Oil (USOIL) is currently on the 2nd straight green week ahead of today's Fed Rate Decision. The long-term pattern though is has been a Channel Down since August 2022 and until it gets invalidated, the trend will remain bearish.
In fact, it has made 3 emphatic rejections on the 1W MA200 (orange trend-line) since August 12 2024. The 1W RSI sequence since then, resembles the pattern of 2023, where WTI found a Higher Lows Support on the 1W MA200. The last such contact was on the 0.786 Fibonacci retracement level before a last rebound to the top of the Channel Down.
That is exactly what we are expecting now, with the new 0.786 Fib waiting at $59.50. That is our medium-term Target.
-------------------------------------------------------------------------------
** Please LIKE 👍, FOLLOW ✅, SHARE 🙌 and COMMENT ✍ if you enjoy this idea! Also share your ideas and charts in the comments section below! This is best way to keep it relevant, support us, keep the content here free and allow the idea to reach as many people as possible. **
-------------------------------------------------------------------------------
💸💸💸💸💸💸
👇 👇 👇 👇 👇 👇

WTI Crude upside resistance at 6540The WTI Crude Oil is currently trading with a bearish bias, aligned with the broader downward trend. Recent price action shows a retest of the resistance, suggesting a further selling pressure within the downtrend.
Key resistance is located at 6540, a prior consolidation zone. This level will be critical in determining the next directional move.
A bearish rejection from 6540 could confirm the resumption of the downtrend, targeting the next support levels at 6200, followed by 6070 and 6000 over a longer timeframe.
Conversely, a decisive breakout and daily close above 6540 would invalidate the current bearish setup, shifting sentiment to bullish and potentially triggering a move towards 6650, then 6830.
Conclusion:
The short-term outlook remains bearish unless WTI Crude breaks and holds above 6540. Traders should watch for price action signals around this key level to confirm direction. A rejection favours fresh downside continuation, while a breakout signals a potential trend reversal or deeper correction.
This communication is for informational purposes only and should not be viewed as any form of recommendation as to a particular course of action or as investment advice. It is not intended as an offer or solicitation for the purchase or sale of any financial instrument or as an official confirmation of any transaction. Opinions, estimates and assumptions expressed herein are made as of the date of this communication and are subject to change without notice. This communication has been prepared based upon information, including market prices, data and other information, believed to be reliable; however, Trade Nation does not warrant its completeness or accuracy. All market prices and market data contained in or attached to this communication are indicative and subject to change without notice.

WTI: Oil Markets on Edge Despite Trump Considering Major TariffsOil prices could drop if Trump backs down on tariffs on countries buying Russian oil, but short-term bullish catalysts, like geopolitical tensions and bullish speculative bets, may still push prices up before longer-term headwinds take hold.
----------------------------------------------------------------------------------------------------------------------
Trump’s threats of steep tariffs on countries buying Russian oil have sent oil prices surging, as traders fear a global supply crunch if Russian barrels are cut off.
But here’s the twist: Trump has a history of backing down or delaying tariffs after using them as leverage. When he does, oil prices usually fall, as the immediate risk of supply disruption fades.
If he caves in again by the deadline, which is 10 to 12 days from 4 August, or extends it, oil prices could drop. The bigger picture also appears bearish: OPEC+ is ramping up supply, global demand is slowing and expected to drop in H2, and inventories are rising (first glimpse by EIA, Wed).
But with the deadline falling around 14–16 August, 2025, short-term bullish catalysts could spark a rally up to the 38.2%-61.8 % Fibonacci retracement levels, positioning WTI better for declines (conditional on Trump!).
This content is not directed to residents of the EU or UK. Any opinions, news, research, analyses, prices or other information contained on this website is provided as general market commentary and does not constitute investment advice. ThinkMarkets will not accept liability for any loss or damage including, without limitation, to any loss of profit which may arise directly or indirectly from use of or reliance on such information.

WTI falls after US slaps 50% tariff on India over Russian oilWTI oil prices have dropped from $65 to around $62.80 as markets react to new US tariffs on India, triggered by India’s ongoing oil trade with Russia. These tariffs, along with threats of even higher tariffs on China, are weighing on global demand and pushing oil prices lower. Meanwhile, Iran’s oil production has hit multi-year highs, adding more supply to the market and reinforcing the bearish trend.
Technically, oil has broken below a key Fibonacci support level, signalling a deeper pullback. If prices fall below $62, further downside toward $57 is possible. Upside moves may be short-lived unless there’s a major geopolitical shock, such as an escalation in the Russia-Ukraine conflict. For now, both the macro environment and technical signals indicate continued pressure on oil prices.
This content is not directed to residents of the EU or UK. Any opinions, news, research, analyses, prices or other information contained on this website is provided as general market commentary and does not constitute investment advice. ThinkMarkets will not accept liability for any loss or damage including, without limitation, to any loss of profit which may arise directly or indirectly from use of or reliance on such information.

CRUDE OIL (WTI): Important Breakout
Crude Oil broke and closed above a major daily horizontal resistance.
With a high probability, a broken structure turns into a potentially strong
support now.
I will expect a rise from that and a bullish continuation to 65.56 resistance.
❤️Please, support my work with like, thank you!❤️
I am part of Trade Nation's Influencer program and receive a monthly fee for using their TradingView charts in my analysis.

US CRUDE OIL(WTI): Completed Consolidation📈 USOIL was consolidating within a horizontal range on a 4-hour chart, and has now broken and closed above its resistance level.
I anticipate that the price may continue to rise and approach the next key horizontal resistance at 65.62.

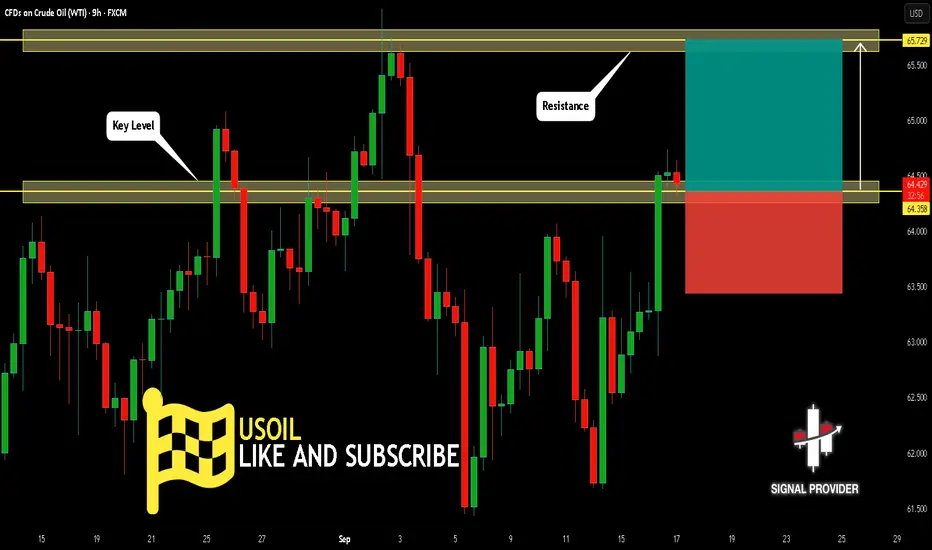
USOIL Will Grow! Long!
Take a look at our analysis for USOIL.
Time Frame: 9h
Current Trend: Bullish
Sentiment: Oversold (based on 7-period RSI)
Forecast: Bullish
The price is testing a key support 64.358.
Current market trend & oversold RSI makes me think that buyers will push the price. I will anticipate a bullish movement at least to 65.729 level.
P.S
We determine oversold/overbought condition with RSI indicator.
When it drops below 30 - the market is considered to be oversold.
When it bounces above 70 - the market is considered to be overbought.
Like and subscribe and comment my ideas if you enjoy them!
Bullish bounce off key support?WTI Oil (XTI/USD) is falling towards the pivot and could bounce to the 1st resistance.
Pivot: 64.17
1st Support: 63.59
1st Resistance: 65.73
Disclaimer:
The above opinions given constitute general market commentary, and do not constitute the opinion or advice of IC Markets or any form of personal or investment advice.
Any opinions, news, research, analyses, prices, other information, or links to third-party sites contained on this website are provided on an "as-is" basis, are intended only to be informative, is not an advice nor a recommendation, nor research, or a record of our trading prices, or an offer of, or solicitation for a transaction in any financial instrument and thus should not be treated as such. The information provided does not involve any specific investment objectives, financial situation and needs of any specific person who may receive it. Please be aware, that past performance is not a reliable indicator of future performance and/or results. Past Performance or Forward-looking scenarios based upon the reasonable beliefs of the third-party provider are not a guarantee of future performance. Actual results may differ materially from those anticipated in forward-looking or past performance statements. IC Markets makes no representation or warranty and assumes no liability as to the accuracy or completeness of the information provided, nor any loss arising from any investment based on a recommendation, forecast or any information supplied by any third-party.

USOIL WTIWest taxes intermediate wti ,oil price will need to deep more for anyone who want to buy ,its in a bad position based on the strategy.
#usoil #wti


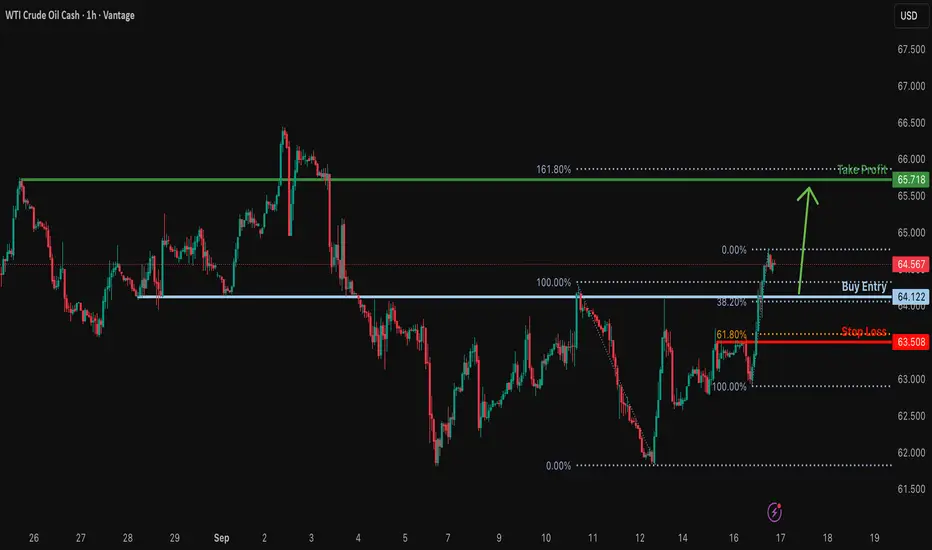
Potential bullish bounce?USO/USD is falling towards the support level, which is an overlap support that lines up with the 38.2% Fibonacci retracement and could bounce from this level to our take profit.
Entry: 64.12
Why we like it:
There is an overlap support that aligns with the 38.2% Fibonacci retracement.
Stop loss: 63.50
Why we like it:
There is a pullback support that is slightly below the 61.8% Fibonacci retracement.
Take profit: 65.71
Why we like it:
There is a pullback resistance level that is slightly below the 161.8% Fibonacci extension.
Enjoying your TradingView experience? Review us!
Please be advised that the information presented on TradingView is provided to Vantage (‘Vantage Global Limited’, ‘we’) by a third-party provider (‘Everest Fortune Group’). Please be reminded that you are solely responsible for the trading decisions on your account. There is a very high degree of risk involved in trading. Any information and/or content is intended entirely for research, educational and informational purposes only and does not constitute investment or consultation advice or investment strategy. The information is not tailored to the investment needs of any specific person and therefore does not involve a consideration of any of the investment objectives, financial situation or needs of any viewer that may receive it. Kindly also note that past performance is not a reliable indicator of future results. Actual results may differ materially from those anticipated in forward-looking or past performance statements. We assume no liability as to the accuracy or completeness of any of the information and/or content provided herein and the Company cannot be held responsible for any omission, mistake nor for any loss or damage including without limitation to any loss of profit which may arise from reliance on any information supplied by Everest Fortune Group.
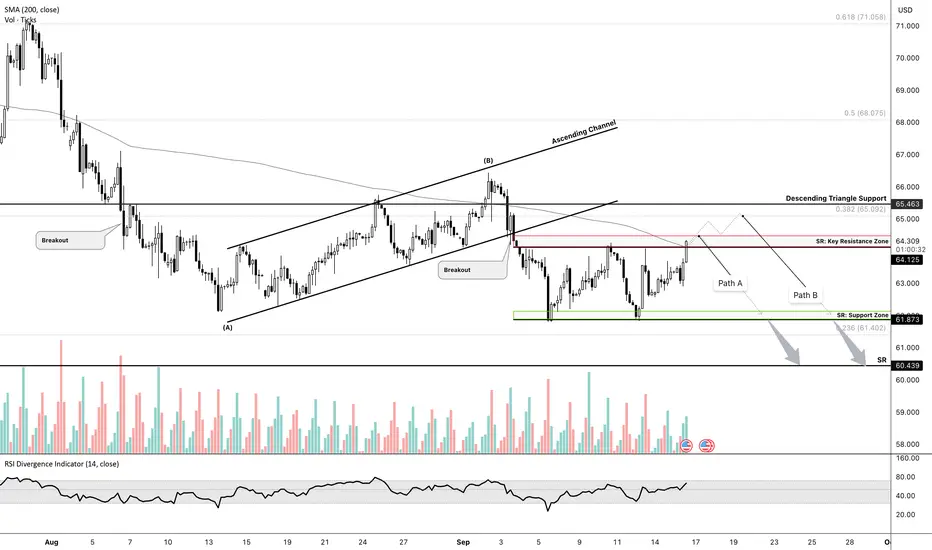
Oil Trade Analysis📊 NFX GBEBROKERS:USOIL Oil Trade Analysis
FX:USOIL is currently trading at a critical resistance zone around $64.200. With no strong fundamentals to back the current bullish momentum, this move looks short-lived given the broader macroeconomic outlook (as discussed in our last WMA session).
🔀 Two key paths ahead:
Path A – Bearish Rejection🔻(Most Probable)
Price faces rejection at current SR zone.
Confluence with the 200-day SMA, which has acted as strong resistance for some time.
Likely scenario: sharp retracement downwards.
Path B – Liquidity Grab 🔸
Price breaks above the 200-day SMA and SR zone.
Pushes higher towards the next resistance at 65 (38.2% Fib level).
Expected to be a fakeout/liquidity grab before a heavy bearish drop.
📅 Market Movers to Watch Tomorrow:
FOMC Statement
USOil Inventory Report
Fed Rate Cut Decision
⚖️ Personally, I lean strongly towards Path A (bearish rejection🔻), but I’ll be waiting for confirmation before entering. News tomorrow will be the key catalyst.
💬 What’s your outlook? Share your thoughts in the comments.
CRUDE OIL (WTI): Complete Support & Resistance Analysis Today
Here is my latest structure analysis for WTI Oil.
Resistance 1: 63.7 - 64.1 area
Resistance 2: 65.6 - 66.8 area
Resistance 3: 70.2 - 70.5 area
Support 1: 61.4 - 62.0 area
Support 2: 59.0 - 60.8 area
Support 3: 55.3 - 57.3 area
The price is currently breaking Resistance 1.
A daily candle close above that may push the prices to Resistance 2.
❤️Please, support my work with like, thank you!❤️
I am part of Trade Nation's Influencer program and receive a monthly fee for using their TradingView charts in my analysis.

Crude Oil Eyes 4-Month Consolidation BreakoutOil prices have been consolidating within a triangle formation since the June 2025 high, which was triggered by the Israel–Iran escalation. Price action has traced a sequence of lower highs and higher lows, holding above the critical $61 support.
With five legs unfolding inside the triangle, a potential bullish breakout could take shape if the price holds above $64, opening the door toward: $66.80, $67.70, and $70.20, which aligns with the upper boundary of a long-term descending channel from 2022
A confirmed break above $70.20 could shift the long-term trend, transitioning from consolidation to a potential bullish reversal.
From the downside:
Failure to hold above $61 could see a retest of the 2025 lows, with key support levels at: $60.20, $59.20, $58.00.
Key events:
• FOMC meeting – Wednesday
• Ukraine-Russia refinery attacks
• Demand vs OPEC unwinds
Written by Razan Hilal, CMT

Crude Oil Monthly Forecast: September 2025
The West Texas Intermediate Crude Oil market has been rather negative during the month of August, but at the end of the month we saw the market bounce roughly 50% of the move, and as I do this analysis at the end of the month, we are sitting at a crucial level.
This does make a certain amount of sense, because there are a lot of questions right now about where the global economy is going.
Crude Oil and the Economy
Keep in mind that crude oil is extraordinarily important for most economies, and of course the transportation of goods and services. In other words, crude oil will rally in times of economic growth but also will struggle in times where growth is extraordinarily limited. That’s the question we find ourselves trying to answer at the moment, and this may be part of the reason why we are hanging around and trying to sort out where we are going next.
Another major problem at the moment is the fact that Russia, OPEC, in the United States are all ramping up production, which of course will drive down price as supply is getting to be too much. Between that and the possibility of the global economy slowing down, this could be a very bad sign for crude oil. This isn’t to say that we need to fall apart, just that it might be extraordinarily difficult for oil to get a bit of a bid at the moment.
Ultimately, I think the $65 level continues to be an area of interest, as the price has acted like a magnet more than once. If we can rally from here, somewhere around the $60 level I would expect to see a lot of resistance. On the other hand, if we drop from here, I think somewhere around the $60 level there should be significant support. Anything below would be an extraordinarily negative sign. I believe we are trying to find some type of range, perhaps between the $62 level and the $67 level, but we will have to wait and see how that plays out. Either way, I would anticipate choppy and basically sideways action for the month.
