Oil (WTI) – Downside Pressure Appears to Be BuildingLast week, Oil (WTI) experienced one of its biggest declines of the year as traders shifted their focus from the potential short term supply constraints that could be caused by further sanctions on Russia and buyers of Russian energy, to concerns of over supply as the International Energy Agency (IEA) warned of a record Oil surplus in 2026, US crude inventories rose and traders headed into a crucial OPEC+ decision on Sunday surrounding the size of their November production increases. This saw Oil drop from its Monday (Sept 29th) open at 65.27 to a Friday (Oct 3rd) close of 60.92, a fall of 6.7% and its lowest weekly close since late May.
Moving forward to the start of this week, Oil (WTI) prices have jumped around 2% from opening levels back to 62.00 (0800 BST) as traders breathe a small sigh of relief on news that the agreed OPEC+ production increase scheduled for November is only going to be 137k barrels per day and not a much bigger number.
However, while the OPEC+ decision does bring some very short term clarity and has led to some early repositioning from Oil traders, the issues regarding over supply could still remain and may possibly dictate the size of any further rally. This could impact trader decision making as they assess the next series of weekly updates on US inventories and try and work out if a deeper squeeze to the topside is possible or whether this latest rally could run out of steam.
Assessing the technical update could be helpful in this situation.
Technical Update: Downside Pressure Appears to Be Building
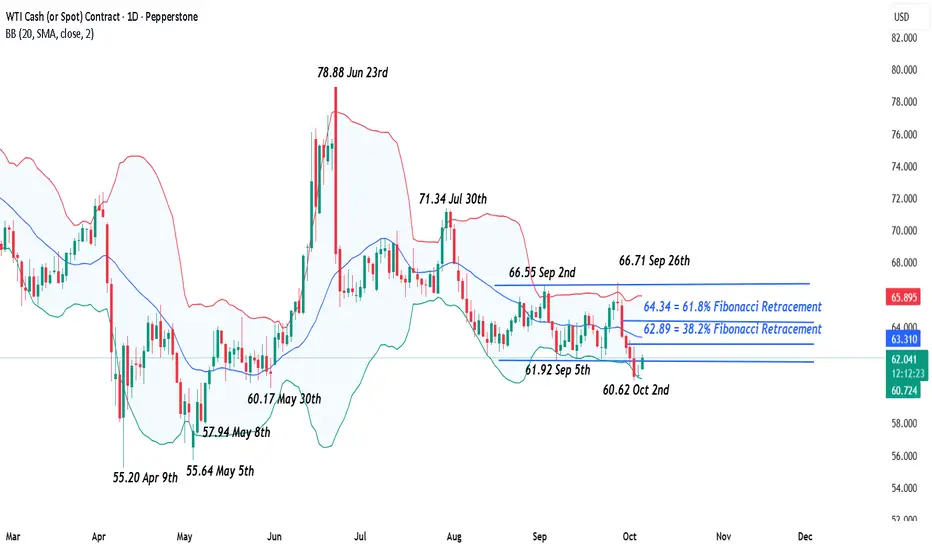
Throughout August and September, Oil (WTI) traded in a broadly sideways range, reflecting a tug-of-war between buyers and sellers with no clear directional bias. As the chart below shows, this consolidation unfolded between support at 61.92 (September 5th low) and resistance at 66.55/66.71 (September 2nd and 26th highs). This balanced structure underscored recent trader indecision, with a breakout of either side needed to suggest the possibility for an increase in volatility.
Interestingly, last Thursday’s extension of recent price declines saw closes below the support at 61.92 and traders may well be asking whether this might lead to a further phase of price declines.
While closing breaks from a rectangular range doesn’t guarantee further price weakness, risks do appear to be developing for continued downside pressure this week. With this in mind, it may prove useful to establish some potential support and resistance levels to gauge where the directional risks might now be materialising.
Potential Resistance Levels:
Since posting last week’s low at 60.62, Oil (WTI) has seen a modest price recovery. However, given the recent closing break below support at 61.92, traders may view this rebound as a limited reactive move.
Although further attempts to push to higher price levels are still possible, 62.89. which is the 38.2% retracement of the September 26th to October 2nd decline, may now be seen as the first resistance. While a break above 62.89 wouldn’t necessarily suggest an extended phase of price strength, it could open the way for tests of 64.34, the higher 61.8% retracement.
Potential Support Levels:
Having now seen the latest closing breaks below the lower extremes of the sideways range at 61.92, the risks could be for limited price recoveries and a possible extension of price weakness. As the chart below shows, this could lead to tests of lower support levels.
If this is to be the case, the 60.17 May 30th session low might prove to be the next support level, although if this does give way, the focus could then shift to the May 8th session low at 57.94.
The material provided here has not been prepared accordance with legal requirements designed to promote the independence of investment research and as such is considered to be a marketing communication. Whilst it is not subject to any prohibition on dealing ahead of the dissemination of investment research, we will not seek to take any advantage before providing it to our clients.
Pepperstone doesn’t represent that the material provided here is accurate, current or complete, and therefore shouldn’t be relied upon as such. The information, whether from a third party or not, isn’t to be considered as a recommendation; or an offer to buy or sell; or the solicitation of an offer to buy or sell any security, financial product or instrument; or to participate in any particular trading strategy. It does not take into account readers’ financial situation or investment objectives. We advise any readers of this content to seek their own advice. Without the approval of Pepperstone, reproduction or redistribution of this information isn’t permitted.
WTI trade ideas
us oilHI GUYS,
correction on us oil price action patterns as we move to RT DAILY STRUCTURE.
previously i posted double top(DT) as entries on RT WEEKLY AND DAILY. however us-oil sells on head and shoulder pattern indicated as light blue and buys on DB indicated as orange .
Rsi or macd or any other oscillators will always show a divergence as second confirmation on entries.
NOTE . WITH PATTERN PRICE . We always have 5 confirmations on entries.
*script direction of any trend on monthly and 12month.
*script direction on weekly, daily to h4 RT.
* price patterns ,
* candle close
* and divergence on any oscillator indicators as shown in all the idea charts i post.
We also look at ranging markets and also identify market manipulation on certain levels of interest. NEWS as the BIG MANIPULATION which speeds up the market in any direction of interest and at times makes false breaks on certain levels of interest this leads to a confusion of most traders as they tend to think that market has changed direction.
News can also manipulate both script direction of weekly and daily , h4 RT . forming higher highs and lower highs as a supper uptrend Be it bearish trend or bullish trend. but if u can track down the price patterns u will always get a clean move.

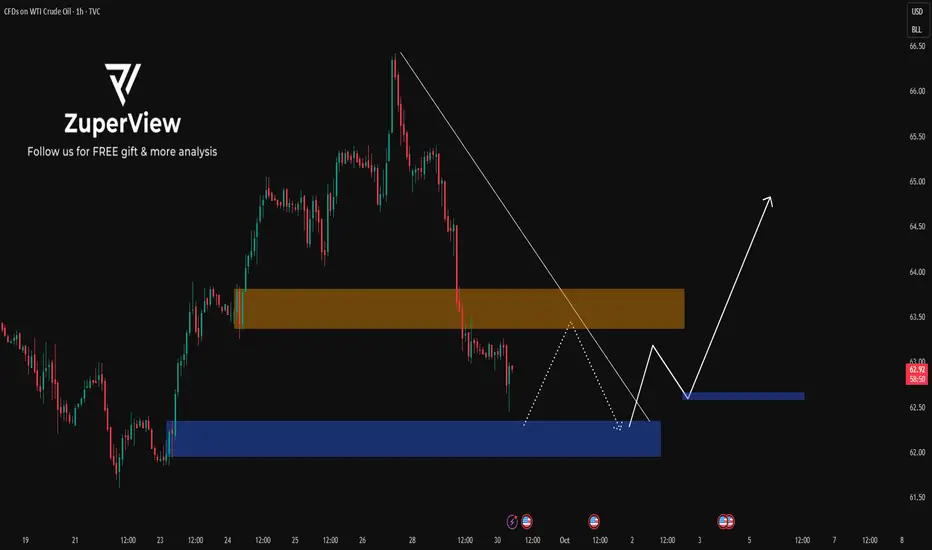
Bullish bounce off major support?USO/USD has bounced off the support level, which is an overlap support that aligns with the 38.2% Fibonacci retracement and could bounce from this level to our take profit.
Entry: 61.99
Why we like it:
There is an overlap support level that aligns with the 38.2% Fibonacci retracement.
Stop loss: 60.58
Why we like it:
There is a swing low support level.
Take profit: 64.07
Why we like it:
There is a pullback resistance level that is slightly below the 61.8% Fibonacci retracement.
Enjoying your TradingView experience? Review us!
Please be advised that the information presented on TradingView is provided to Vantage (‘Vantage Global Limited’, ‘we’) by a third-party provider (‘Everest Fortune Group’). Please be reminded that you are solely responsible for the trading decisions on your account. There is a very high degree of risk involved in trading. Any information and/or content is intended entirely for research, educational and informational purposes only and does not constitute investment or consultation advice or investment strategy. The information is not tailored to the investment needs of any specific person and therefore does not involve a consideration of any of the investment objectives, financial situation or needs of any viewer that may receive it. Kindly also note that past performance is not a reliable indicator of future results. Actual results may differ materially from those anticipated in forward-looking or past performance statements. We assume no liability as to the accuracy or completeness of any of the information and/or content provided herein and the Company cannot be held responsible for any omission, mistake nor for any loss or damage including without limitation to any loss of profit which may arise from reliance on any information supplied by Everest Fortune Group.

WTI Crude oversold bounce back capped at 6430 The WTI Crude Oil is currently trading with a bearish bias, aligned with the broader downward trend. Recent price action shows a retest of the resistance, suggesting a further selling pressure within the downtrend.
Key resistance is located at 6430, a prior consolidation zone. This level will be critical in determining the next directional move.
A bearish rejection from 6430 could confirm the resumption of the downtrend, targeting the next support levels at 6200, followed by 6070 and 6000 over a longer timeframe.
Conversely, a decisive breakout and daily close above 6540 would invalidate the current bearish setup, shifting sentiment to bullish and potentially triggering a move towards 6650, then 6830.
Conclusion:
The short-term outlook remains bearish unless WTI Crude breaks and holds above 6430. Traders should watch for price action signals around this key level to confirm direction. A rejection favours fresh downside continuation, while a breakout signals a potential trend reversal or deeper correction.
This communication is for informational purposes only and should not be viewed as any form of recommendation as to a particular course of action or as investment advice. It is not intended as an offer or solicitation for the purchase or sale of any financial instrument or as an official confirmation of any transaction. Opinions, estimates and assumptions expressed herein are made as of the date of this communication and are subject to change without notice. This communication has been prepared based upon information, including market prices, data and other information, believed to be reliable; however, Trade Nation does not warrant its completeness or accuracy. All market prices and market data contained in or attached to this communication are indicative and subject to change without notice.

WTI with bearish momentum dominatingDue to a larger-than-expected increase in crude oil inventories, WTI prices fell. From the daily chart perspective, oil prices have broken below the lower edge of the trading range, and the medium-term objective trend is downward. Currently, oil prices are fluctuating near the lower edge of this range. The fast and slow lines of the MACD indicator are below the zero line, with bearish momentum dominating. It is expected that the probability of oil prices moving in an oscillating downward pattern in the medium term is relatively high.
Sell 60 - 60.2 TP 59 - 59.5 SL 60.5
Daily-updated accurate signals are at your disposal. If you run into any problems while trading, these signals serve as a reliable reference—don’t hesitate to use them! I truly hope they bring you significant assistance

WTI Crude Oil (USOIL) Technical analysisWTI Crude Oil has now broken below the 59.869 support zone, extending the bearish trend that started after the rejection from the 64.576 area. The breakdown signals strong selling momentum, with the next major support zone now seen around 58.000, followed by 55.451 if weakness persists.
Support at: 58.000 / 55.451 🔽
Resistance at: 59.869 / 61.717 / 63.090 🔼
🔎 Bias:
🔼 Bullish: A strong daily close back above 59.869 could indicate a false breakdown and open a retracement toward 61.717.
🔽 Bearish: Sustained trading below 59.869 keeps downside pressure intact toward 58.000 and possibly 55.451.
📛 Disclaimer: This is not financial advice. Trade at your own risk.

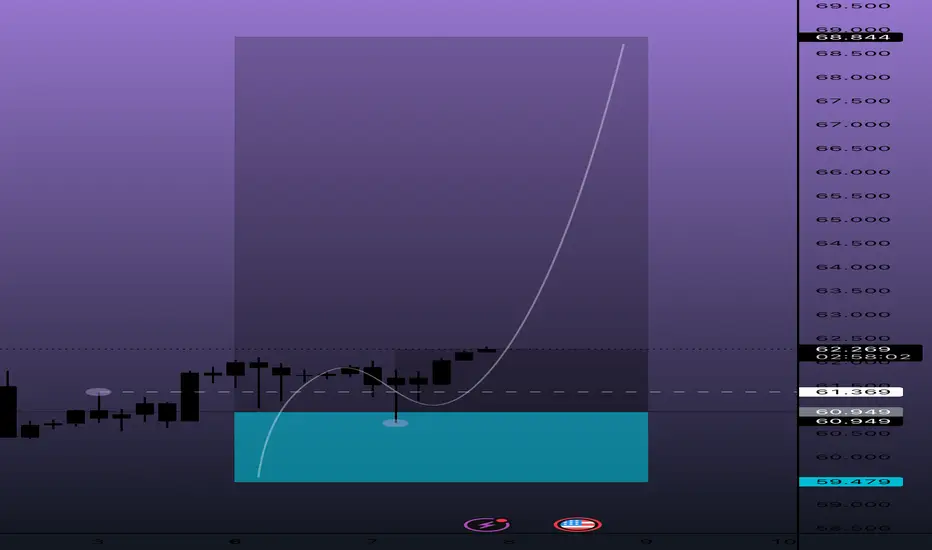
Wti updated $60.949 tapped me in.
Had a few more orders below, see how this day go but she looks somewhat ready!!!!
$64 first up blah blah blah.😑
$68.844
WTI Crude (XTIUSD) 4H: Battle at Support - Bounce or Breakdown?WTI Crude (XTIUSD) 4H: Battle at Support - Bounce or Breakdown?
Bearish Correction & Current Stance: WTI Crude (XTIUSD) has experienced a significant bearish correction since late September, breaking key support levels and establishing a clear downtrend on the 4-hour chart. The price is currently attempting to stabilize and consolidate within a tight range after reaching recent lows.
Crucial Support Zone: The immediate and critical support for XTIUSD lies within the $60.3 to $60.6 zone. A sustained hold above this area could signal short-term buyer interest and potentially pave the way for a relief bounce.
Resistance Levels to Watch: Upside momentum will face its first significant hurdle at 61.58, which represents swing high. A more substantial challenge, and flip zone between between 64.5 and $65.2, acting as a strong overhead supply zone.
Breakdown Implies Further Weakness: Should the current support at $60.3 - $60.6 fail to hold with a decisive 4-hour close below it, it would validate continued bearish momentum, likely leading to further price depreciation and a test of lower price targets.
Disclaimer:
The information provided in this chart is for educational and informational purposes only and should not be considered as investment advice. Trading and investing involve substantial risk and are not suitable for every investor. You should carefully consider your financial situation and consult with a financial advisor before making any investment decisions. The creator of this chart does not guarantee any specific outcome or profit and is not responsible for any losses incurred as a result of using this information. Past performance is not indicative of future results. Use this information at your own risk. This chart has been created for my own improvement in Trading and Investment Analysis. Please do your own analysis before any investments.

Downtrend in oilExactly the same as the previous analysis, the oil trend is completely bearish and we can expect a target of $50 for this commodity.

USOIL: Waiting for breakout after sidewaysTo better understand my current outlook on USOIL, please refer to my previous higher-timeframe and fundamental analyses.
* Trend: assessed using at least three trend indicators, with market structure as the primary guide.
** Weak or Reversal Signals: Assessed based on one of our criteria for trend reversal signals.
*** Support/Resistance: Selected from multiple factors – static (Swing High, Swing Low, etc.), dynamic (EMA, MA, etc.), psychological (Fibonacci, RSI, etc.) – and determined based on the trader’s discretion.
**** Our advice takes into account all factors, including both fundamental and technical analysis. It is not intended as a profit target. We hope it can serve as a reference to help you trade more effectively. This advice is for informational purposes only and we assume no responsibility for any trading results based on it.
Please like and comment below to support our traders. Your reactions will motivate us to do more analysis in the future 🙏✨
Potential bearish drop?WTI Oil (XTI/USD) is rising towards the pivot and could reverse to the 1st support.
Pivot: 64.72
1st Support: 62.67
1st Resistance: 66.82
Disclaimer:
The above opinions given constitute general market commentary, and do not constitute the opinion or advice of IC Markets or any form of personal or investment advice.
Any opinions, news, research, analyses, prices, other information, or links to third-party sites contained on this website are provided on an "as-is" basis, are intended only to be informative, is not an advice nor a recommendation, nor research, or a record of our trading prices, or an offer of, or solicitation for a transaction in any financial instrument and thus should not be treated as such. The information provided does not involve any specific investment objectives, financial situation and needs of any specific person who may receive it. Please be aware, that past performance is not a reliable indicator of future performance and/or results. Past Performance or Forward-looking scenarios based upon the reasonable beliefs of the third-party provider are not a guarantee of future performance. Actual results may differ materially from those anticipated in forward-looking or past performance statements. IC Markets makes no representation or warranty and assumes no liability as to the accuracy or completeness of the information provided, nor any loss arising from any investment based on a recommendation, forecast or any information supplied by any third-party.

WTI Crude Oil Short Setup: Retest of Flipped ResistanceHello TradingView Community,
This post outlines a potential short trade setup for WTI Light Crude Oil (XTIUSD) on the 15-minute timeframe.
Technical Analysis:
The chart highlights a key horizontal price level at approximately $63.50. This level previously acted as a solid support base, holding the price up on multiple occasions.
We have recently witnessed a clear breakdown below this support, indicating a shift in momentum to the bearish side. The price is now consolidating just below this broken structure, potentially setting up for a retest. This is a classic "support-turned-resistance" scenario. The expectation is that this level will now act as a ceiling, rejecting the price and leading to a continuation of the downtrend.
Trade Setup:
The short position tool on the chart visualizes a potential trade plan based on this bearish outlook:
Entry: Approximately $63.50 (at the retest of the new resistance).
Stop Loss: $64.82 (placed above the resistance zone to invalidate the idea if the price reclaims the level).
Take Profit: $58.36 (targeting a new potential swing low).
This setup provides a structured plan with a clear risk-to-reward ratio for a potential move lower.
Disclaimer: This analysis is for educational and discussion purposes only and should not be considered financial advice. Trading commodities involves significant risk. Please conduct your own research and manage your risk appropriately before making any trading decisions.

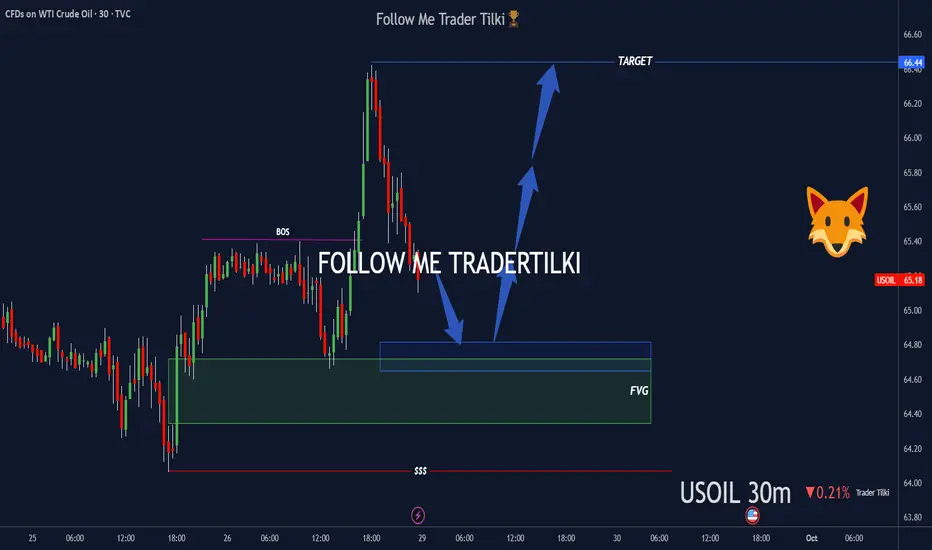
30-minute USOIL Key Buy Zones AnalysisHello Guys,
I’ve prepared a USOIL analysis for you.
I’m watching two buy zones on USOIL:
🔹 First buy zone: 64.70
🔹 Second buy zone: 64.35 or 64,00
From these levels, I’ll definitely open buy positions and take my shot.
🎯 Target level: 66.40
Every like is my biggest motivation to keep sharing these analyses.
Thanks to everyone supporting me!
US CRUDE OIL (WTI): Strong Bearish Signal?!The price of 📉USOIL appears to be showing bearish tendencies following a consolidation period of two months.
A bearish breakout below the support level of a sideways range often serves as a dependable confirmation signal.
Consequently, a downward movement towards the support level of 59.00 is anticipated.

USOIL Will Go Down! Sell!
Here is our detailed technical review for USOIL.
Time Frame: 9h
Current Trend: Bearish
Sentiment: Overbought (based on 7-period RSI)
Forecast: Bearish
The market is testing a major horizontal structure 60.770.
Taking into consideration the structure & trend analysis, I believe that the market will reach 57.241 level soon.
P.S
Please, note that an oversold/overbought condition can last for a long time, and therefore being oversold/overbought doesn't mean a price rally will come soon, or at all.
Like and subscribe and comment my ideas if you enjoy them!

WTI OIL Channel Up bottom buy signalWTI Crude Oil (USOIL) has almost touched the bottom (Higher Lows trend-line) of its September Channel Up, following a strong rejection (Bearish Led) just below the 1D MA200 (orange trend-line).
With the 4H RSI entering its medium-term Buy Zone, we have a strong short-term buy signal at our hands. Our Target is $66.50, expecting a 1D MA200 test, below the 1.1 Fibonacci extension, below which the previous Higher High was priced.
-------------------------------------------------------------------------------
** Please LIKE 👍, FOLLOW ✅, SHARE 🙌 and COMMENT ✍ if you enjoy this idea! Also share your ideas and charts in the comments section below! This is best way to keep it relevant, support us, keep the content here free and allow the idea to reach as many people as possible. **
-------------------------------------------------------------------------------
💸💸💸💸💸💸
👇 👇 👇 👇 👇 👇

XTIUSD Weekly CLS range Manipulation - ShortXTIUSD shows clear manipulation candle on daily time frame closing within a CLS candle. Can short on pullback . Price likely will go down .

USOIL: Sideways-to-lower in a tight bandThis is my previous analysis — feel free to take a look for reference.
1. Institutional Forecast Updates
IEA (Sep 15, 2025):
WTI targets $64.2/bbl for 2025 and $47.8/bb l for 2026
Brent targets $68/bbl for 2025 and $51/bb l for 2026
Goldman Sach (Jul 14, 2025):
WTI targets $63/bbl for H2 2025 and $52/bbl for 2026
Brent targets $64/bbl for H2 2025 and $56/bbl for 2026
J.P. Morgan (May 16, 2025):
Brent targets $64/bbl for H2 2025 and $56/bbl for 2026
www.rigzone.com
www.reuters.com www.jpmorgan.com
2. Key Drivers & Risks
📉 Supply
OPEC+ unwinding cuts of 2.2 mb/d (2024–2025), plus +137 kb/d starting October 2025.
Global supply reached 106.9 mb/d in Aug 2025; projected to rise by +2.7 mb/d to 105.8 mb/d in 2025.
U.S. output hit a record 13.2–13.4 mb/d (2024–2025)
Brazil, Guyana, and Canada are key contributors to non-OPEC+ growth.
U.S. shale breakeven costs: ~$62–68/bbl.
New offshore projects breakeven at ~$47/bbl.
OECD inventories in July 2025: 2,848 million barrels; 58.1 days of forward cover.
✳️ Demand
Global oil demand in 2024: ~103 mb/d (~193 EJ)
2025 demand growth of only +0.7 mb/d (weakest since 2009, excluding 2020).
OPEC projects demand growth of +1.3 mb/d in 2025 and +1.4 mb/d in 2026.
Consumption structure: transport accounts for ~two-thirds of oil demand; >90% of transport energy comes from oil.
Petrochemicals (naphtha, LPG) remain a key driver of incremental demand.
🛑 Politics & Geopolitics
Escalating Middle East tensions: growing risks in the Strait of Hormuz and Red Sea.
Kurdistan–Turkey pipeline (~0.23 mb/d) subject to recurring disruptions.
Venezuela: Chevron faces restrictions on U.S. exports.
OPEC+ often produces ~0.5 mb/d below quota due to capacity limits.
Long-term trend: EV adoption and emission policies structurally weaken demand growth.
✅ Overall View:
Overall, governments both want to bring oil prices down to support their economies and also tend to protect oil companies, since prices are currently low relative to many firms’ breakeven levels.
Prices are likely to edge gradually lower within a narrow range of $70–$50, and it is important to closely monitor factors that could trigger supply–demand shocks.
3. Technical Analysis
* Trend: assessed using at least three trend indicators, with market structure as the primary guide.
** Weak or Reversal Signals: Assessed based on one of our criteria for trend reversal signals.
*** Support/Resistance: Selected from multiple factors – static (Swing High, Swing Low, etc.), dynamic (EMA, MA, etc.), psychological (Fibonacci, RSI, etc.) – and determined based on the trader’s discretion.
**** Our advice takes into account all factors, including both fundamental and technical analysis. It is not intended as a profit target. We hope it can serve as a reference to help you trade more effectively. This advice is for informational purposes only and we assume no responsibility for any trading results based on it.
Please like and comment below to support our traders. Your reactions will motivate us to do more analysis in the future 🙏✨

XTIUSD Pull back trade LONGRecently XTIUSD has fallen heavily and now price is consoldiating and pullback is possible to 63.5 before furhter decline, let us see how it plays out. Use strict SL as recnt swing Low.

Fuel recovery after free fallFor my opinion basis on FA and TA i think now time to go up again,target 65


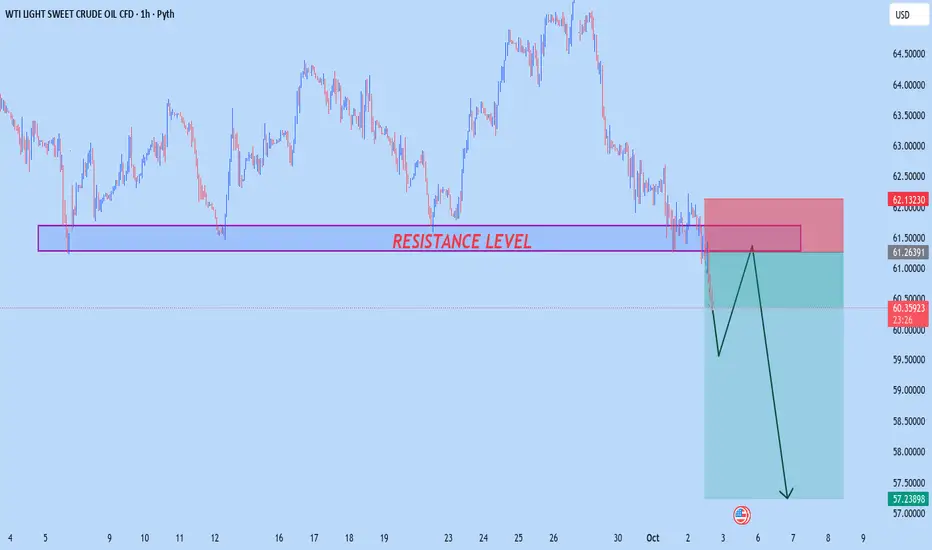
USOIL NEW OUTLOOK According to H1 analysis USOIL market break the support level and make it RESISTANCE LEVEL now market Running in selling pressure so it will be go more in sell so wait for opportunity we have chance to go sell from RESISTANCE
TRADE AT YOUR OWN RISK
REGARD ALBERT