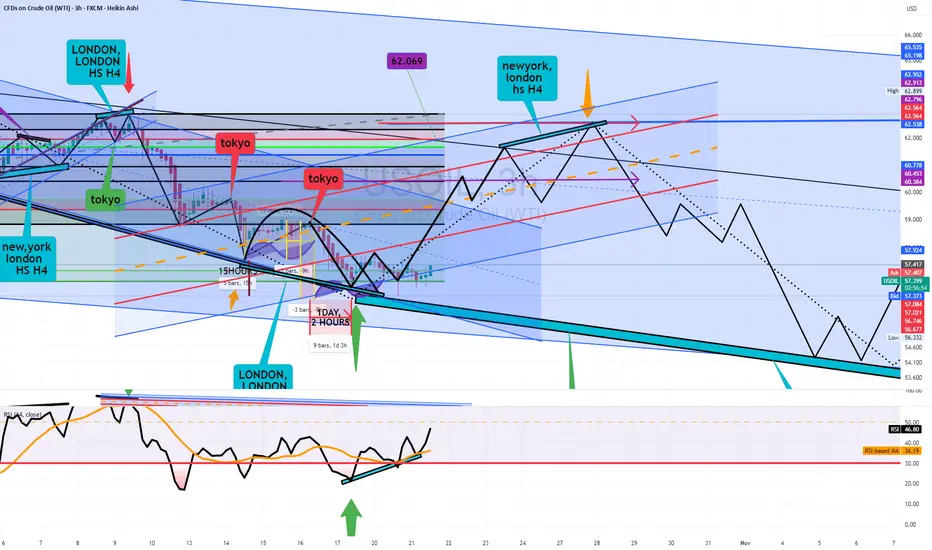
US OIL HI GUYS,
US OIL has finally made it to reaction zone. continuation buys on the pull back as illustrated months ago.
THE BUYS are almost exhausted. so i expect the Hs pattern some time next week for the long position sells.
Trade ideas

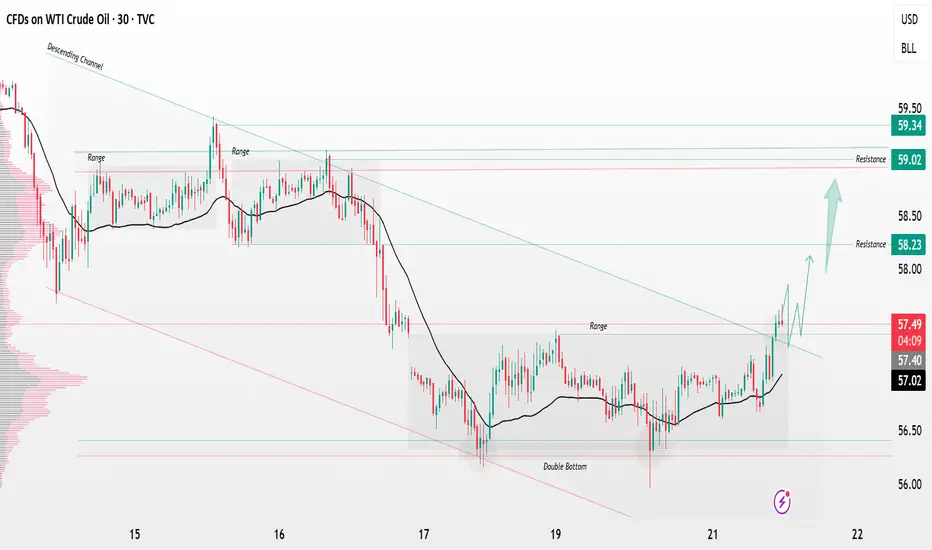
USOIL breakout from consolidation zone big breaking📊 USOIL (WTI Crude Oil) Technical Update 🛢️
USOIL has confirmed a descending channel breakout followed by a range consolidation breakout — showing strong bullish momentum on the 30-minute timeframe. 🔥
📈 Breakout Level: 57.60
🎯 Technical Targets:
1️⃣ First Target – 58.20
2️⃣ Second Target – 59.00
As long as price holds above 57.60, the bullish bias remains intact. ⚡
#USOIL #WTI #CrudeOil #PriceAction #TechnicalAnalysis #BreakoutTrading
USOIL's upside target is 64.6On the daily chart, USOIL stabilized and rose after retracing to the previous demand zone, forming a bullish bat pattern. The first upside target is currently 61.3, and the second target is 64.6.

US OIL SUPPORT, RESISTANCE & TRENDLINE ANALYSISMY all targets hit for "LONG" in previous post.
Go "LONG" if it breaks 60.67 with 60.78 as the target. If it breaks that then move up-till 61.04 and breaking that might lead till 61.14.
Go "SHORT" if it breaks 60.32 and target till 60.09 and if it breaks that then 59.97 might be the next target and breaking that might lead to 59.61.

Crude oil trading strategy for today. Hope it is helpful to youWhy Is the $60.13 Level Suitable for a Long Position in Crude Oil?
Currently, crude oil prices have stabilized above the $60 mark. Although there are still concerns about "excess supply" in the market, from the perspective of short-term opportunities, two key signals support our attempt to take a long position—we should not be constrained by the previous "weak market" mindset:
1. Escalating Risks of Geopolitical Conflicts
Ukraine has stepped up attacks on Russia's oil facilities. Recently, it has knocked out two large Russian oil refineries, pushing Russia's oil refining volume to a two-year low. If key oil pipelines are affected in the future, or if the conflict between Israel and Lebanon in the Middle East expands to disrupt transportation in the Persian Gulf, the market will immediately worry about "insufficient oil supply," and oil prices are likely to surge rapidly. For reference, after Israel's air strike on Iranian facilities in June, oil prices soared by 6.9% in a single day—such sudden opportunities are worth seizing.
2. OPEC+ Lacks Momentum for Further Production Increases
Although OPEC+ plans to increase production by 137,000 barrels per month from October to November, most oil-producing countries have no spare production capacity left. Back in May, the actual production increase only reached 45% of the planned amount. Recently, there have been reports that OPEC+ is discussing "suspending subsequent production increases" internally. If it clearly announces the suspension of production increases (or even resumes production cuts) at its meeting, the pressure from excess supply will be significantly relieved, and oil prices will gain stronger momentum to rise.
Crude Oil Trading Strategy for Today
usoil @ buy60.00-60.50
pt:61-61.50
sl:59

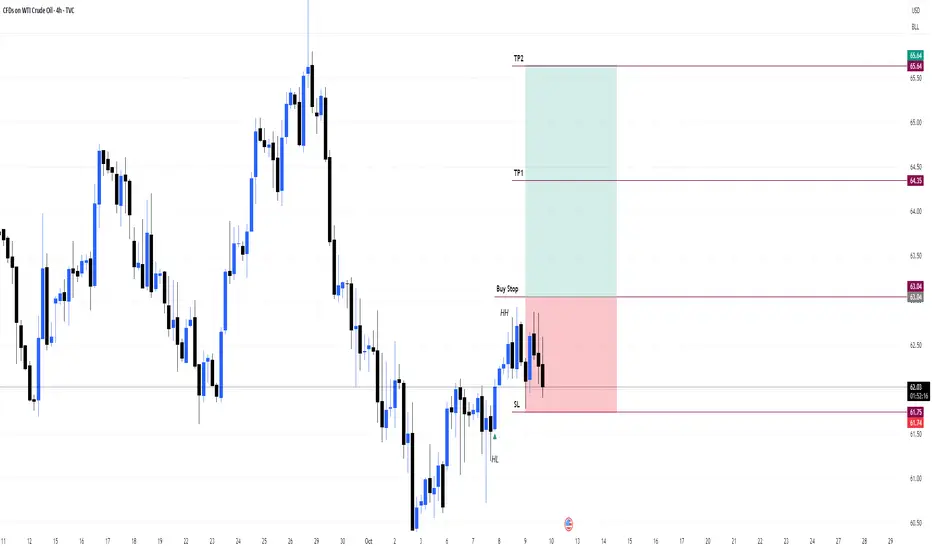
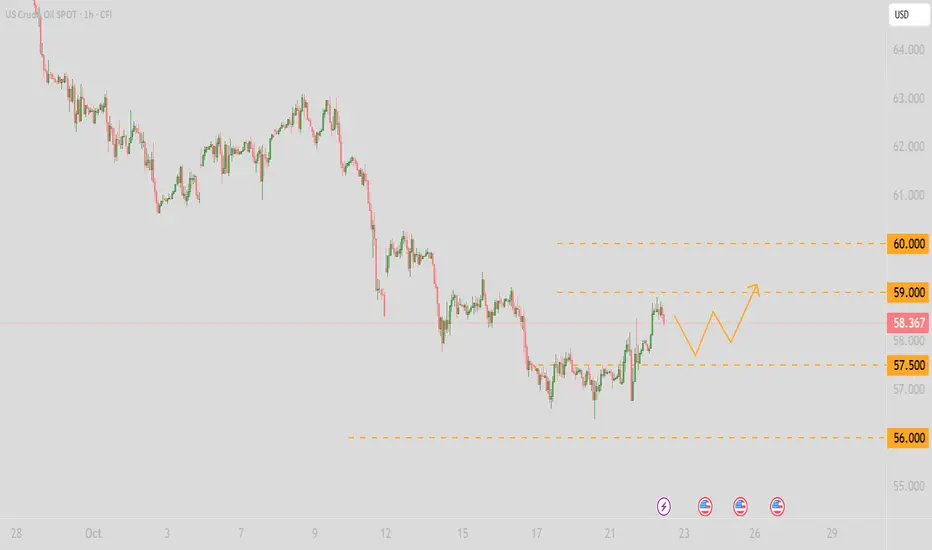
USOILPrice recently formed a Higher High, confirming bullish momentum.
Currently, price is pulling back and forming a Higher Low, maintaining the uptrend structure.
📈 Buy Stop placed above the previous Higher High, anticipating a breakout continuation.
🛑 Stop Loss set just below the Higher Low, where price previously reversed.
🎯 Risk to Reward: 1:2, aiming for a favorable reward relative to the risk.
Structure: Bullish (HH + HL)
Entry Type: Breakout Entry
Confirmation: Structure + Buy Stop Strategy
SL: Below HL | TP: 2x Risk
Today's crude oil strategy, hoping to be helpful to you.Although the current broader context of the international crude oil market is "excess supply and weak demand", from the perspective of short-term and potential opportunities, there are three key points that support us to attempt a long position. We should not be deterred by the broader "weak market" trend:
Potential "Flashpoints" in Geopolitical Conflicts
Ukraine has not stopped using drones to attack Russia's oil facilities, and Russia's oil refining volume has now hit its lowest level in over two years. If key pipelines are attacked next, or if conflicts between Israel and Qatar in the Middle East escalate further, affecting crude oil transportation, the market will definitely rush to buy oil out of panic. In this case, oil prices will most likely surge suddenly. For example, back in June, when Israel launched an air strike on Iran's nuclear facilities, oil prices rose by 6.9% in a single day. We must seize such opportunities.
Possible "Hitches" in OPEC+ Production Increase
Although OPEC+ plans to increase supply by an additional 137,000 barrels per month in October and November, many oil-producing countries actually have little extra oil to produce. As early as May, the actual production increase was more than half lower than the planned amount. If OPEC+ announces "no more production increases" in subsequent meetings, or even resumes production cuts, the pressure from excess supply will be reduced significantly, and oil prices will naturally be able to hold steady or even rise.
Crude Oil Trading Strategy for Today
usoil @buy 57.50-58.00
pt:58.50-59
sl:57

WTI OIL Strong long-term rebound incoming.Over a month ago (September 17, see chart below), we gave a strong Sell Signal on WTI Oil (USOIL) as the price was again rejected on its 1W MA50 (blue trend-line) and was headed towards the inner Higher Lows trend-line, easily hitting our $59.50 Target in the process:
Yet again we consult the more reliable long-term time-frames, now making a bullish call as the price is already rebounding this week on the Higher Lows. Given also the identical 1W RSI pattern with 2023, we expect a bounce towards at least the 0.618 Fibonacci retracement level at $69.50, same as the December 2023 - March 2024 rally.
-------------------------------------------------------------------------------
** Please LIKE 👍, FOLLOW ✅, SHARE 🙌 and COMMENT ✍ if you enjoy this idea! Also share your ideas and charts in the comments section below! This is best way to keep it relevant, support us, keep the content here free and allow the idea to reach as many people as possible. **
-------------------------------------------------------------------------------
💸💸💸💸💸💸
👇 👇 👇 👇 👇 👇

WTI Crude oversold bounce capped at 6030 resistanceThe WTI Crude Oil is currently trading with a bearish bias, aligned with the broader downward trend. Recent price action shows a retest of the longer term support, suggesting a temporary relief rally within the downtrend.
Key resistance is located at 6030, a prior consolidation zone. This level will be critical in determining the next directional move.
A bearish rejection from 6030 could confirm the resumption of the downtrend, targeting the next support levels at 5747, followed by 5677 and 5606 over a longer timeframe.
Conversely, a decisive breakout and daily close above 6030 would invalidate the current bearish setup, shifting sentiment to bullish and potentially triggering a move towards 6073, then 6170.
Conclusion:
The short-term outlook remains bearish unless the WTI Crude price breaks and holds above 6030. Traders should watch for price action signals around this key level to confirm direction. A rejection favours fresh downside continuation, while a breakout signals a potential trend reversal or deeper correction.
This communication is for informational purposes only and should not be viewed as any form of recommendation as to a particular course of action or as investment advice. It is not intended as an offer or solicitation for the purchase or sale of any financial instrument or as an official confirmation of any transaction. Opinions, estimates and assumptions expressed herein are made as of the date of this communication and are subject to change without notice. This communication has been prepared based upon information, including market prices, data and other information, believed to be reliable; however, Trade Nation does not warrant its completeness or accuracy. All market prices and market data contained in or attached to this communication are indicative and subject to change without notice.

USOIL: Uptrend strengthens after multiple support tests
* Trend: assessed using at least three trend indicators, with market structure as the primary guide.
** Weak or Reversal Signals: Assessed based on one of our criteria for trend reversal signals.
*** Support/Resistance: Selected from multiple factors – static (Swing High, Swing Low, etc.), dynamic (EMA, MA, etc.), psychological (Fibonacci, RSI, etc.) – and determined based on the trader’s discretion.
**** Our advice takes into account all factors, including both fundamental and technical analysis. It is not intended as a profit target. We hope it can serve as a reference to help you trade more effectively. This advice is for informational purposes only and we assume no responsibility for any trading results based on it.
George Vann @ ZuperView
USOIL BEARISH BIAS RIGHT NOW| SHORT
USOIL SIGNAL
Trade Direction: short
Entry Level: 58.02
Target Level: 57.01
Stop Loss: 58.69
RISK PROFILE
Risk level: medium
Suggested risk: 1%
Timeframe: 2h
Disclosure: I am part of Trade Nation's Influencer program and receive a monthly fee for using their TradingView charts in my analysis.
✅LIKE AND COMMENT MY IDEAS✅

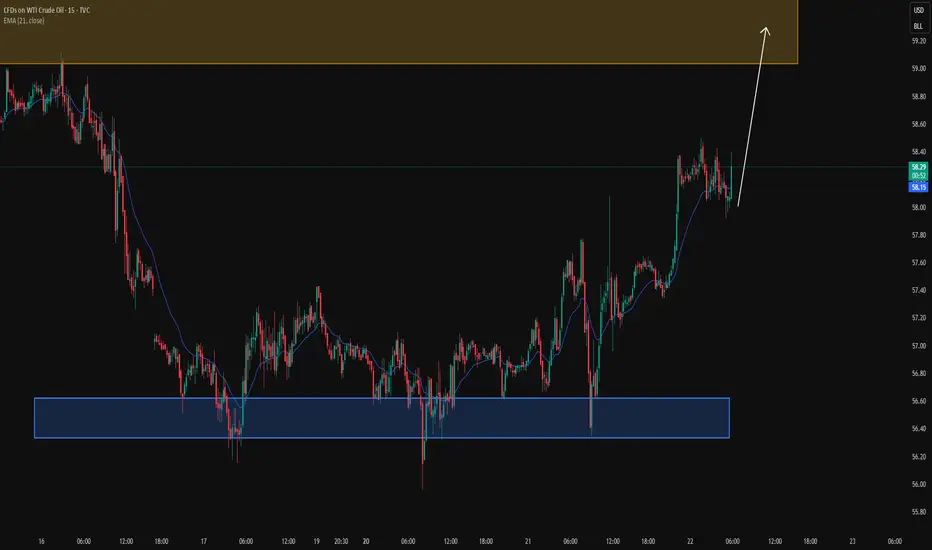
USOIL fluctuates higher💡The situation for USOIL today is relatively optimistic, showing a fluctuating and moderately strong trend. Here is the detailed analysis:
📈Price Trend: As of midday in the Asian session on October 22, WTI crude oil prices have edged higher in the short term, trading around $58.1, up from the previous day's closing price. WTI crude closed 1.14% higher at $57.962 the previous day.
♦Influencing Factors:
Supply Side: The U.S. Department of Energy announced a tender to purchase 1 million barrels of crude oil to replenish the Strategic Petroleum Reserve. This news boosted sentiment in the energy sector and provided support for oil prices.
♦Demand Side:
API data showed a decline in U.S. inventory levels last week, which improved market sentiment toward demand and also supported higher oil prices.
♦Macroeconomy: Expectations of a Federal Reserve rate cut continue to rise, with a 98.9% probability of a 25-basis-point rate cut in October. Capital has been flowing back into risk assets, providing some impetus to crude oil prices.
♦Geopolitics:
Europe and Ukraine have drafted a 12-point ceasefire plan. Expectations of eased geopolitical tensions temporarily weakened safe-haven demand, indirectly supporting a stronger U.S. dollar and thus exerting some pressure on oil prices. However, factors such as the U.S. oil purchase news and the drop in API crude inventories have provided more significant support for oil prices.
♦Technical Analysis:
Short-term moving averages show signs of flattening, indicating that the crude oil price trend may be stabilizing. Oil prices are inclined to fluctuate with moderate strength in the short term today. The short-term resistance level above is around 59.0-60.0, while the short-term support level below is around 56.0-55.0.
💎Trading Strategy:
Sell 58.00 SL 58.60 TP 57.00
Buy 57.5 SL 56.8 TP 58.5
Daily-updated accurate signals are at your disposal. If you run into any problems while trading, these signals serve as a reliable reference—don’t hesitate to use them! I truly hope they bring you significant assistance
Market Analysis: WTI Crude Oil Attempts ReboundMarket Analysis: WTI Crude Oil Attempts Rebound
WTI Crude oil is now attempting to recover after sliding toward $56.00.
Important Takeaways for WTI Crude Oil Price Analysis Today
- WTI Crude oil prices extended losses below the $60.00 support zone.
- It cleared a key bearish trend line with resistance at $57.50 on the hourly chart of XTI/USD.
WTI Crude Oil Price Technical Analysis
On the hourly chart of WTI Crude Oil, the price struggled to continue higher above $62.00 against the US Dollar. The price formed a short-term top and started a fresh decline below $61.20.
There was a steady decline below the $60.00 pivot level. The bears even pushed the price below $58.50 and the 50-hour simple moving average. Finally, the price tested $56.00. The recent swing low was formed near $55.94, and the price is now correcting losses.
There was a move above the 23.6% Fib retracement level of the downward move from the $62.45 swing high to the $55.94 low. The price cleared a key bearish trend line with resistance at $57.50.
On the upside, immediate resistance is near the 50% Fib retracement at $59.20. The main hurdle is $59.95. A clear move above $59.95 could send the price toward $62.45. The next stop for the bulls might be $64.00.
If the price climbs further, it could face sellers near $65.00. Immediate support is $57.50. The next major level on the WTI crude oil chart is $55.95. If there is a downside break, the price might decline toward $55.00. Any more losses may perhaps open the doors for a move toward the $52.00 zone.
This article represents the opinion of the Companies operating under the FXOpen brand only. It is not to be construed as an offer, solicitation, or recommendation with respect to products and services provided by the Companies operating under the FXOpen brand, nor is it to be considered financial advice.

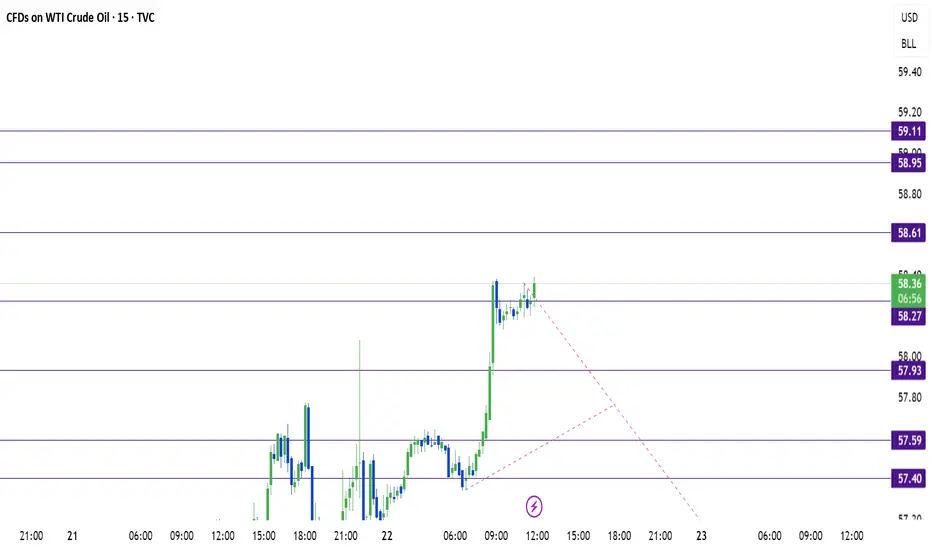
US OIL SUPPORT, RESISTANCE & TRENDLINE ANALYSISKindly check my previous levels "Perfect" Long position captured.
Go "SHORT" if it breaks 57.93 with target as 57.59 and breaking that will lead to 57.40 and further that will lead to 56.92 and the final breakout will lead to 56.42.
The 58.37 mark is acting as a strong resistance since quiet long.
Go "LONG" if it breaks 58.27 which shall lead to 58.61 and breaking that will lead to 58.95 and 59.11 and if it breaks this as well then might be a possibility of a good upside move till 60.09
Crude oil trading strategy for today.,Hope it is helpful to yoFactors That May Drive Up Crude Oil Prices (Bullish Logic)
1.Breakthrough in trade negotiations: If China and the United States reach a consensus at the summit to ease trade frictions, the global cargo transportation and economic outlook will improve, which may increase the demand for crude oil.
1.Unexpected geopolitical tensions: Although the Gaza conflict has ended, the situation between Russia and Ukraine remains unresolved. If further unrest breaks out in the Middle East or Eastern Europe, it may disrupt crude oil transportation. The market will worry about a shortage of oil supply, leading to a rise in oil prices.
1.Demand for technical rebound: Oil prices have dropped significantly from their previous highs, so a "short - term oversold rebound" may occur in the near future. Just like a ball bouncing back up after hitting the ground, some funds will take the opportunity to buy (and push up oil prices).
Crude Oil Trading Strategy for Today
usoil @buy57.50-58.00
pt:58.50-59
sl:57

USOIL Can Rise Higher (Swing Trade Opportunity)USOIL Can Rise Higher (Swing Trade Opportunity): OIL has been falling hard in the recent weeks. One of the reasons was the sub sector rotation. Most funds were being routed from energy to precious metals. Now OIL has completed and M pattern, which means that it can start to rise. So far this has showed a little upward movement which is not a sign of strength but rather an initial invite to the buyers.
Lets see if it gains momentum and becomes substantial.
Not a trade advice as usual.
Follow this channel and switch the notifications on for more. Please support this analysis by liking, commenting, and sharing with friends, colleagues, traders, and trading communities. Thanks👍🙂


US OIL SUPPORT, RESISTANCE & TRENDLINE ANALYSISThe market is sideways kindly save your capital yall.
Go "long" if it breaks the trendline and 57.45 and aim for 57.80 and 58.14 and if it breaks 58.37 then we might see a good move upside.
Go "Short" if it breaks below 57.12 and breaking the trendline as well will lead to 56.77 and 56.43.
Good Night!!

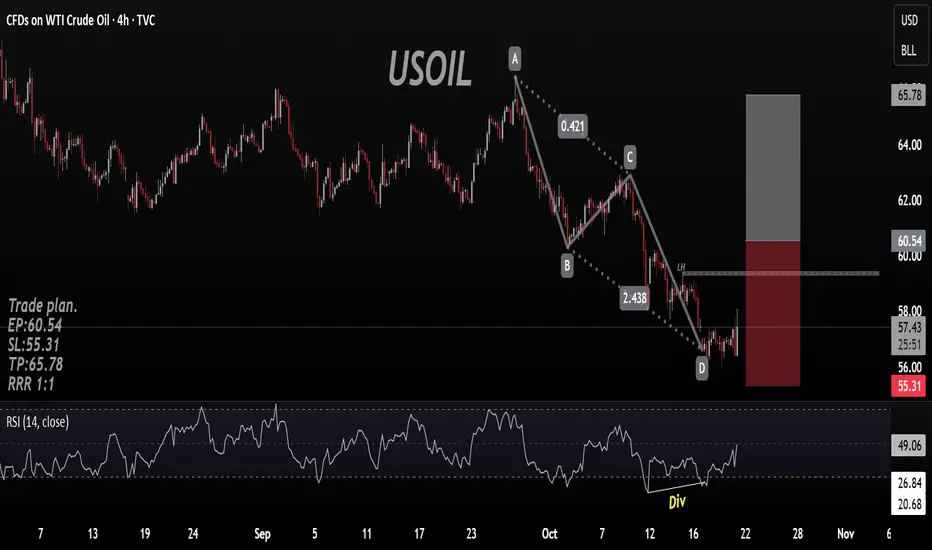
AB=CD Reversal Pattren on USOIL AB=CD reversal pattren with Divergence on Rsi.
Bias Long
Trade plan.
EP:60.54
SL:55.31
TP:65.78
RRR 1:1
USOIL – Downtrend Still IntactUSOIL remains fundamentally weak with technical confirmation of a prevailing downtrend. Short-term pullbacks are likely corrective and may provide better short-entry setups.
Resistance levels:
59.14
60.36
61.91 (Ultimate)
Support levels:
54.81
53.13
51.95 (Ultimate)

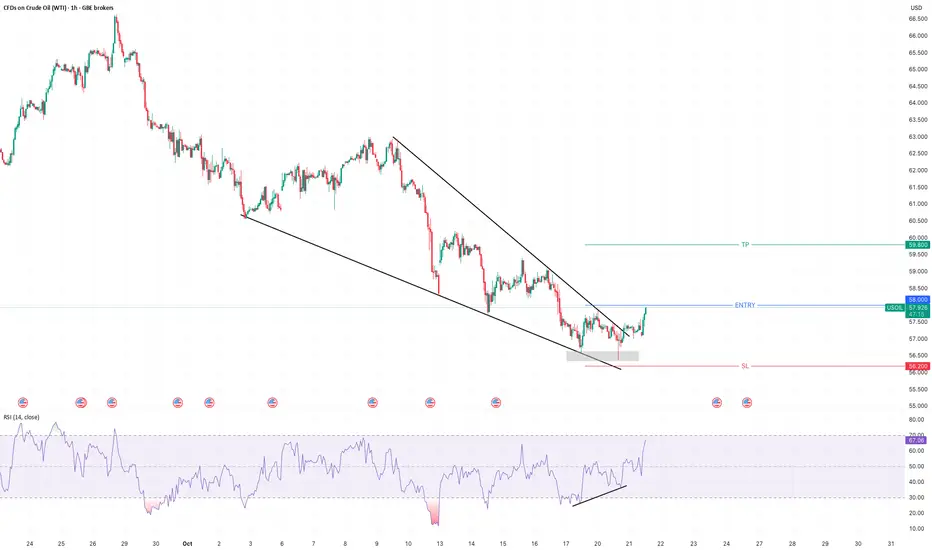
OilPrice is trying to break out of a downtrend channel after forming a base around $56.5–$57.
Resistance: $58 (short-term), $59.8, and $63 (major).
Support: $56.5–$57 zone.
Volume shows buying interest near the lows — early sign of accumulation.
If price holds above $58, it could aim for $59.8–$63.
If it fails, a pullback toward $56.2–$55.5 is likely.
➡️ Bias: Mildly bullish if $57.8–$58 holds; otherwise, range-bound to bearish continuation.

USOIL - Bullish ReversalUSOIL has formed falling wedge and double bottom and currently testing the neckline. Entry above last lower high.
US, OILHI GUYS,
We are still bullish on us oil
NOTE NOTHING HAS CHANGED, JUST LIQUIDITY GRABS IN LOWER TIME FRAMES. HOWEVER H4 IS STILL BULLISH