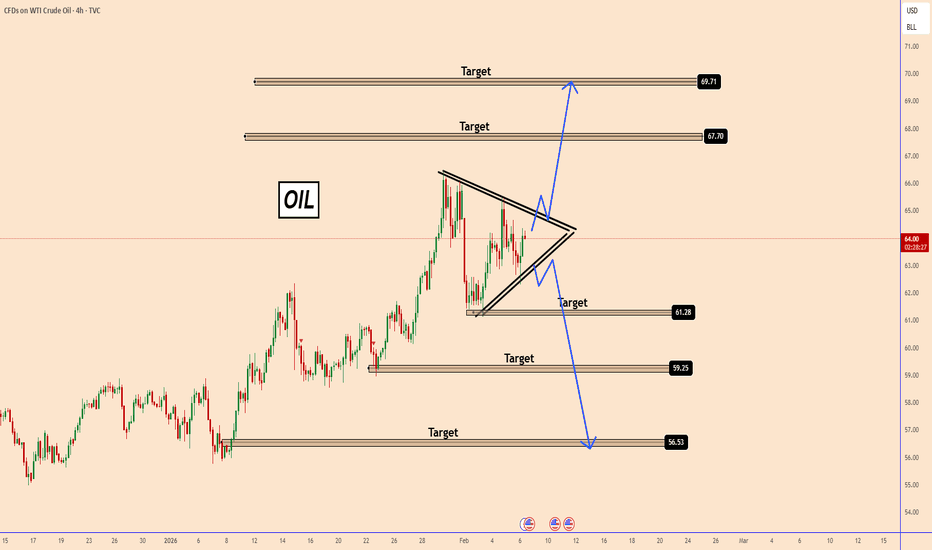
USOIL: Bearish Rejection at $66 Resistance & The Path to $60The Resistance Sweep: The title highlights the "Red Zone" at $66.00, where the price recently failed to sustain a breakout, creating a classic liquidity grab.
Fundamental Confluence: Today’s news confirms this bearish technical bias, as WTI futures fell to ~$62.50 following the IEA's report project
CRUDE OIL (WTI): Massive Breakout ConfirmedCrude Oil is currently experiencing significant bullish pressure.
The market violated a prominent falling trend line on a 4-hour chart, and it has also moved beyond a substantial horizontal demand zone.
These violated horizontal and vertical structures now form an expanding demand zone.
I anticipat
Hellena | Oil (4H): SHORT to 100% Fibo (59.144).As for oil, a major ABC correction in wave B of a higher order continues.
Wave “C” should be approximately equal to wave “A”, so I expect a correction in wave ‘B’ to the level of 63.789, followed by a decline in wave “C” to the level of 100% Fibonacci extension 59.144.
There is a possibility of wave
Oil at a Crossroads as US–Iran Talks LoomOil at a Crossroads as US–Iran Talks Loom
Oil has not been moving for days. The current geopolitical tension is creating an even more confusing path for one of the most traded commodities.
The problem this time is Iran.
The White House confirmed that the US and Iran will meet for talks in Oman on
WTI Crude Oil Shows Bearish Momentum Near Channel Resistance AreCrude Oil (WTI) on the 1-hour timeframe is showing signs of bearish pressure after rejecting the upper boundary of the rising channel. Price failed to sustain above the highlighted resistance zone and broke below the short-term ascending trendline, indicating weakening bullish momentum. The recent p
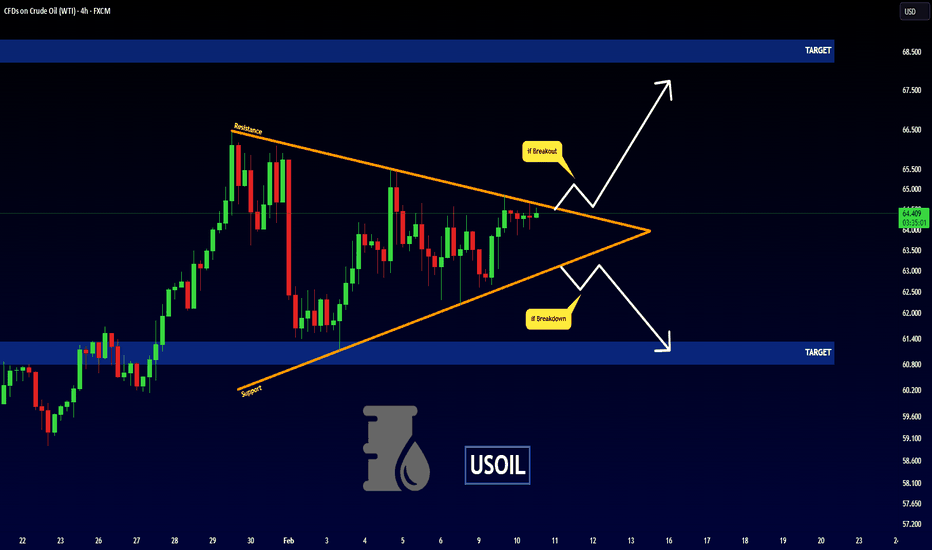
2 Scenarios - USOILHello traders,
the USOIL price has formed a symmetrical triangle pattern,
so we now have two possible scenarios :
🟢 BULLISH SCENARIO:
If the market breaks and closes above the resistance line,
we can expect a strong bullish move .
🎯 TARGET: 68.230
🔴 BEARISH SCENARIO :
If the price breaks
WTI Crude Oil Accumulating at Demand Zone
On the 1-hour timeframe, price recently experienced a sharp bearish drop and tapped into a strong demand zone around **62.00–62.40**. After the selloff, the market shifted into a tight consolidation range, showing reduced volatility and seller exhaustion — a typical accumulation behavior.
The Ichi
WTI Oil Price Climbs to a Monthly HighWTI Oil Price Climbs to a Monthly High
As the XTI/USD chart shows, the price per barrel moved above the 4 February peak yesterday, marking its highest level since the start of the month. The bullish sentiment has been driven by geopolitical uncertainty. According to media reports:
→ The Trump–Net
See all ideas
Displays a symbol's price movements over previous years to identify recurring trends.


