This 3-Step System Will Help You Understand TrendsMan yesterday i saw
something inside myself that i have never seen.
The power to hold back and be patient.
One thing is for sure patience
will always beat speed.
Yes speed works wonders.
But patience gives you faith and results.
While speed gives you only results.
Its okay to be the tortoise or the slow one.
Am very slow at learning stuff
But once i learn it,
man its like there is no going back
i become a freaking machine.
Learning the rocket booster strategy
is something that i want you to grab on to.
This strategy will save your butt.
This strategy will be your bread and butter.
Its freaking easy.
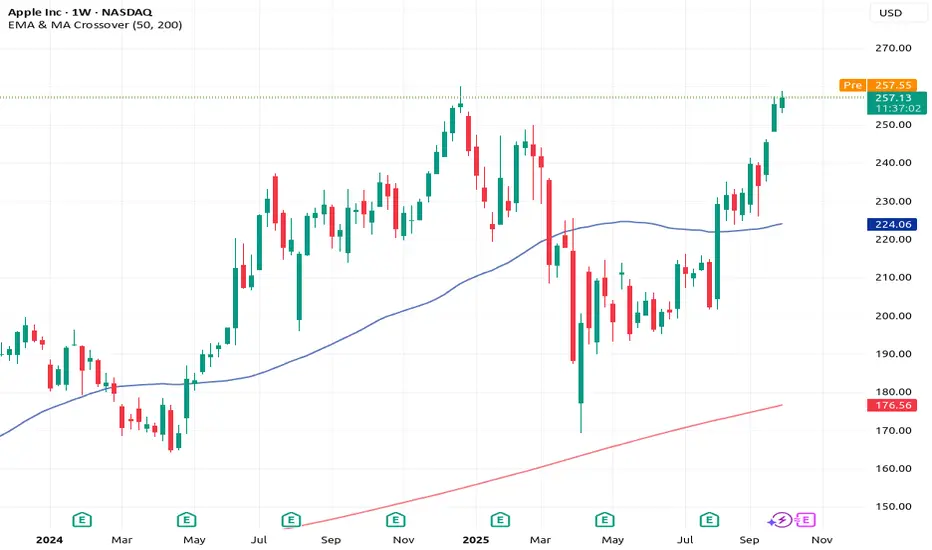
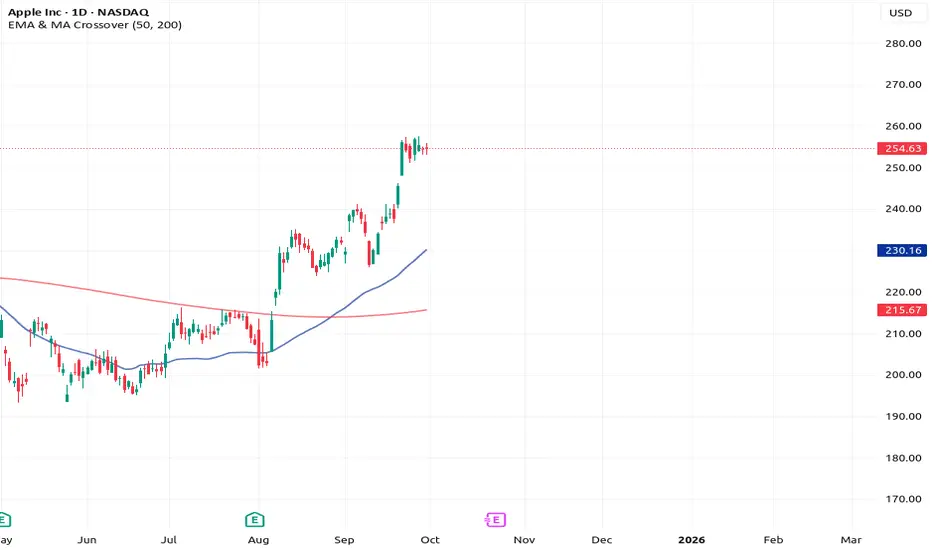
Its very easy Its done in 3 steps look at this
chart: NASDAQ:AAPL
1- The price should be above the 50 EMA
2- The Price should be above the 200 EMA
3- The price should gap up or trend up.
Remember this is a trending trading system.
Its not a reversal trading system.
Rocket boost this content to learn more.
Disclaimer: Trading is risky
please learn risk management and profit taking strategies.
Also feel free to use a simulation trading account
Make sure you trade trade above x10 Margin
Trade ideas
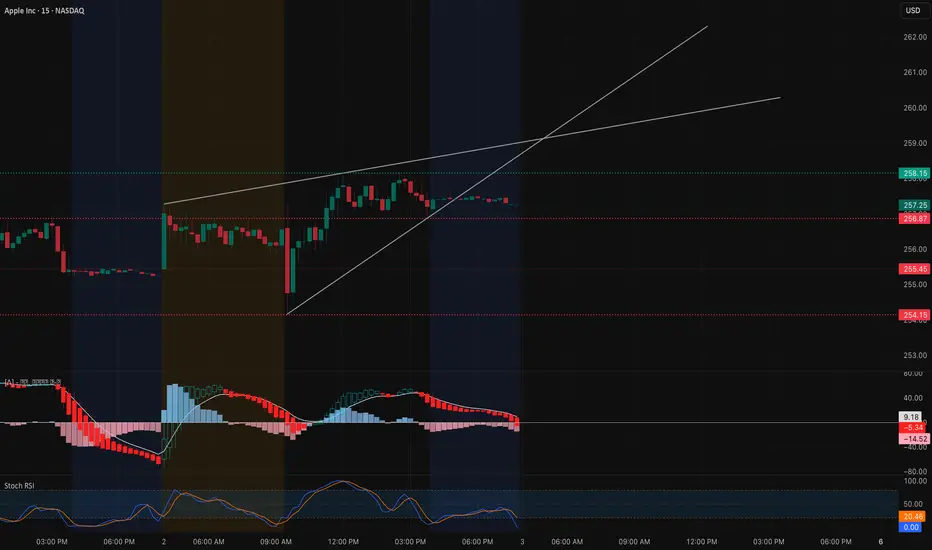
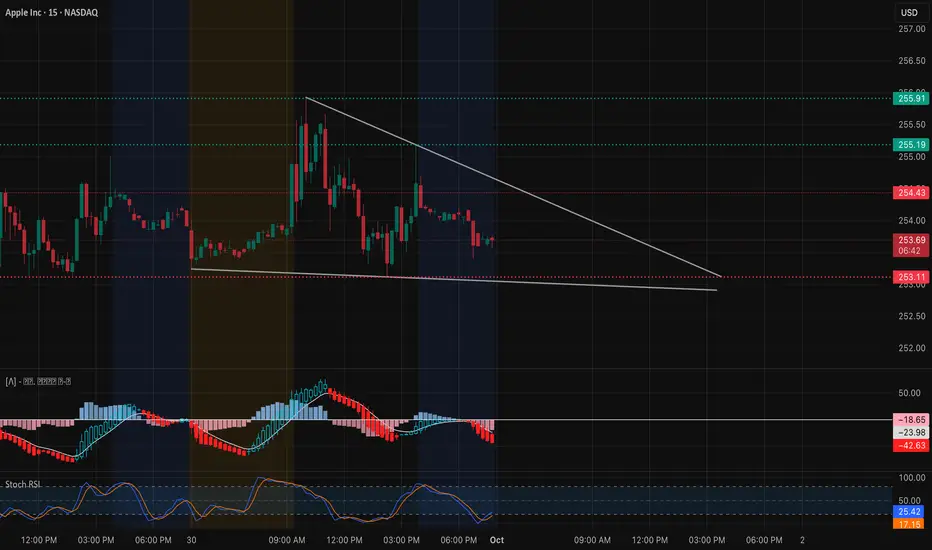
AAPL Breaking Wedge? Key Gamma Levels to Watch for Oct 3 Intraday Technical Outlook (15m Chart)
Apple (AAPL) is currently trading near $256.7, consolidating inside a rising wedge formation. The short-term trendline support is being tested, while momentum indicators show early weakness:
* MACD: Bearish crossover with histogram fading, suggesting potential downside pressure.
* Stoch RSI: Cooling off from overbought levels, hinting at reduced buying momentum.
* Key Levels: Immediate intraday support sits near $257–256.5, with stronger downside zones at $255.5 and $254.2 if wedge support breaks. Resistance remains at $259.2–260.0, aligned with the upper wedge line.
Intraday takeaway: Price action is in a tightening range — a breakdown below $256.5 could invite fast downside scalps, while a bounce back above $259.2 opens room for a squeeze toward $260+.
Options Sentiment & GEX Outlook (1H Chart)
The 1-hour GEX map is showing well-defined institutional positioning:
* Gamma Walls:
* $260–262.5: Heavy call wall cluster, aligning as a gamma resistance zone.
* $257.5: Highest positive GEX level, acting as a magnet and resistance pivot.
* $252.5–250: Key put walls, serving as gamma support.
* Implications:
* If AAPL holds above $257.5, momentum traders could target the $260–262.5 gamma wall for short-dated calls.
* Failure to sustain above $257.5 risks a fade toward the $255–252 zone, favoring put spreads.
* Volatility Context: IVR sits around 19.7 (below average), which means option premiums are relatively cheap. This favors directional plays, but be mindful of quick moves as AAPL sits near a gamma pivot.
My Thoughts & Recommendation
For Oct 3 trading, I see AAPL in a make-or-break setup:
* Intraday (scalping/trading): Watch for a wedge break. A clean move below $256.5 favors a test of $255–254. On the upside, reclaiming $259.2 can accelerate momentum toward $260–262.5.
* Options trading (swing/0DTE): Calls make sense only above $257.5, aiming for the $260–262.5 wall. Otherwise, puts are more favorable if price rejects from $257.5 and drifts back into the $255 zone.
Overall bias: Neutral-to-bearish intraday unless $259+ is reclaimed.
Disclaimer:
This analysis is for educational purposes only and does not constitute financial advice. Always conduct your own research and manage risk before trading.
AAPLApple (AAPL) price is in a strong uptrend, there is a chance that the price will test the $261-$265 level. In this zone, if the price cannot break above $265, the short-term price is likely to go down, consider selling the red zone.
🔥Trading futures, forex, CFDs and stocks carries a risk of loss.
Please consider carefully whether such trading is suitable for you.
>>GooD Luck 😊
❤️ Like and subscribe to never miss a new idea!
$AAPl - all time highs break possible soon.AAPL = stock having a fakeout breakout movement today after being in a tight channel. Stock has all time highs at $259.18 . rejecting close to that level today. looking for bigger breakout if that level breaks.
Apple + The 3 Step Rocket Booster StrategyI know i said i would stop talking about
stocks but i thought about you..
Maybe you are still in the making it stage
Maybe you only have access to forex options
but remember if thats the case dont
trade above x4 margin
Especially if you are dealing with stock
options.
Its because of you i fought hard to
design the Rocket booster
strategy.
This is the strategy i started with
its beginner friendly and
very easy to understand
it has 3 steps. i think the reason it become
so popular is because its very simple
so here are the following 3 steps:
1-The price has to be above the 50 EMA
2-The price has to be above the 200 EMA
3-The price should gap up
The last step is very important for you
to understand because it filters out
the noise in the trading.
How?
Because it has to be trending upwards
on the week and the day to signal
a beginner friendly entry for you.
Look at NASDAQ:AAPL
you can clearly see that its gapped up.
Rocket boost this content to learn more.
Disclaimer: Trading is risky
please use a simulation trading account
before you trade with real money.
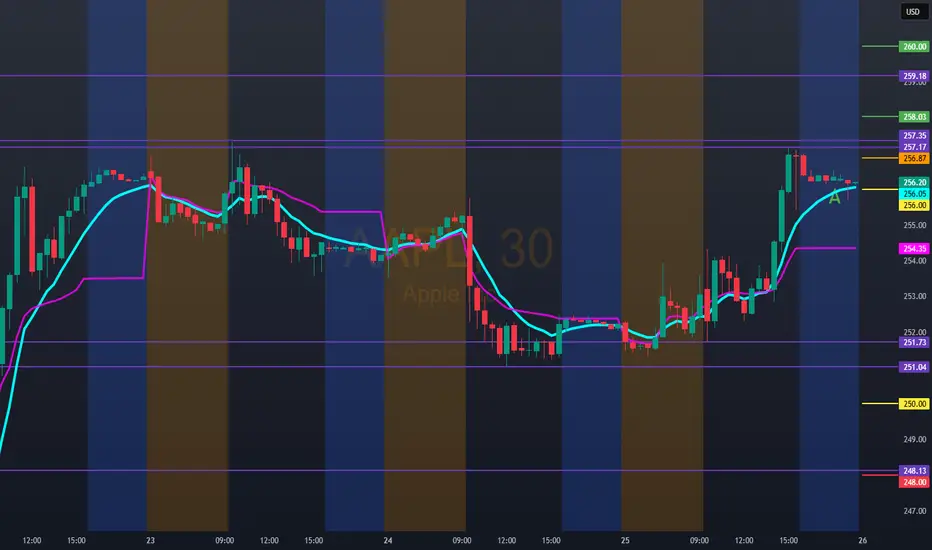
AAPL Oct. 1 – Coiling Below Resistance, Next Big Move Loading!Intraday View (15-Min Chart)
AAPL traded choppy with a clear descending trendline pressing price lower. It’s holding around $253–$254, but momentum is fading as MACD stays red and Stoch RSI remains weak.
* Support Levels: $253.11, $253.58, $254.43
* Resistance Levels: $255.19, $255.91
* Indicators: MACD firmly negative, showing sellers still in control. Stoch RSI hovering near lows, suggesting potential for a small bounce.
📌 Intraday Thought (Oct. 1): If $253 holds, AAPL could bounce back to $255+. A breakdown under $253 risks a slide toward $250. Scalpers can lean long on $253 support with tight stops, or fade into $255.9 resistance if price rejects.
Options & Swing View (1H + GEX)
Gamma exposure provides a wide setup:
* Upside: Heavy call walls at $257–$262.5, with a gamma cluster stretching toward $265–$270.
* Downside: Put support around $247.5–$242.5, deeper wall at $237.5.
This keeps AAPL boxed between $250–$257 in the short term. A break over $257 could trigger a push into $262–$265, while losing $250 risks deeper tests toward $247.
* Bullish Play (Oct. 1): Calls targeting $262.5–$265 if $257 breaks on volume.
* Bearish Hedge: Short puts toward $250 → $247.5 if support fails.
* Neutral Play: Iron condor between $247.5–$257 while AAPL consolidates.
My Thoughts (Oct. 1)
AAPL is stuck under a descending trendline, and momentum looks weak into the close. The $253 level is key—hold it and we could see a bounce back to $255+, but a break lower risks sliding toward $250. For options, I’d wait for a confirmed move through $257 breakout or $250 breakdown before sizing up.
Disclaimer: This analysis is for educational purposes only and does not constitute financial advice. Always do your own research and manage risk before trading.
Sell-off Incoming In my last idea, I forecasted that the price would rise to the resistance level of $255–$260. Now I’m expecting it to reject that level and continue downwards.

Apple - the last chance to hop on before new ATH?NASDAQ:AAPL Apple formed a mini consolidation pattern, which might be the last stop before the new ATH. The volume profile looks bullish, which is confirmed by the indicators.
With an entry point at 257.30$ and stop loss at 250.30$ a price increase of 8.5% (to 280$) will result in 3RR.

market update 9-29SPY needs to get under 654 for any substantial break to occur, otherwise it will test and likely exceed it's highs. Gold may be running out of steam soon. Bitcoin needs to hold 109k. AAPL testing it's highs but could we see a down move next? Worth watching....

Drivers of Profits in Emerging Markets1. Introduction to Emerging Markets
Emerging markets are economies experiencing rapid growth and industrialization, typically with increasing integration into the global economy. They are often characterized by:
High growth potential: GDP growth rates exceeding those of developed economies.
Structural transformation: Shifts from agriculture to industry and services.
Market volatility: Exposure to political, economic, and currency fluctuations.
Untapped consumer bases: Large populations with rising income levels.
Profits in emerging markets are driven by unique combinations of internal and external factors, which can differ significantly from developed markets.
2. Macroeconomic Drivers of Profits
Macroeconomic stability and growth are primary drivers of corporate profitability. Key factors include:
2.1 Economic Growth
Strong GDP growth increases demand for goods and services.
Rapid urbanization fuels infrastructure, real estate, and consumer markets.
Industrialization and rising manufacturing output create investment opportunities.
2.2 Inflation and Interest Rates
Moderate inflation encourages consumption and investment.
High inflation can erode profit margins.
Interest rate policies influence borrowing costs for businesses and consumer credit availability.
2.3 Exchange Rates
Currency stability attracts foreign investment and reduces transactional risks.
Depreciation can boost export competitiveness but increase import costs.
Multinational companies must manage currency risk to protect profits.
2.4 Fiscal and Monetary Policies
Government spending on infrastructure, health, and education stimulates economic activity.
Central bank policies controlling money supply affect liquidity and capital availability.
Tax incentives or subsidies for strategic sectors can improve profitability.
3. Market Structure and Competitive Dynamics
The structure of the market significantly impacts profitability:
3.1 Market Concentration
Oligopolistic markets with few competitors often allow for higher profit margins.
Competitive markets encourage innovation but may pressure prices and reduce margins.
3.2 Entry Barriers
Regulatory hurdles, capital requirements, and access to distribution networks influence profitability.
Markets with moderate entry barriers attract strategic investments without saturating demand.
3.3 Informal Sector and Shadow Economy
In many emerging markets, the informal sector constitutes a significant portion of economic activity.
Businesses navigating both formal and informal markets can identify niche opportunities for profit.
4. Sectoral Drivers of Profit
Profitability varies by industry due to sector-specific trends and growth potential:
4.1 Consumer Goods and Retail
Rising middle-class incomes drive consumption of packaged goods, electronics, and luxury items.
Brand loyalty, product differentiation, and pricing strategies are crucial.
4.2 Financial Services
Expanding access to banking, microfinance, and digital payments increases revenue potential.
Fintech innovations reduce costs and widen customer reach.
4.3 Infrastructure and Real Estate
Rapid urbanization fuels demand for housing, roads, and utilities.
Public-private partnerships and government investment in infrastructure enhance returns.
4.4 Technology and Telecommunications
High mobile penetration and digital adoption create opportunities in software, e-commerce, and telecom.
Profit margins are driven by scalability and network effects.
4.5 Natural Resources and Commodities
Emerging markets often have abundant natural resources, making mining, oil, and agriculture lucrative sectors.
Global commodity prices and extraction costs determine profitability.
5. Consumer Behavior and Demographics
5.1 Rising Middle Class
Increasing disposable income drives demand for consumer goods, services, and entertainment.
Businesses can profit by targeting evolving lifestyles and preferences.
5.2 Youth Population
A large, young population accelerates adoption of technology, fashion, and social trends.
Marketing strategies tailored to digital-native audiences enhance revenue potential.
5.3 Urbanization
Migration to cities boosts consumption of housing, retail, transport, and healthcare services.
Urban demand patterns create profitable business clusters.
6. Innovation and Technology Adoption
6.1 Digital Transformation
Mobile banking, e-commerce, and online platforms expand market reach.
Technology reduces operational costs and increases efficiency.
6.2 Product and Service Innovation
Companies introducing affordable, locally tailored products often achieve higher profitability.
Innovations in supply chain, logistics, and payment solutions enable scalability.
6.3 Automation and Efficiency
Adopting modern manufacturing, AI, and logistics technologies reduces production costs.
Operational efficiency directly translates into improved profit margins.
7. Government Policies and Regulatory Environment
7.1 Regulatory Reforms
Simplified business registration, reduced tariffs, and foreign investment liberalization enhance profitability.
Clear legal frameworks protect intellectual property and contracts.
7.2 Tax Incentives and Subsidies
Sector-specific incentives (e.g., renewable energy, manufacturing) lower operational costs.
Export incentives improve competitiveness in global markets.
7.3 Trade Policies
Trade agreements and preferential tariffs facilitate exports.
Regulatory alignment with global standards attracts multinational partnerships.
8. Globalization and Foreign Investment
8.1 Foreign Direct Investment (FDI)
FDI brings capital, technology, and managerial expertise.
Joint ventures with foreign firms often lead to higher profitability.
8.2 Access to Global Markets
Emerging markets integrated into global supply chains benefit from export-driven profits.
Access to international brands and technology enhances competitiveness.
8.3 Remittances
Inflows from diaspora populations increase domestic consumption, driving profits in consumer sectors.
9. Risk Management and Profit Sustainability
Profitability in emerging markets requires managing inherent risks:
9.1 Political and Regulatory Risk
Political instability, policy reversals, and corruption can disrupt operations.
Companies employing local partnerships and risk mitigation strategies sustain profitability.
9.2 Currency and Inflation Risk
Hedging against currency depreciation protects international revenues.
Pricing strategies adjusted for inflation safeguard margins.
9.3 Operational and Supply Chain Risk
Robust supply chains and logistics networks reduce operational costs.
Local sourcing and diversified suppliers enhance resilience and profitability.
10. Sustainability and ESG Considerations
Environmental, social, and governance (ESG) practices increasingly influence profitability.
Companies adopting sustainable practices gain long-term market trust and access to global investors.
Renewable energy projects, sustainable agriculture, and ethical manufacturing often yield competitive returns.
11. Case Studies and Examples
India: Rapid growth of fintech and e-commerce driven by a young, tech-savvy population.
Vietnam: Manufacturing and exports of electronics and garments have created high-margin business opportunities.
Brazil: Agricultural exports and natural resources remain major profit drivers, influenced by global commodity prices.
Nigeria: Telecommunications and mobile payment services have seen exponential growth due to rising urbanization and digital adoption.
12. Conclusion
Profits in emerging markets are driven by a complex interplay of macroeconomic growth, market dynamics, sector-specific trends, consumer behavior, innovation, regulatory frameworks, and global integration. While opportunities are substantial, businesses must navigate volatility, political risks, and operational challenges to sustain profitability. Strategic investments, technological adaptation, and understanding local market nuances are crucial for capitalizing on the growth potential of emerging markets.
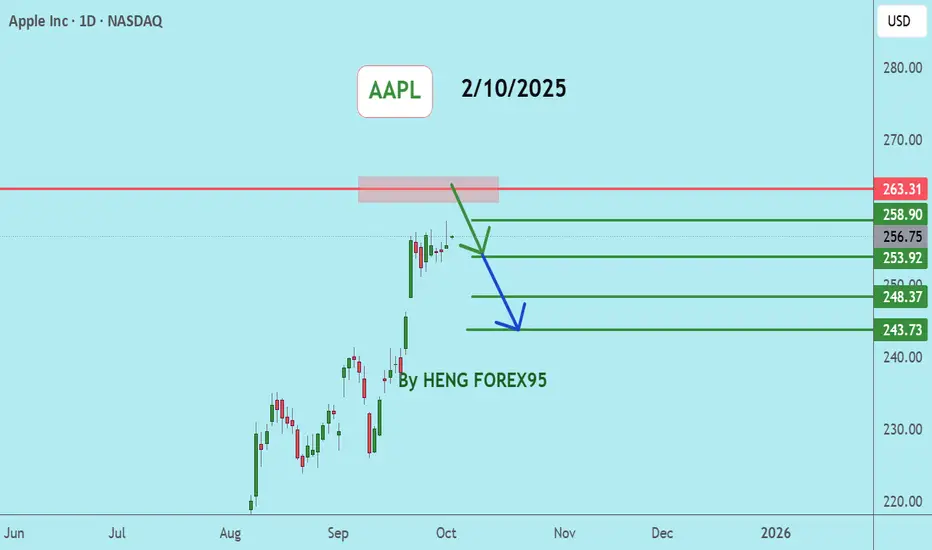
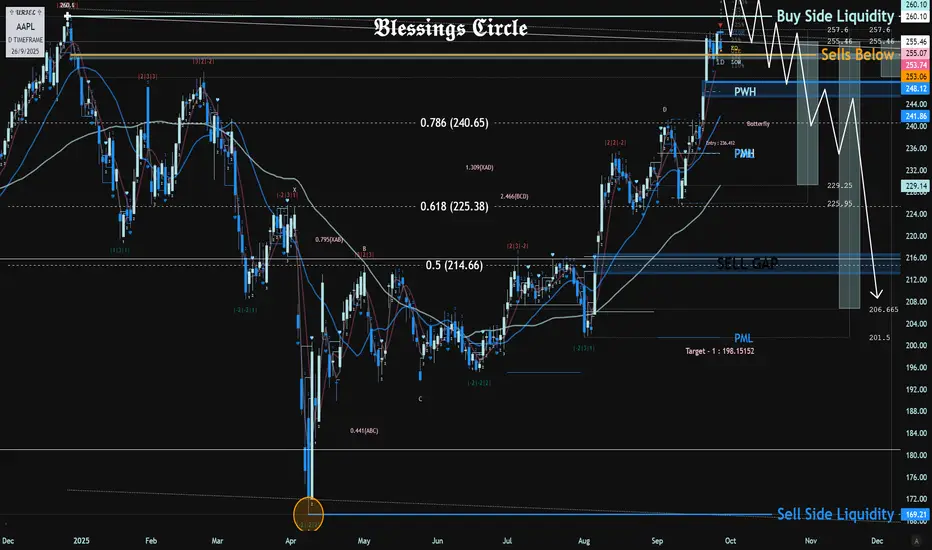
Hope The Apple Doesn't Rot The Fall of The Big Apple
Watching For AAPL to Potentially Trade into 260.10 This Week.
If 260.10 Does Trade I Will Be Looking To Short & Actively Scale into Sells Up Until 265.
If AAPL Were To Squeeze Above 265, The Sells Thesis Would Be Null.
First Sells Target Would Be Into The Sell Gap @ 248-245.
Second Sells Target Would Be The Second Sell Gap @ 216-212.
Third Sells Target Would Be The April Wick Low @ 169.21.
We Can Fall Potentially Fall As Low As 100 or Maybe Even Lower, but Majority If Not 100% of My Sells Positions Will Be Scaled Out Into The Above Sells Targets.
Good Luck To All Traders Going Into The Month Of October & Start of Q4.
With NFP on Friday to Finish off The Week Make Sure To DE Risk If Long.
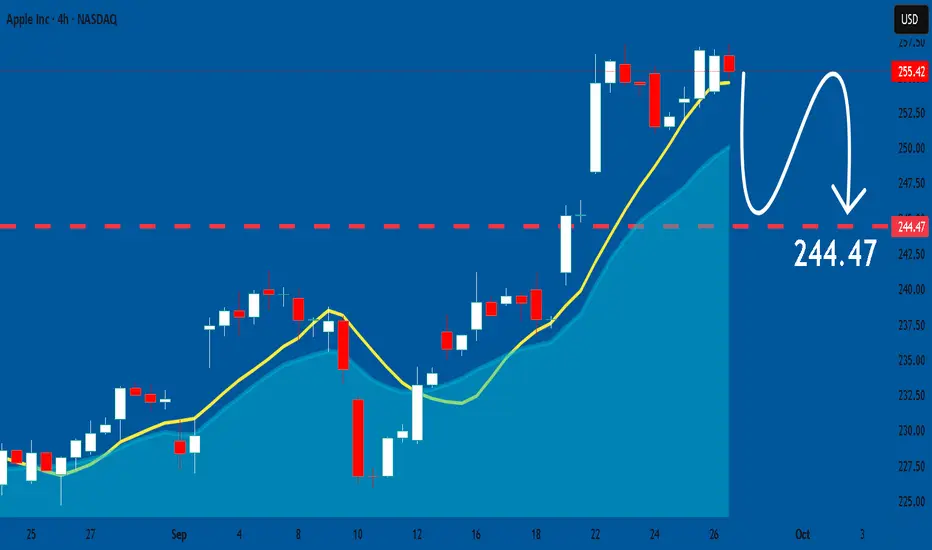
APPLE Technical Analysis! SELL!
My dear friends,
Please, find my technical outlook for APPLE below:
The price is coiling around a solid key level - 255.42
Bias - Bearish
Technical Indicators: Pivot Points Low anticipates a potential price reversal.
Super trend shows a clear sell, giving a perfect indicators' convergence.
Goal - 244.04
About Used Indicators:
The pivot point itself is simply the average of the high, low and closing prices from the previous trading day.
Disclosure: I am part of Trade Nation's Influencer program and receive a monthly fee for using their TradingView charts in my analysis.
———————————
WISH YOU ALL LUCK

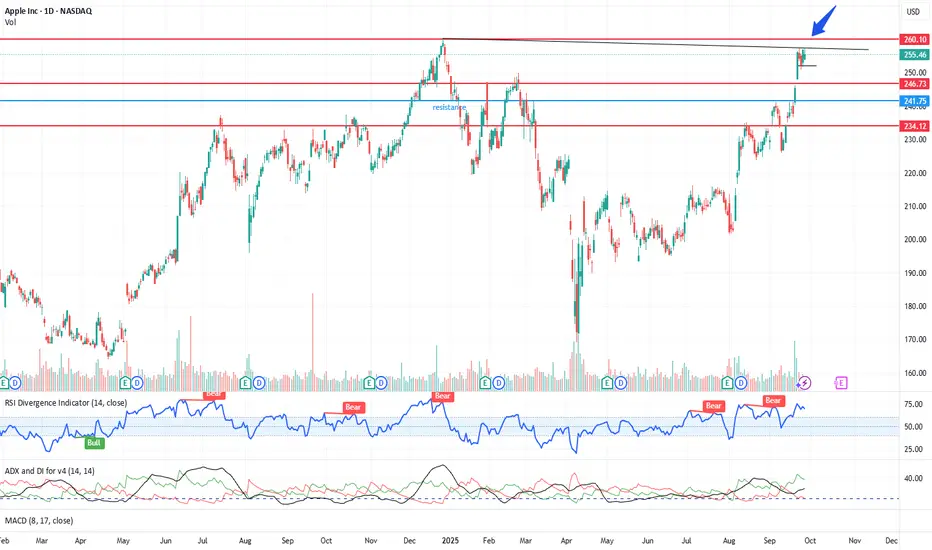
Apple📊 NASDAQ:AAPL Weekly Chart – Sept 27, 2025
Apple trading at $255.46, just below recent highs of $259.18
Momentum is strong, but approaching major resistance 👇
🔴 Key Resistance Zones:
$259–$265 → Top of ascending channel
$248–$242 → Previous multi-top rejections (watch for seller pressure)
🟢 Support Levels to Watch:
$232 / $223 / $219 → Recent demand zone with bullish bounces
$207 → Key level, last strong breakout base
$184 → High-conviction support + long-term trendline area
Deeper: $168 / $154 / $145 = macro support zones
⚠️ A breakout above $259 could trigger new ATH push
✅ Holding above $232 keeps trend healthy
📉 Losing $207 opens risk of deeper correction
#AAPL #Apple #Stocks #TechnicalAnalysis #Investing #NASDAQ #Charting

APPLE: Bears Will Push Lower
Remember that we can not, and should not impose our will on the market but rather listen to its whims and make profit by following it. And thus shall be done today on the APPLE pair which is likely to be pushed down by the bears so we will sell!
Disclosure: I am part of Trade Nation's Influencer program and receive a monthly fee for using their TradingView charts in my analysis.
❤️ Please, support our work with like & comment! ❤️
Time to pluck the Apple?Apple has made a slanted double top and showing resistance around $257. An hourly closing below $250 will create more weakness and opportunity for shorting, while if it gives a daily closing above $260, then we may see more upside and a new ATH. The chances of downside are a bit more given the current scenario. In nutshell, expect a good move on either side (more chances of lower side) Keep an eye. (For educational purpose only)
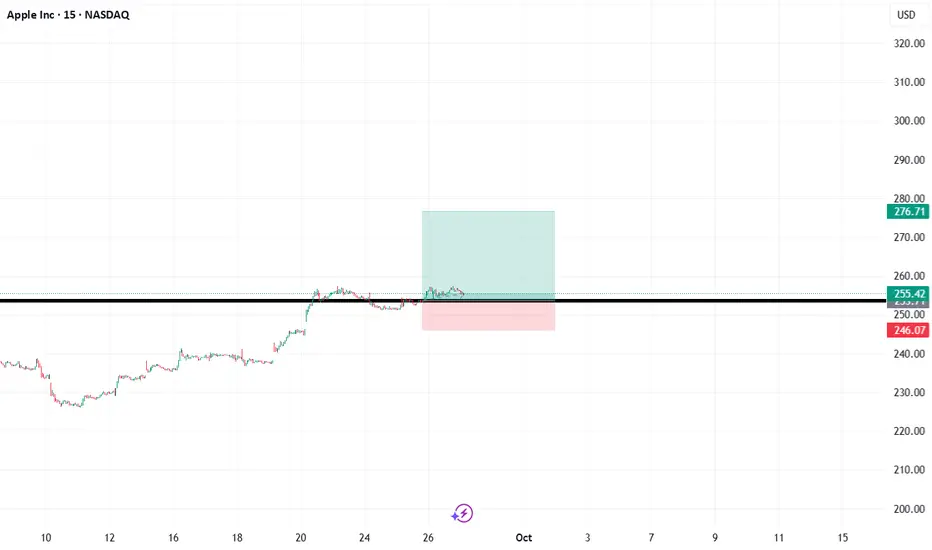
AAPL - Bullish Breakout and Retest SetupHello fellow traders,
This is a technical analysis of Apple Inc. (AAPL) on the 15-minute chart.
As we can see from the price action, AAPL has recently broken through a key horizontal resistance level at approximately $255.42. Following the breakout, the price is now consolidating above this level, which is a classic sign of a potential resistance-turned-support retest.
This "breakout and retest" is a common bullish pattern that could signal further upward movement. Based on the long position tool drawn on the chart, here is a potential trade setup:
Entry: Around the new support level of $255.42.
Stop Loss: A stop loss could be placed at $246.07, below the recent price structure, to manage potential downside risk if the support level fails to hold.
Take Profit: The potential target for this trade is set at $276.71.
This setup provides a risk-to-reward ratio of approximately 2.28 to 1.
Disclaimer: This is for educational purposes only and represents a technical viewpoint. It is not financial advice. Please do your own research and manage your risk appropriately before entering any trade.
Apple Shares (AAPL) Close to Reaching Record HighApple Shares (AAPL) Close to Reaching Record High
On 10 September, we noted that following the launch of new products — including the iPhone 17 — AAPL shares had fallen by approximately 1.5%, as analysts considered the model lacked the breakthrough appeal necessary to drive further growth.
However, two weeks on, media reports point to strong demand for the new product range, highlighting that:
→ orders for the new devices exceed those for last year’s iPhone 16 series;
→ Apple has asked suppliers to increase production;
→ the base model, featuring the long‑awaited 120Hz display and the powerful A19 chip, is in especially high demand.
Positive reports of long queues at Apple Stores worldwide, along with extended delivery times — which Bank of America estimates at an average of 18 days compared to 10 days for last year’s model — have only bolstered bullish sentiment. AAPL shares are rising this week, even as broader market indices are falling.
Technical Analysis of Apple (AAPL) Shares
AAPL stock price movements in 2025 form a broad ascending channel (shown in blue). In this context:
→ Until early August, the price remained in a consolidation phase (shown by black lines) below the channel’s median;
→ Since then, the balance has shifted in favour of buyers — the price has demonstrated bullish momentum, forming a steep growth channel (shown in orange), with the median providing support (indicated by an arrow).
The strength of demand is confirmed by AAPL’s price action rising from $240 to $250:
→ bullish candlesticks were wide;
→ closing prices were close to the highs;
→ a bullish gap is visible on the chart.
This points to a buyers’ imbalance, giving grounds to regard this area as support in terms of a Fair Value Gap pattern.
From a bearish perspective:
→ the RSI indicator is in overbought territory;
→ shareholders may wish to take some profits.
Nevertheless, it cannot be ruled out that AAPL’s price growth will continue, driven by expectations that strong demand for the iPhone 17, as well as the updated Apple Watch Series 11 and AirPods Pro 3 with new AI features, will deliver record quarterly revenue for the company, covering the upcoming holiday season. In this scenario, bulls may target the upper boundary of the blue channel.
This article represents the opinion of the Companies operating under the FXOpen brand only. It is not to be construed as an offer, solicitation, or recommendation with respect to products and services provided by the Companies operating under the FXOpen brand, nor is it to be considered financial advice.
Surpassing 100.00% expansion, Apple continue to rage on NASDAQ:AAPL upside remains strong and is likely to continue higher as the stock has surpassed the 100.00% expansion, implying that the upside may enter into an impulse wave. Near-term target could see 260.64 (123.6%) expansion level being met. Major target is at 285.00. Key support is at 241.00
This is an update on Apple on 7th Aug 2025

Hello trader, for tomorrow, AAPL 256.87Bullish entry 258.00/260.00, stop below vwap.
Technical bearish entry below 256.00, possible down to the 252.00/250.00 area. 256.00 could also act as a rebound zone, forming a bearish rejection candle.
AAPL Bullish Swing Setup – Buy the Dip for $289 Target1. Chart Type & Timeframe
Symbol: Apple Inc. (AAPL)
Timeframe: 4H (4-hour candles)
Platform: TradingView
This is a short- to medium-term analysis, not a long-term forecast.
2. Trend Analysis
The price is in a rising channel (marked in red), meaning the overall trend is bullish.
Currently, the price is near the upper boundary of the channel, showing a possible short-term pullback before resuming upward momentum.
3. Entry & Stop-Loss
Entry Point: Around $244.32 – $244.54
This is near the lower boundary of the channel, a support zone.
Suggests waiting for a pullback before entering.
Stop Loss: Around $233.72 – $234.37
Positioned below the channel, so if price breaks this, it may signal a trend reversal (protects capital).
4. Target
Target Price: Around $288.91 – $289.13
This is significantly higher than the entry, showing a risk/reward ratio of ~4:1, which is favorable.
It aligns with projecting the channel’s trend upward.
5. Price Action Expectation
The black zig-zag line shows a pullback first, then a bounce back up from the support area (entry zone).
If price respects support, a bullish rally toward $289 can follow.
6. Key Observations
✅ Bullish Setup: Good reward potential if the price bounces at support.
✅ Clear Risk Management: Stop loss is properly placed below structure.
⚠ Caution: If price breaks below $234, trend could reverse — no trade should be held below stop loss.
Summary
This is a bullish swing trade plan for Apple:
Wait for pullback near $244 before buying.
Stop-loss below $234 to manage risk.
Target $289, giving a strong risk/reward ratio.
This plan assumes that the uptrend channel will hold and price will respect support before moving higher.

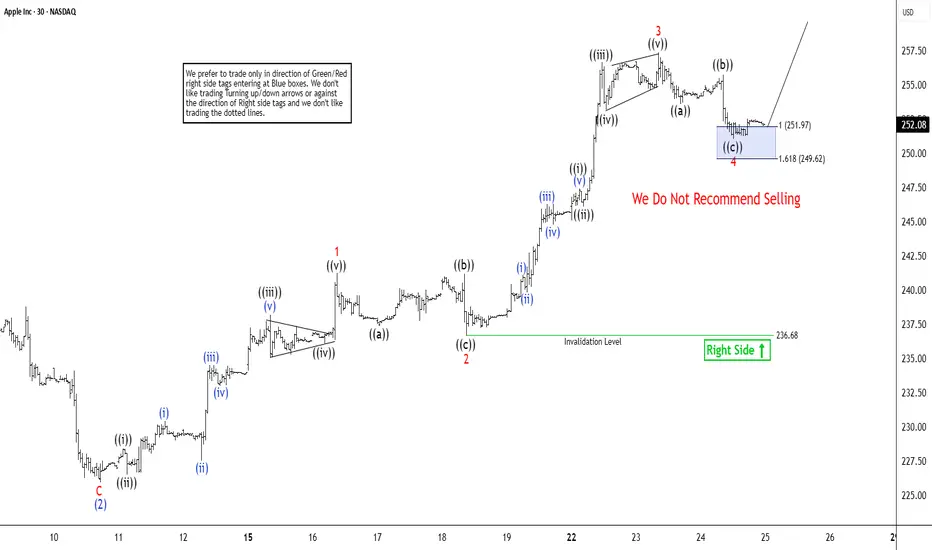
Apple (AAPL) Targets Higher to Finish Wave 5The short-term Elliott Wave analysis for Apple (AAPL) indicates that a rally from the September 11, 2025 low is unfolding as a five-wave impulse structure. Starting from that low, wave ((i)) concluded at $228.40, followed by a pullback in wave ((ii)) that ended at $226.50. The subsequent advance in wave ((iii)) reached $238.19, with a brief dip in wave ((iv)) closing at $236.10. The final leg, wave ((v)), peaked at $241.22, completing wave 1 of a higher degree. A corrective wave 2 followed, concluding at $236.68, exhibiting an internal zigzag structure with segments ((a)), ((b)), and ((c)).
The stock has since resumed its upward trajectory in wave 3. From the wave 2 low, wave ((i)) advanced to $247.42, and a minor pullback in wave ((ii)) settled at $244.39. The rally in wave ((iii)) climbed to $256.64, followed by a dip in wave ((iv)) to $253.16. The final push in wave ((v)) reached $257.34, completing wave 3 of a larger degree. A corrective wave 4 appears to have concluded at $251.04, aligning with the 100%–161.8% Fibonacci extension of the zigzag structure. As long as the pivot at $236.68 holds, any near-term pullback should find support in a 3, 7, or 11 swing, setting the stage for further upside momentum in AAPL’s price action.
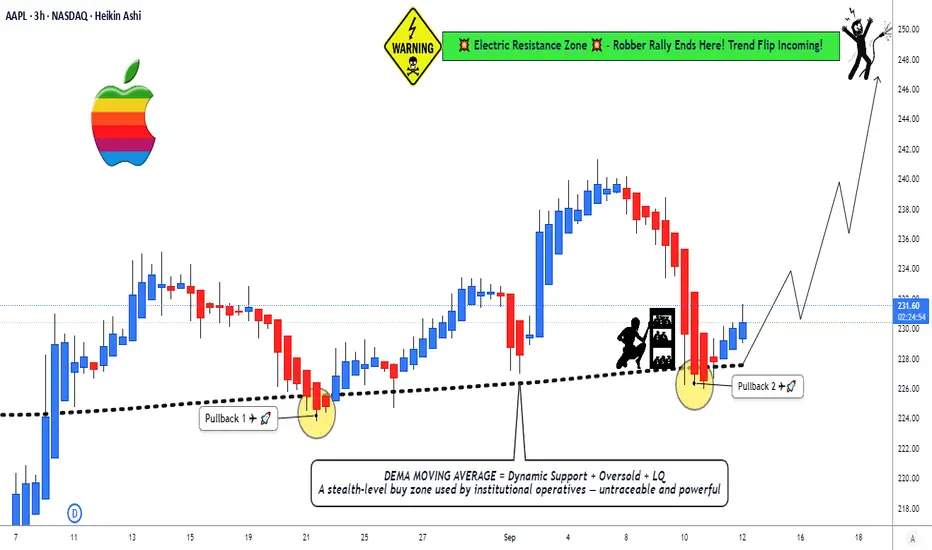
AAPL at Dynamic Support: Trade the Bounce!🍎 AAPL Swing/Day Trade: The Great Apple Heist Plan 🚨
Asset: AAPL (Apple Inc. Stock)
Market: US Stock
MarketVibe: Bullish, sneaky, and ready to loot some profits! 💰
📜 The Master Plan: Bullish EMA Pullback Heist
🎯 Strategy: We're pulling off a slick Double Exponential Moving Average (DEMA) pullback plan, targeting a breakout at dynamic support levels. Think of it as a high-stakes caper where we sneak in, grab the profits, and escape before the market knows what hit it! 😎
🔑 Key Setup Details:
Chart Setup: AAPL is showing a bullish setup with a DEMA pullback, signaling a potential swing or day trade opportunity.
Dynamic Line: We’re eyeing the DEMA as our guiding star 🌟 for entries and exits.
🚪 Entry: The Sneaky Thief Layering Strategy
🔍 How to Enter: Deploy the Thief Layering Strategy with multiple buy limit orders to maximize your entry precision:
🤑 Buy Limit Layers: Place orders at $227, $228, $229, $230 (or add more layers based on your risk appetite — you’re the mastermind here!).
💡 Pro Tip: Feel free to adjust entry levels to suit your style. The market’s your playground, so pick your spot!
🛑 Stop Loss: Protect Your Loot!
⚠️ Thief SL: Set your stop loss at $224 post-breakout to guard your stash.
Note: Dear Ladies & Gentlemen (Thief OGs 🕵️♂️), this SL is a suggestion. Adjust it based on your strategy and risk tolerance. You’re in charge of your heist, so protect your loot your way!
🎯 Target: Hit the Jackpot & Escape!
💥 Profit Target: Aim for $248, where a high-voltage resistance wall ⚡️ awaits, potentially paired with overbought conditions and a sneaky trap. Grab your profits and vanish before the market catches on!
Note: Dear Thief OGs, this target is a suggestion. Set your TP based on your goals and risk management. Take the money and run at your own discretion! 😏
👀 Related Pairs to Watch (Correlations & Opportunities)
To boost your heist, keep an eye on these correlated assets:
NASDAQ:MSFT (Microsoft): Tech giant with similar market moves to AAPL. If AAPL’s bullish, MSFT might follow suit. Watch for parallel DEMA pullbacks.
NASDAQ:QQQ (Invesco QQQ ETF): Tracks the Nasdaq-100, where AAPL is a heavy hitter. QQQ’s trend can confirm AAPL’s bullish momentum.
AMEX:SPY (SPDR S&P 500 ETF): Broad market index. If SPY’s trending up, it supports AAPL’s bullish case.
Key Correlation Insight: AAPL often moves in tandem with tech-heavy indices like QQQ. A bullish QQQ or MSFT can reinforce confidence in this trade setup.
⚡ Why This Setup Rock
Bullish Momentum: DEMA pullback signals a strong continuation pattern.
Layered Entries: Multiple limit orders reduce risk and increase flexibility.
Clear Risk Management: Defined SL and TP keep your heist disciplined.
Market Context: Tech sector strength (check QQQ/MSFT) supports AAPL’s upward move.
⚠️ Risk Disclaimer
Dear Thief OGs, this is not financial advice. The market’s a wild place, and you’re the master of your trades. Set your SL and TP based on your own risk tolerance and strategy. Steal profits wisely! 😎
✨ “If you find value in my analysis, a 👍 and 🚀 boost is much appreciated — it helps me share more setups with the community!”
#Hashtags: #AAPL #SwingTrading #DayTrading #StockMarket #ThiefStrategy #TechnicalAnalysis #Bullish #TradingView
Could be a good month for Apple. Apple has potentially broken out of a recent flag pattern. While I typically don't use hourly charts, in this case, it does present the situation more clearly. The next target price will be 260 USD, although I plan to continue holding my long position until it reaches over $270. Since the predicted Golden Cross, Apple has been very bullish. With increased trading activity.
Forming lack of market confidence in AI market overall and its associated potential bubble, Apple remains a well-rounded stock to hold. We could see further rewards, especially since they have not yet heavily invested in the AI market and are not as reliant on its future revenue and value. So could be bubble protected to some extent, if it pops.
With September approaching and the "sell in May and walk away" period coming to an end, I expect trading volumes to increase and a rebalancing of portfolios, with capital likely flowing back into Apple. Additionally, Apple has its September launch event coming up, and expectations are high. Overall, Apple looks promising for potential returns in September. Although Q3 numbers could be bearish given the current market climate, Apple appears more stable and less bubble-like than other stocks in the Magnificent Seven...
As previous too much fear regarding Apple for the last few quarters. Which presented some really good entry points and good returns.
