DAX BEARISHthe long term vision on dax is bearish as it's shown in the higher time frame , the movement is still consolidating but the overall sentiment it's bearish let's wait for a proper entry
Trade ideas

DAX/GER - LET RIDE THE WAVE AGAINTeam, yesterday we got both targets 1 and 2 hit,
Now we are entering at 23690 and buying more at 23650 - with stop loss at 23580
Once it breaks above 23710, bring the stop loss to BE
Target 1 at 23735-65
Target 2 at 23810-45
LETS GO - LETS MAKE DAX GREAT AGAIN

Is Germany's Economic Success Just an Illusion?Germany's benchmark DAX 40 index surged 30% over the past year, creating an impression of robust economic health. However, this performance masks a troubling reality: the index represents globally diversified multinationals whose revenues originate largely outside Germany's struggling domestic market. Behind the DAX's resilience lies fundamental decay. GDP fell 0.3% in Q2 2025, industrial output reached its lowest level since May 2020, and manufacturing declined 4.8% year-over-year. The energy-intensive sector suffered even steeper contraction at 7.5%, revealing that high input costs have become a structural, long-term threat rather than a temporary challenge.
The automotive sector exemplifies Germany's deeper crisis. Once-dominant manufacturers are losing ground in the electric vehicle transition, with their European market share in China plummeting from 24% in 2020 to just 15% in 2024. Despite leading global R&D spending at €58.4 billion in 2023, German automakers remain trapped at Level 2+ autonomy while competitors pursue full self-driving solutions. This technological lag stems from stringent regulations, complex approval processes, and critical dependencies on Chinese rare earth materials, which could trigger €45-75 billion in losses and jeopardize 1.2 million jobs.
Germany's structural rigidities compound these challenges. Federal fragmentation across 16 states paralyzes digitalization efforts, with the country ranking below the EU average in digital infrastructure despite ambitious sovereignty initiatives. The nation serves as Europe's fiscal anchor, contributing €18 billion net to the EU budget in 2024, yet this burden constrains domestic investment capacity. Meanwhile, demographic pressures persist, though immigration has stabilized the workforce; highly skilled migrants disproportionately consider leaving, threatening to transform a demographic solution into brain drain. Without radical reform to streamline bureaucracy, pivot R&D toward disruptive technologies, and retain top talent, the disconnect between the DAX and Germany's foundational economy will only widen.

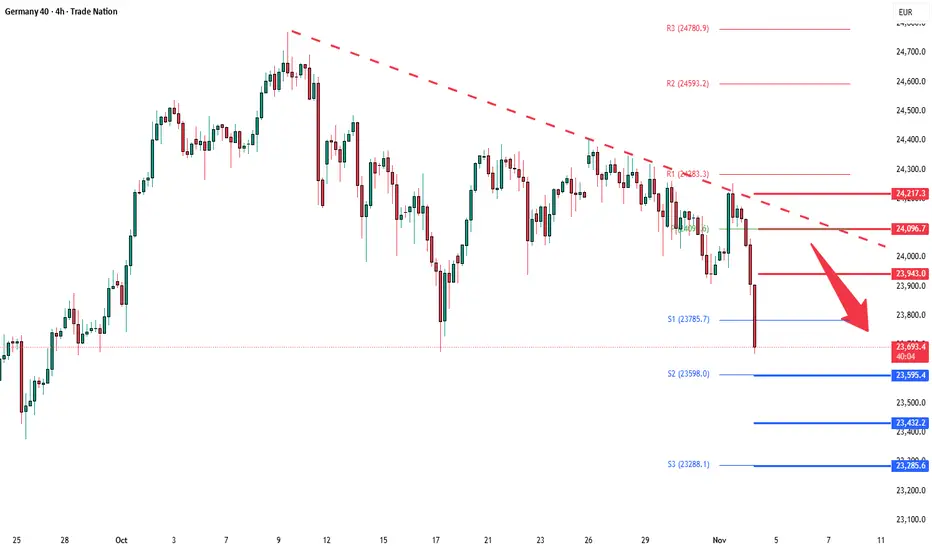
DAX40 corrective pullback capped at 23940 resistance The DAX is currently trading with a bearish bias, aligned with the broader downward trend. Recent price action shows a retest of the falling resistance, suggesting a temporary relief rally within the downtrend.
Key resistance is located at 23940, a prior consolidation zone. This level will be critical in determining the next directional move.
A bearish rejection from 23940 could confirm the resumption of the downtrend, targeting the next support levels at 23600, followed by 23430 and 23285 over a longer timeframe.
Conversely, a decisive breakout and daily close above 23940 would invalidate the current bearish setup, shifting sentiment to bullish and potentially triggering a move towards 24095, then 24217.
Conclusion:
The short-term outlook remains bearish unless the price breaks and holds above 23940. Traders should watch for price action signals around this key level to confirm direction. A rejection favours fresh downside continuation, while a breakout signals a potential trend reversal or deeper correction.
This communication is for informational purposes only and should not be viewed as any form of recommendation as to a particular course of action or as investment advice. It is not intended as an offer or solicitation for the purchase or sale of any financial instrument or as an official confirmation of any transaction. Opinions, estimates and assumptions expressed herein are made as of the date of this communication and are subject to change without notice. This communication has been prepared based upon information, including market prices, data and other information, believed to be reliable; however, Trade Nation does not warrant its completeness or accuracy. All market prices and market data contained in or attached to this communication are indicative and subject to change without notice.
GER/DAX30 - ARE YOU READYTeam, market is heavily sold off today
But it will recover during US Market opening
I find a good opportunity to go long DAX at 23720-35 - NOTE: it may drop low at 23700
STOP LOSS consider at 23650
Once the market hit above 23780 range bring STOP LOSS TO BREAK EVEN
Target 1 at 23785-23815 - take partial only 30%
Target 2 at 23845-85 - take another 30%
Target 3 at 23915-24015
LETS GO

Technical Analysis WeeklyGermany 40 is still stuck in a neutral range phase. Price is at 24,159, close to the VWAP of 24,150. The RSI at 50.3 suggests a totally neutral bias. Support is at 23,878, and resistance is at 24,427.
UK 100 continues in a strong bullish impulsive trend, trading at 9,732 above its VWAP of 9,532. Momentum remains strong with an RSI of 69.3, nearing overbought territory. Support is seen at 9,234 and resistance at 9,829.
Wall Street maintains its bullish trend and is still in an impulsive phase, trading at 47,643 and comfortably above the VWAP of 46,711. The RSI at 68.0 reflects strong upside pressure. Support lies at 45,359, with resistance at 48,063.
Brent Crude is still bearish overall, though it has entered a correction phase- and could be staging a trend reversal. Price is at 6,461, hovering above the VWAP of 6,333. RSI at 51.5 indicates a neutral stance. Support is found at 6,000, while resistance caps at 6,667.
Gold’s bullish trend has paused into a correction, now trading at 4,002, still below the VWAP of 4,104. The RSI of 49.1 reflects a cooling momentum. Support is at 3,861, with resistance at 4,104.
EUR/USD has broken down into a 3-month low but remains in an overall neutral trend, trading at 1.1515 and under its VWAP of 1.1614. The RSI at 33.1 hints at building downside momentum. Support is found at 1.1500, with resistance at 1.1710.
GBP/USD has weakened to test the bottom of its multi-month range setting up possible breakdown into a new bearish trend, currently at 1.3127 and beneath the VWAP of 1.3309. The RSI at 30.4 signals oversold conditions. Support is at 1.3106, with resistance at 1.3513.
USD/JPY continues its bullish impulsive trend, now trading at 154.13, above the VWAP of 152.19. The RSI at 66.3 shows strong upward pressure. Support lies at 149.74, with resistance at 154.64.

DAX, after tomorrow interest cuts we could open new long positiduring tomorrow we could see lots of volotility on the market and market manipulation,
-if the rates will be cutted than it should be a good long opportunity on DAX, and in generally on all the indices
-also US dollar dominance against other currencies, It's important to be very carefull that market will try to manipulate
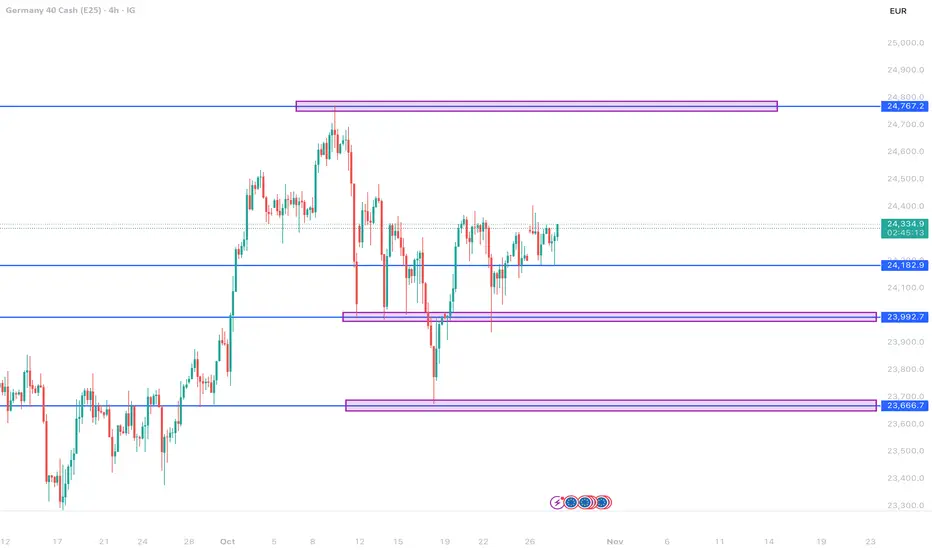

GER30 H4 | Bullish Reversal from Overlap Support LevelBased on the H4 chart analysis, we could see the price fall to the buy entry which is an overlap support and could bounce from this level to the upside.
Buy entry is at 23,885.59, which is an overlap support.
Stop loss is at 23,661.20, whic is a pullback support that is slightly above the 100% Fibonacci projection.
Take profit is at 24,383.02, which is an overlap resistance.
Stratos Markets Limited (tradu.com ):
CFDs are complex instruments and come with a high risk of losing money rapidly due to leverage. 68% of retail investor accounts lose money when trading CFDs with this provider. You should consider whether you understand how CFDs work and whether you can afford to take the high risk of losing your money.
Stratos Europe Ltd (tradu.com ):
CFDs are complex instruments and come with a high risk of losing money rapidly due to leverage. 70% of retail investor accounts lose money when trading CFDs with this provider. You should consider whether you understand how CFDs work and whether you can afford to take the high risk of losing your money.

DAX weekly pivot map for 3 to 7 November 2025Why this matters
Next week is a sequence market. Final PMIs set tone. Germany prints factory orders and industrial production. The week closes with the U.S. jobs report. That mix often compresses ranges around fair value until something cracks. So the plan is one grid, two scenarios, three rules.
Chart to publish
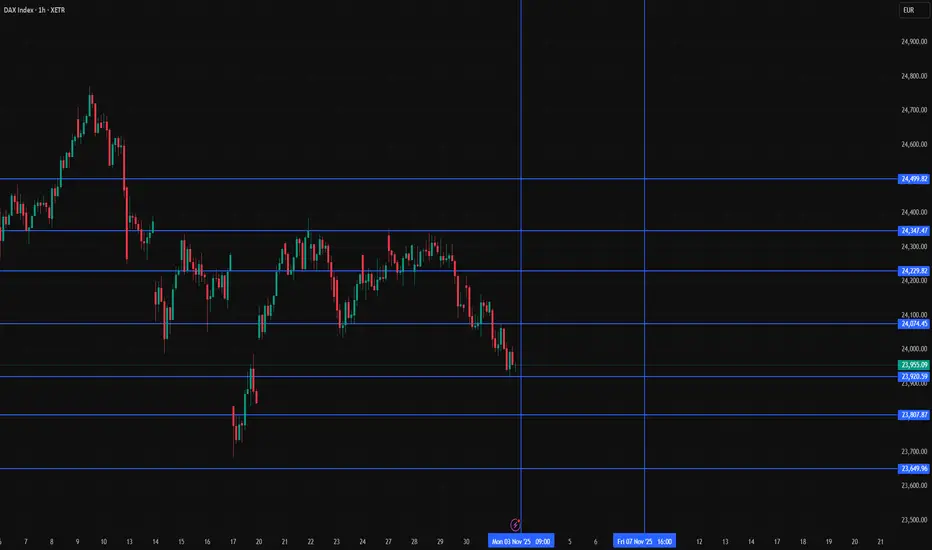
Timeframe 1H on GER40. Add a single grid from last week Xetra cash.
High 24 348.59. Low 23 922.95. Close 23 958.30.
Pivot 24 076.61. R1 24 230.28. R2 24 502.25. R3 24 655.92.
S1 23 804.64. S2 23 650.97. S3 23 379.00.
Optional helpers. VWAP. Cumulative delta. No extra overlays. Keep it clean so the levels do the talking.
What I am watching on tape
How price behaves around the pivot during quiet periods. The first pass into R1 or S1 without a fresh release often mean reverts. If a surprise hits, the grid becomes a runway for extension. The job is not to predict. The job is to recognise when ranges are intact and when a genuine break is underway.
Catalysts and session notes
Germany releases often land near 08:00 CET. Factory orders midweek. Industrial production the day after. The U.S. Employment Situation prints Friday at 08:30 ET. That one moves global curves and the euro which feeds back into exporters. I do not hold risk through the print. I would rather enter the follow through once the first sweep finishes.
Levels that matter this week
Pivot 24 076 is the magnet. Above it the burden of proof is on sellers. Below it buyers need time to build. R1 24 230 is the first supply pocket. R2 24 502 lines up with prior supply. R3 24 656 sits just under the recent extremes. On the downside S1 23 805 is first support. S2 23 651 is where momentum sellers usually engage. S3 23 379 is the stress zone if the week turns heavy.
Two simple scenarios
Scenario A soft landing tone
PMIs steady. Orders stabilise. Production improves. Payrolls strong enough but wages calm. The tape accepts price above the pivot and north of R1. Tactics. Buy pullbacks into 24 080 to 24 120 with a hard stop under 23 980. First take-profit at R1. Trail into the 24 330 pocket. If R2 breaks on confirmation keep a runner toward 24 650 to 24 770 where supply stacked recently. The idea is to let the market pay you for being patient near the magnet then step aside if the grid stops working.
Scenario B growth scare tone
PMIs revise down. Orders miss. Production disappoints. Payrolls hot on wages. Sellers defend R1 and the euro wobbles. Tactics. Sell failed bounces close to 24 230 with a stop above 24 330. First target the pivot. Add only on a clean loss of 23 980. Manage into S2 and be pragmatic near S3 because volatility tends to spike there.
How to trade the grid
Entry
I anchor on 1H structure. I drill down to 15m for the trigger. I want acceptance around the level. That means a pause, a clean candle close, and a little confirmation from volume. Chasing the very first touch is optional and usually a worse price unless the day is a trend day.
Risk
Fixed R works. Use a small stop around the other side of the level. I like 0.5 R stops and 1.0 R first targets. On days with a data print I cut size in half or I skip the first twenty minutes. The easiest way to survive event weeks is to size for the noise and accept that some moves will run without you.
Adds and exits
Adds only after partials are banked. No martingale. I scale out at the next grid line or at VWAP if the run stalls. I do not marry a view. If the grid stops behaving I go flat and wait for the next high quality test.
Why this works
These weekly levels attract flow. Dealers manage hedges around them. When the tape is balanced the pivot acts like gravity. When the tape is imbalanced the break through R2 or S2 gives you a repeatable context to join the side that is pressing. You are not forecasting. You are responding with a simple structure.
Rules to pin on the chart
• Fade the first clean touch of R1 or S1 back to the pivot if no high impact release is due within the next hour.
• Trade breakouts only on a firm thirty minute close above R2 or below S2 with volume support and a positive delta profile.
• Stay flat into red events. Flat at least five minutes before the U.S. jobs report. Reassess after the first sweep.
Instrument
GER40 on the 1H chart. If you execute futures on Eurex or a CFD feed, tiny price differences do not change the grid. Rebuild the levels each weekend from the cash high low close so the numbers stay honest.
Mindset
The grid is a map. It tells you where to look. Your edge comes from taking the same trade the same way every time. Good process first. P and L follows.
Education only.
German DAX 30 Rally Ahead? Strong Pullback Signals Momentum💎 DE30 (German DAX 30) — Thief Trader’s Market Profit Playbook! 💎
📈 Bias: Bullish Play Confirmed
⚙️ Strategy Type: Layered Limit Order Entries (Thief’s Signature Style)
🧠 Game Plan:
The German DAX 30 (DE30) shows strong bullish momentum after a clean moving average pullback — confirming a short-term continuation setup on the 4H and daily charts.
We’re loading our Thief-style layering entries to ride this momentum wave! 🏄♂️
Layered Entry Zone (Buy Limits):
💰 23,800 | 23,900 | 24,000 | 24,100
(Add more layers if you’re managing dynamic scaling — this is the Thief style of playing smart, not hard!)
🛑 Stop Loss (Protective Zone):
🚨 23,700 (Thief’s guard line!)
⚠️ Note: Dear Ladies & Gentlemen (Thief OGs), this SL is not a must-follow — manage your risk wisely. This is an educational plan — trade at your own discretion.
🎯 Take Profit Zone:
🎯 24,500 — realistic first exit zone.
💥 24,700 — Electric Shock Resistance Wall ⚡️ (strong resistance area + overbought + potential trap zone).
⚠️ Note: Again, dear Thief OGs — take your profits when you’re happy! Targets are reference points, not financial advice.
🔍 Key Technical Highlights:
Strong MA Confluence: 20EMA and 50EMA crossover support the bullish bias.
Volume Uptick: Smart money rotation visible on hourly accumulation bars.
Momentum Recovery: RSI rebounding from mid-zone (40–50), eyeing bullish breakout potential.
🌐 Correlated Assets to Watch:
Stay sharp — DAX often dances with global indices and major USD flows:
CAPITALCOM:US30 (Dow Jones) — correlated risk sentiment, bullish tone confirmation.
FX:FRA40 (CAC 40) — follows European equity momentum.
💵 FX:EURUSD — inverse correlation with DE30 strength during USD volatility.
Tracking these helps confirm whether the bull party 🎉 continues or the market bouncer 🚫 shows up early.
✨ “If you find value in my analysis, a 👍 and 🚀 boost is much appreciated — it helps me share more setups with the community!”
#DE30 #DAX30 #ThiefTrader #IndexTrading #GermanDAX #BullishSetup #LayeredEntry #PriceAction #SmartMoney #TradingStrategy #MarketAnalysis #ThiefStyle #ForexCommunity #RiskManagement

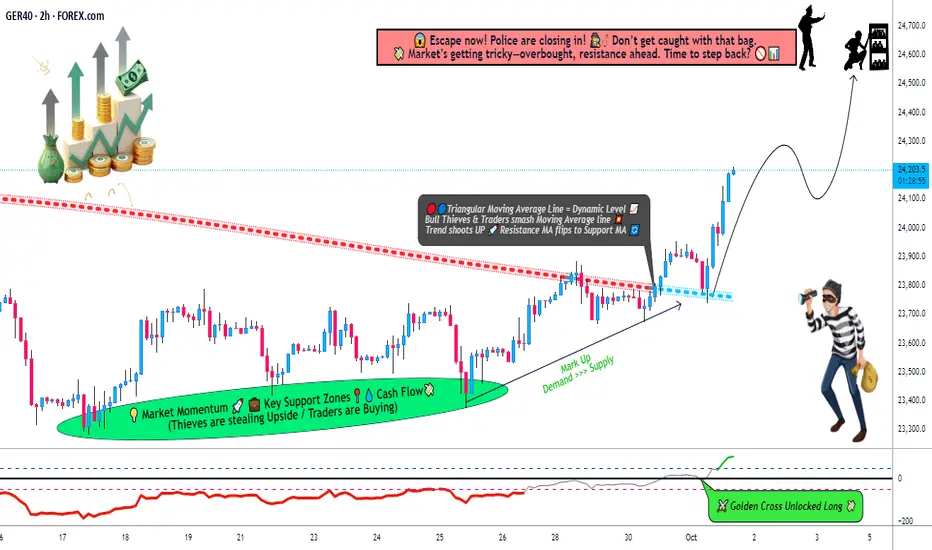
"DAX 40 Strategy Map — Multi-Layer Entries & Thief Twist"📊 GERMANY 40 Index Market Wealth Strategy Map (Swing/Day Trade)
Ladies & Gentlemen (aka Thief OG’s 😎), here’s my fresh DAX roadmap.
🔑 Plan (Bullish Bias):
Triangular Moving Average 382 broken upwards ✅
CCI Oscillator flashing a Golden Cross ⚡
Both signals together = bullish confirmation.
🎯 Entry (Thief Layer Strategy):
This is not a single-entry plan. Instead, I’m layering multiple buy-limit levels:
23800, 23900, 24000, 24100
(You can increase layers if market structure supports it.)
This layering method (Thief Strategy) spreads risk and improves average entry.
🛡️ Stop Loss (Thief Guardrail):
My SL marker: 23700
⚠️ Note: This is my personal map, not financial advice. You can adjust according to your own risk appetite.
💰 Target (Take Profit Zone):
Primary Exit: 24600
Strong barricade & resistance near 24700 🚨 (watch out for overbought trap).
Idea: escape with profits before the police (market sellers) block the road!
📌 Correlations & Watchlist:
FOREXCOM:GER40 (Germany 40 Index)
XETR:DAX (cash market ticker)
CAPITALCOM:DE40 (futures contracts)
ICMARKETS:STOXX50 (Euro Stoxx 50 correlation)
SP:SPX / NASDAQ:NDX (U.S indices often influence DAX intraday flow)
FX:EURUSD (currency correlation can impact European equities via euro strength/weakness)
Keeping an eye on global risk sentiment is essential — strong U.S. momentum often supports DAX upside.
✨ “If you find value in my analysis, a 👍 and 🚀 boost is much appreciated — it helps me share more setups with the community!”
📜 Disclaimer:
This is a Thief-style trading strategy — designed for fun, educational purposes, and market mapping only. This is not financial advice. Trade at your own risk.
#GER40 #DAX #Germany40 #SwingTrade #DayTrading #IndexTrading #TechnicalAnalysis #ThiefStrategy #TradingView
DAXHow to become successful in forex and stock trading:
1.Master fundamentals and technical analysis.
2.Build and follow a solid trading plan.
3.Apply strict risk management (4–6% rule).
4.Stay disciplined—control fear and greed.
5.Record and analyze every trade.
6.Focus on high-quality setups only.
7.Diversify across assets and markets.
8.Keep evolving—study, adapt, and grow daily.

GER40 at a Crossroads: Parabolic Breakout or Exhaustion Top? 🇩🇪 GER40 DAX INDEX | Premium Technical Analysis & Trading Blueprint | 23,967.9 🇩🇪
📊 INSTITUTIONAL MULTI-TIMEFRAME MASTERCLASS | NOVEMBER 3-7, 2025 FORECAST 📊
Current Level: 23,967.9 | Analysis Date: November 1, 2025, 00:54 UTC+4
Hey, TradingView fam! 👋 The German powerhouse, GER40, has put on a spectacular show, closing the week at a mighty 23,967.9 . After such a vertical ascent, traders are rightfully asking: Is this the start of a new parabolic phase, or are we witnessing a massive exhaustion top in the making? The upcoming week, from November 3rd to 7th, is poised to give us the answer.
Let's dissect the charts across multiple timeframes, combining timeless theories with key indicators to map out the strategic path forward for both intraday and swing traders. 🧭
╔═══════════════════════════════════════════════════════════════════╗
🎯 STRATEGIC MARKET INTELLIGENCE OVERVIEW
The German DAX Index commands attention at 23,967.9 , positioning at a pivotal technical crossroads that will define European equity direction through Q4 2025. Our sophisticated multi-dimensional analysis reveals cautious optimism with breakout potential as the index tests critical resistance near the psychological 24,000 barrier. This week's confluence of ECB policy implications, US election spillover, and technical setups creates exceptional risk-reward opportunities for prepared traders.
Institutional Support Architecture: 🛡️
Immediate Foundation: 23,900 - 23,920 (Algo bid zone)
Secondary Cushion: 23,850 - 23,870 (Volume-weighted support)
Critical Platform: 23,750 - 23,780 (Weekly pivot cluster)
Major Fortress: 23,650 - 23,680 (Psychological & structural)
Resistance Target Matrix: 🎯
First Hurdle: 24,000 - 24,020 (Psychological barrier)
Secondary Wall: 24,100 - 24,120 (Pattern objective)
Breakout Zone: 24,200 - 24,250 (Extension target)
Major Milestone: 24,350 - 24,400 (Monthly target)
╚═══════════════════════════════════════════════════════════════════╝
📈 WEEKLY TIMEFRAME (1W) - MACRO STRUCTURAL ANALYSIS
Elliott Wave Supercycle Mapping: 🌊
Currently navigating Wave 4 consolidation within larger Wave (5) of the supercycle advance. The shallow retracement (38.2% Fibonacci) suggests underlying strength with Wave 5 targeting 24,500-24,800 . Alternative count places us in Wave B of corrective ABC - monitor 23,650 for bearish confirmation.
Primary Scenario: Wave 4 complete, Wave 5 underway to 24,500+
Alternative: Wave B top forming, Wave C decline to 23,200
Invalidation Level: Weekly close below 23,500
Time Projection: Completion by mid-November
Wyckoff Distribution/Re-Accumulation: 📚
Critical Juncture - Phase B/C Transition
- Preliminary Supply (PSY): 24,100 tested
- Buying Climax (BC): 24,150 rejection
- Automatic Reaction (AR): 23,750 held
- Secondary Test (ST): Current 23,967
- Upthrust pending: Above 24,000
Ichimoku Cloud European Perspective: ☁️
Tenkan-sen: 23,885 (9-period support)
Kijun-sen: 23,820 (26-period base)
Senkou Span A: 23,950 (cloud resistance)
Senkou Span B: 23,780 (cloud support)
Chikou Span: Neutral (at price level)
Cloud Status: Thin, potential twist ahead
Advanced Harmonic Configuration: 🦋
Emerging Bullish Shark pattern with precision measurements:
- 0 Point: 23,450 (October low)
- X Point: 24,150 (October high)
- A Point: 23,650 (retracement low)
- B Point: 23,967 (current - 0.618 XA)
- C Target: 23,750 (1.13 AB extension)
- D Completion: 24,350 (0.886 XC)
Gann Master Analysis: 📐
Price respecting 3x1 Gann angle from September base. Critical Gann levels:
- Current angle support: 23,920
- 45-degree resistance: 24,050
- Square of 9 target: 24,144
- Time cycle: November 6 (+/- 1 day)
╔═══════════════════════════════════════════════════════════════════╗
📊 DAILY TIMEFRAME (1D) - SWING TRADING COMMAND
Japanese Candlestick Intelligence: 🕯️
Yesterday's Hanging Man at resistance warns of potential reversal. Critical observation for today:
- Close above 24,000 = Bullish Engulfing invalidates reversal
- Close below 23,900 = Bearish Confirmation
- Doji formation = Continued indecision
Master Pattern Recognition:
Ascending Triangle approaching apex:
- Horizontal resistance: 24,000-24,020
- Rising support: Currently at 23,880
- Breakout target: 24,320 (320-point measured move)
- Volume requirement: 30% above 20-day average
- False breakout risk: High due to round number
Bollinger Bands Configuration: 📈
Upper Band: 24,015 (kissing price)
Middle Band (20-SMA): 23,870 (dynamic support)
Lower Band: 23,725 (oversold boundary)
Band Width: Contracting (squeeze alert)
%B Reading: 0.89 (upper band test)
RSI Momentum Analysis:
Daily RSI: 64 (approaching overbought)
Bearish divergence forming vs price highs
Support trend line: 55 level
Resistance: 70 level (6 points away)
Volume Profile Insights: 📊
- High Volume Node: 23,850-23,900
- Point of Control: 23,875
- Value Area High: 23,950
- Value Area Low: 23,800
- Low Volume Gap: 24,020-24,080 (breakout zone)
╚═══════════════════════════════════════════════════════════════════╝
⚡ 4-HOUR TIMEFRAME (4H) - TACTICAL FRAMEWORK
Dow Theory Application: ✅
Primary Trend: Bullish (higher highs maintained)
Secondary Trend: Consolidation/Distribution question
Minor Trend: Testing resistance
Volume Pattern: Declining on rallies (caution)
Confirmation needed: Break above 24,020
DAX/STOXX correlation: Diverging (warning)
Moving Average Configuration:
EMA 8: 23,945 (micro support)
EMA 21: 23,915 (short-term support)
EMA 50: 23,880 (medium support)
SMA 100: 23,825 (strong support)
SMA 200: 23,750 (major trend support)
Golden Cross: EMA 50 above SMA 100 ✅
Chart Pattern Alert: 🚨
Rising Wedge formation - bearish implications:
- Upper trendline: 23,980-24,000
- Lower trendline: 23,850-23,870
- Breakdown target: 23,700
- Invalidation: Close above 24,020
╔═══════════════════════════════════════════════════════════════════╗
🎪 1-HOUR TIMEFRAME (1H) - PRECISION ENTRY MATRIX
Micro Pattern Development: 🔬
Triple Top formation at 23,980:
- First top: 23,975 (Monday)
- Second top: 23,982 (Wednesday)
- Third top: 23,978 (Friday)
- Neckline support: 23,920
- Breakdown target: 23,860
VWAP Trading Framework:
Daily VWAP: 23,952
Weekly VWAP: 23,895
Monthly VWAP: 23,810
Upper Band 1: 23,985 (resistance)
Upper Band 2: 24,018 (strong resistance)
Lower Band 1: 23,919 (support)
Lower Band 2: 23,886 (strong support)
Support & Resistance Precision:
R4: 24,050 (Major resistance)
R3: 24,020 (Round number)
R2: 23,990 (Pattern resistance)
R1: 23,975 (Immediate ceiling)
PIVOT: 23,967.9 (Current)
S1: 23,950 (Micro support)
S2: 23,920 (Neckline)
S3: 23,890 (Strong support)
╚═══════════════════════════════════════════════════════════════════╝
⚡ 30-MINUTE SCALPING LABORATORY (30M)
Microstructure Dynamics: 🎯
Range-bound channel :
- Upper boundary: 23,975-23,985
- Middle pivot: 23,950-23,955
- Lower boundary: 23,925-23,935
- Breakout pending: 70% probability upward
European Session Dynamics: 🕐
Frankfurt Open (08:00 CET):
- Average range: 40-50 points
- Directional bias: First 30 minutes
London Overlap (09:00 GMT):
- Volatility spike: 60-80 points
- Best scalping window
US Premarket Impact (13:30 CET):
- Range expansion: 80-100 points
Scalping Execution Zones:
Buy Zones:
• Zone A: 23,945-23,950 (VWAP test)
• Zone B: 23,925-23,930 (Channel bottom)
• Zone C: 23,900-23,905 (Strong bid)
Sell Zones:
• Zone A: 23,975-23,980 (Triple top)
• Zone B: 23,990-23,995 (Resistance cluster)
• Zone C: 24,010-24,015 (Major resistance)
╔═══════════════════════════════════════════════════════════════════╗
🏃 15-MINUTE & 5-MINUTE ULTRA-SCALPING
15-Minute Momentum Setup: ⚡
Bull Flag micro pattern:
- Pole: 23,920 to 23,970 (50 points)
- Flag: 23,955-23,965 consolidation
- Breakout trigger: 23,968
- Quick target: 24,000 (+32 points)
- Stop: 23,950 (-18 points)
5-Minute Algorithm Signals:
Long Conditions:
RSI(5) oversold (<25) + VWAP bounce = BUY
MACD bullish cross + Volume spike = BUY
EMA(8) > EMA(21) + Pullback = BUY
Short Conditions:
RSI(5) overbought (>75) + Resistance = SELL
MACD bearish cross + High volume = SELL
Failed breakout at 24,000 = SELL
Management:
TP: 15-20 points | SL: 10-12 points
Max hold: 10 minutes | Trail: 8 points
╚═══════════════════════════════════════════════════════════════════╝
📅 WEEKLY STRATEGIC PLAYBOOK (NOVEMBER 3-7, 2025)
Monday, November 3: 🚀
Gap-up potential to 24,000 test
Strategy: Sell resistance, buy 23,920 dips
Key levels: 23,920 support, 24,000 resistance
Expected range: 80 points
Tuesday, November 4: 🗳️
US Election volatility spillover to DAX
Strategy: Wide stops, reduced size
Potential range: 23,750-24,100 (350 points!)
Correlation with US futures critical
Wednesday, November 5: 💥
Post-election directional resolution
Strategy: Trade breakout with conviction
Bullish above 24,050 → Target 24,200
Bearish below 23,850 → Target 23,700
Thursday, November 6: 📊
ECB officials speaking + German data
Strategy: Fade initial moves
Expected consolidation: 23,900-24,000
Focus on European session
Friday, November 7: 🎯
Weekly close crucial for next week's bias
Strategy: Position for weekly close
Above 24,000 = Bullish continuation
Below 23,900 = Bearish reversal
╔═══════════════════════════════════════════════════════════════════╗
⚖️ PROFESSIONAL RISK MANAGEMENT SYSTEM
Intraday Risk Parameters: 🛡️
Position size: 0.5-1% account risk
Risk-Reward: Minimum 1:2, target 1:3
Daily stop: -2% maximum loss
Consecutive losses: 3 max, then pause
Profit protection: Trail at 60% gain
Breakeven: Move stop at +15 points
Correlation monitor: Watch US futures
Swing Position Framework: 💼
Core position: 40% at 23,900-23,920
Scale-in: 30% at 23,850, 30% at 23,800
Stop loss: Below 23,750 (all positions)
Target 1: 24,050 (25% exit)
Target 2: 24,150 (35% exit)
Target 3: 24,250 (25% exit)
Runner: 24,350+ (15% hold)
╚═══════════════════════════════════════════════════════════════════╝
🔴 RISK SCENARIOS & CONTINGENCIES
Bearish Triggers: 🐻
30-min close below 23,950 = Micro caution
Hourly close below 23,920 = Intraday bearish
4H close below 23,880 = Swing bearish
Daily close below 23,800 = Trend concern
Weekly close below 23,650 = Major reversal
European Risk Factors: 🦢
• ECB policy surprises (100+ point moves)
• German economic data shocks
• EU political developments
• Energy crisis escalation
• Banking sector concerns
╔═══════════════════════════════════════════════════════════════════╗
💎 ELITE CONFLUENCE TRADING ZONES
Optimal Buy Zone: ✅
23,880-23,920
(Multi-timeframe support + Fibonacci 61.8% + VWAP + Moving averages)
Premium Sell Zone: ❌
23,990-24,020
(Triple top + Round number + Bollinger Band + Wedge resistance)
Breakout Trigger: 🚀
24,020-24,050
(Pattern completion + Resistance break + Volume confirmation)
╚═══════════════════════════════════════════════════════════════════╝
🏆 MASTER TRADER'S VERDICT
The DAX at 23,967.9 stands at a critical inflection point with the psychological 24,000 level acting as the decisive battleground. Technical indicators suggest cautious bullish bias but with increasing distribution signals. The week ahead demands disciplined execution and nimble position management.
Top 3 High-Probability Setups: 🎯
Range Trade: Buy 23,900, Sell 23,980 (Multiple touches)
Breakout Long: Above 24,020 → Target 24,150 (Clear skies)
Reversal Short: Triple top failure at 23,980 → Target 23,850
Trading Wisdom: 🧠
The DAX rewards patience at extremes. Trade the range until proven otherwise. Respect the 24,000 psychological level.
"The European markets dance to their own rhythm - master the tempo, profit from the moves!" 💶
╔═══════════════════════════════════════════════════════════════════╗
📍 ACTIONABLE INTELLIGENCE BRIEFING
Range-bound action between 23,850-24,020 until catalyst emerges. US election spillover likely to provide directional resolution. Accumulate dips toward 23,900 for upside potential to 24,200+.
Trade European hours. Respect correlations. Profit consistently. 💰
╚═══════════════════════════════════════════════════════════════════╝
#DAX #GER40 #DAX40 #TechnicalAnalysis #Trading #EuropeanMarkets #Indices #DayTrading #SwingTrading #ElliottWave #Wyckoff #HarmonicPatterns #ECB #Frankfurt #GermanStocks #STOXX #EuropeTrading #TradingView #MarketAnalysis #Forex #MarketForecast
🔔 Follow for Premium European Market Analysis | Präzision • Disziplin • Profit 📊
Risk Notice: Trading carries significant risk of loss. This analysis is educational only. Past performance does not predict future results. Conduct your own research and apply proper risk management.


GER40 / LONG / 31.10.25⬆️ BUY GER40, 31.10.25
💰 Entry: 23979.5
🎯 Target: 24406.5
⛔️ Stop: 23811.5
Reasons entry:
— Context: trade range 1d
— Entry model: ILM
* Liquidity Capture
* Inverse Bearish Imbalance
* V-Shaped Reversal
* Discount Zone

Bearish Momentum Building on GER40 – Continuation or Trap?🦹♂️ GERMANY 40 (GER40) — Smart Money Flow Blueprint 💰 | Bearish Swing Setup
🧭 Market Context
Hey Thief OGs & market heroes 🧙♂️,
Welcome to another precision strike setup on the 🇩🇪 GERMANY 40 Index (GER40).
The price action has triggered a Triangular Moving Average (382) breakdown —
confirming a bearish money-flow shift below dynamic support.
Let’s decode the play 👇
📉 Trade Blueprint (Swing Trade Plan)
🧩 Structure: Bearish bias confirmed ✅
⚡ Trigger: TMA-382 breakout below dynamic support
🎯 Strategy: Layered Sell Limit Entries (Thief-style entry stacking)
💸 Entry Layers:
🧱 24 100 • 💀 24 050 • 🎯 24 000
(You can add more layers based on your own risk appetite)
🛑 Stop-Loss: 🔐 Thief’s SL @ 24 250
🎯 Take-Profit Target: 💰 23 700 → dynamic support + oversold trap zone
💡 Thief Strategy Notes
“Layer it like a pro, exit like a ghost 👻”
• Multiple sell-limit layers help you catch volatility with precision ⚙️
• TMA serves as a dynamic moving structure – not a static line.
• Breakdown of support = momentum shift confirmed 🔻
• Clear risk/reward logic – structured SL & TP = disciplined flow 🎯
• Bearish bias remains intact while price holds under 24 100
🔍 Correlation Radar & Related Pairs to Watch
Stay alert to cross-market clues 🧠
🔗 Correlation Asset Key Observation
🇺🇸 US30 (Dow Jones) Often mirrors GER40 momentum — if Dow dips, GER40 tends to follow.
🇬🇧 FTSE100 European equity sentiment confirmation — weakness = bearish confidence boost.
💶 EUR/USD Strong Euro = export pressure → GER40 downside bias continuation.
🧠 Why This Setup Makes Sense
• TMA 382 breakout = momentum confirmation 📉
• Dynamic support break = structure shift 🔄
• Layered entries = better average fill 🔂
• SL = clear risk • TP = logical oversold zone 🎯
• Cross-asset watchlist keeps you aligned with global money flow 🌍
⚠️ Risk & Personal Choice
Dear Ladies & Gentlemen (Thief OGs) —
I’m not recommending you copy my stop-loss or take-profit.
They’re purely my levels for analysis reference only.
Trade responsibly. You make the call, you take the bag or the gold 💼✨
🧾 Quick Recap
🦹♂️ Strategy: Multi-Sell-Limit Layering
📉 Bias: Bearish below 24 100
💣 Entries: 24 100 • 24 050 • 24 000
🛑 Stop: 24 250
🎯 Target: 23 700
🧭 Setup Type: TMA Breakout + Dynamic Support Breakdown
🌍 Correlation Focus: US30 • FTSE100 • EUR/USD
✨ “If you find value in my analysis, a 👍 and 🚀 boost is much appreciated — it helps me share more setups with the community!”
#GER40 #Germany40 #DAX #Indices #BearishSetup #SwingTrade #SmartMoney #LayeringStrategy #ThiefTrader #MarketFlow #TMA #PriceAction #TechnicalAnalysis #TradingView #ChartSetup #RiskManagement

Buy Dax at supportRisking 100 points in DAX for a 250 points swing up over the weekend.Buying at support in what looks like a range bound market.
DAX sideways consolidation ahead of ECB rate decision. The DAX remains in a bullish trend, with recent price action indicating a potential overbought pullback within the broader uptrend.
Support Zone: 23970 – a key level from previous consolidation. Price is currently testing or approaching this level.
A bullish rebound from 23970 would confirm ongoing upside momentum, with potential targets at:
24490 – initial resistance
24580 – psychological and structural level
24770 – extended resistance on the longer-term chart
Bearish Scenario:
A confirmed break and daily close below 23970 would weaken the bullish outlook and suggest deeper downside risk toward:
23870 – minor support
23770 – stronger support and potential demand zone
Outlook:
Bullish bias remains intact while the Dax40 holds above 23970. A sustained break below this level could shift momentum to the downside in the short term.
This communication is for informational purposes only and should not be viewed as any form of recommendation as to a particular course of action or as investment advice. It is not intended as an offer or solicitation for the purchase or sale of any financial instrument or as an official confirmation of any transaction. Opinions, estimates and assumptions expressed herein are made as of the date of this communication and are subject to change without notice. This communication has been prepared based upon information, including market prices, data and other information, believed to be reliable; however, Trade Nation does not warrant its completeness or accuracy. All market prices and market data contained in or attached to this communication are indicative and subject to change without notice.

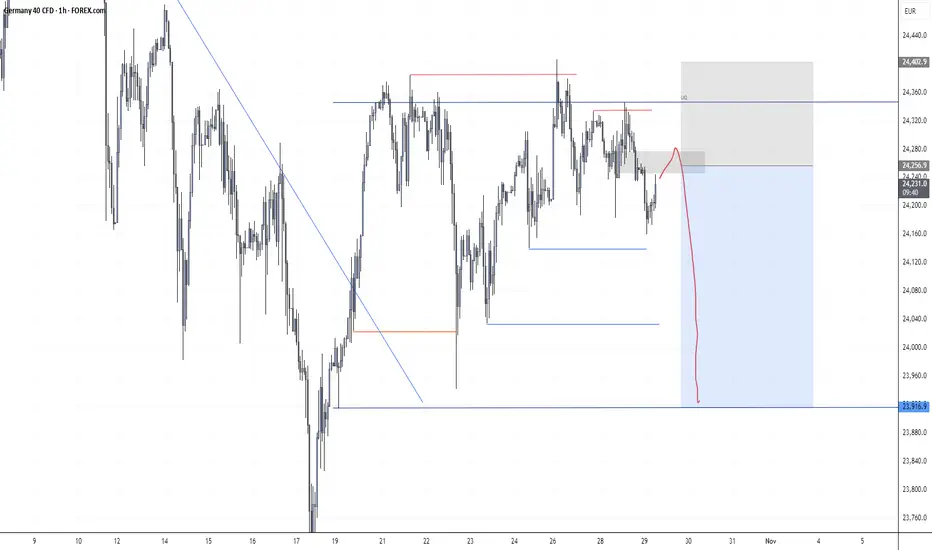
GER40(DAX)-1H SHORT Setup/RiskyChartLiquidity Grab: The recent sweep above internal liquidity failed to continue higher, indicating buy-side exhaustion.
Bearish Rejection Zone: The marked gray area aligns with a previous imbalance and premium zone, ideal for short entries.
Target Zones:
1. First Target: 24,000 – intraday demand zone.
1. Final Target: 23,920 – previous weekly low / external liquidity pool.
Invalidation: A clean 1H candle close above 24,360 (LQ) would invalidate this bearish setup.
Is this the NEXT big leg up for DAX? It seems like there is stabilisation around in Europe with the markets.
While America is making a mess with its peace with many countries (including Canada).
We are seeing the EURO fly which means there is a safe haven among the CAC, DAX, IBEX and EURSTOXXX...
The charts are looking great for upside, and we might have some optimism around Europe in the next month.
Here are the technicals.
W Formation
Price>20 and 200
Target 25,113
Disclosure: I am part of Trade Nation's Influencer program and receive a monthly fee for using their TradingView charts in my analysis.

Bull runWe are looking at taking out the Highs of the HTF this is a long term trade idea as we can see the US INDICES at their all-time highs this what is expected from this pair as well.

Pullback tradeThe price has bounced off last week's support area with an engulfing bullish candle, showing that the market is still bullish, this provides an entry opportunity after a sharp pullback
WE ONLY TRADE PULLBACKS
Comment your thoughts
