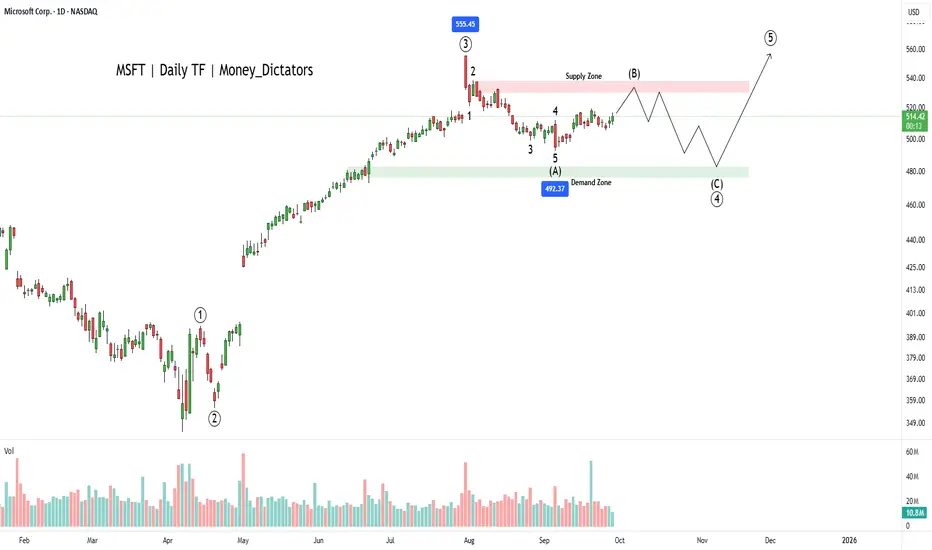
Why MSFT Could Be a Smart Pick in 2025?MSFT has bullish signals from the multiple moving averages, RSI and volume analysis. However, wave principle asks evidence from the buyers. The wave count suggests that the corrective wave (B) is ongoing, and bears will control the final wave of the primary wave 3.
Wave C will start falling nearby the supply zone and high of the 2nd wave of wave intermediate wave A. Wave C can fall up to 476 which will be the strength for wave primary wave 5. As per the chart, breakout above 540 will be a good signal for bulls to take charge back.
Zones:
Supply zone: 538 - 528
Demand zone: 482 - 476
I will update the chart and details shortly.
MSF trade ideas
How to study a stock chart for earnings season.Earnings Season 3rd Quarter 2025 starts October 13. Getting reading for earnings seasons is a critical part of being successful trading stocks or investing in stocks. Rather than chasing an HFT gap up or a "good news earnings report" you can learn to study and read the chart and have a good indication of what that report is going to show for that company.
MSFT is in a platform trend which is a narrow trend sideways that has consistent highs and lows. If price moves above or below the Buy Zone, then the price quickly moves back into that range of price as Dark Pool accumulation TWAP orders pause when the stock is above its fundamentals. When it drops below the fundamental levels then the Dark Pool TWAP orders trigger and move the stock slightly upward back into the platform range of price.
There are also professional independent traders in the mix. Some are individual professional traders working from their home office and Trading as a Business. Others are small Trading companies that cater to the Buy Side Institutions and provide trading of stocks on behalf of the Dark Pool corporation. Both are growing in numbers. These are the professionals you should b trading with.
Unfortunately, most times retail day and swing traders are chasing Small Funds Managers who do not typically use technical analysis. VWAP orders trigger more and more orders as volume increases. This causes panic selling or speculative buying. It also alerts the professionals who trade against the smaller funds managers.
Earnings Season is an important time to be ready to trade. a Platform trend is more profitable than most other trading styles, takes far less work and time, and nets higher income due to the longer hold time.

MSFT / MICROSOFT / Fractal and Seasonality inspiredHere is my view on MSFT from seasonal and fractal point of view.
Price gonna break the recent 516 high, shall turn and break recent 505 low than head upside for end of the year ralley.
i put 2 Longs into the chart. Smaller for first partial take profit and the larger one for rest.
All this should play out until 15th of November or latest until End of January.
After January 2026 downside. Be careful!
(This is not a trade call, just educational analysis, trade at your own risk)
Feel free to comment so we can learn and improve together!
Cheers!
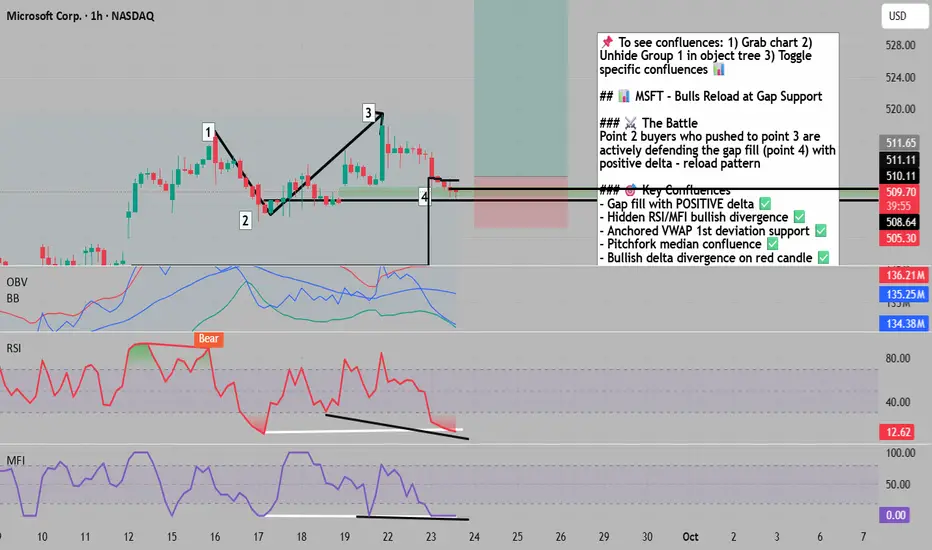
Bulls Reload at Gap Support - Spring Loads for Breakout📌 To see my confluences and/or linework, step 1: grab chart, step 2: unhide Group 1 in object tree, step 3: hide and unhide specific confluences. 😊
🎯 MSFT: Bulls Reload at Gap Fill - Spring Loads for Breakout
The Market Participant Battle:
The bulls who drove price from point 2 to point 3 have successfully defended their conviction zone at point 4 (the gap fill area). When point 3 closed above point 1, it validated point 2 buyers' strength. Now these same participants are reloading at their original entry zone with positive delta confirmation, setting up for another leg higher as buyers overwhelm sellers at this critical support level.
Confluences:
Confluence 1: Gap Fill Support with Positive Delta
The gap area at point 4 represents where buyers previously showed extreme conviction, creating upward price gaps to demonstrate urgency. Price has returned to this zone with POSITIVE volume delta, showing buyers are actively defending and accumulating at these levels. The Volume Footprint confirms buying dominance at this critical level, suggesting institutional accumulation rather than distribution.
Confluence 2: Hidden Bullish Divergence on RSI/MFI
Both RSI and MFI display hidden bullish divergences - price makes higher lows while indicators make lower lows. Additionally, both oscillators are oversold at the gap area (point 4), creating a second-degree layered bullish divergence. This technical setup typically precedes strong upward moves, particularly when occurring at historically significant price levels.
Confluence 3: Anchored VWAP Support Convergence
The anchored VWAP from point 1 brings point 4 precisely to the 1st standard deviation - a mathematically significant support level. This same reaction occurs when anchoring VWAP at the previous gap, suggesting algorithms and institutions are defending this price zone. The developing POC shows buyers stepping in below and then pushing price above, indicating active accumulation.
Confluence 4: Pitchfork Median Line Confluence
Anchoring the pitchfork at pivots 0, 1, and 2 creates a median line that intersects perfectly with the turning point where point 2 buyers defeated sellers from point 1. This geometric confluence at the gap fill zone suggests a high-probability bounce point.
Confluence 5: OBV Bollinger Band Extreme & Delta Divergence
The OBV touching the lower Bollinger Band extreme marks a capitulation point. Combined with the current candle showing bearish price action but BULLISH delta (buyers absorbing selling), this creates a powerful bullish divergence signal.
Web Research Findings:
- Technical Analysis: RSI at 64.861 suggests Buy signal, MACD at 2.850 indicates Buy
- Recent News/Earnings: Q4 earnings beat with $3.65 EPS vs $3.37 expected, revenue $76.44B vs $73.81B expected
- Analyst Sentiment: Average 12-month price target $625.78 with 20.82% upside potential
- Data Releases: Next earnings late October 2025
- Interest Rate Impact: Quarter-point Fed cut implemented with more cuts signaled for 2025
Layman's Summary:
Microsoft crushed earnings with AI and cloud revenue exploding. The stock pulled back to a key support level where big buyers previously showed strong interest (the gap). Now they're buying again at these levels (positive delta), while technical indicators are oversold and showing bullish divergences. With Fed rate cuts helping tech stocks and analysts targeting 20% upside, this looks like a solid reload opportunity.
Machine Derived Information:
- Image 1: Channel pattern with numbered reference points - Significance: Shows clear support test at gap fill area - AGREES ✔
- Image 2: Volume Footprint with positive delta at point 4 - Significance: Confirms buyer accumulation at gap support - AGREES ✔
- Images 3-6: Multiple timeframe confirmation - Significance: Consistent support holding around $509-510 gap zone - AGREES ✔
- Images 7-8: Moving average structure - Significance: Price testing key support with oversold bounce setup - AGREES ✔
- Images 9-10: Current consolidation - Significance: Bullish flag formation after support test - AGREES ✔
Actionable Machine Summary:
All machine-derived analysis confirms the bullish thesis. The gap fill area is holding with positive delta, multiple timeframes show support at this zone, and the consolidation pattern suggests accumulation before the next leg up. The combination of technical support, positive volume dynamics, and oversold indicators creates a high-probability long setup.
Conclusion:
Trade Prediction: SUCCESS
Confidence: High
The convergence of gap support with positive delta, multiple bullish divergences, and strong fundamental backdrop creates an excellent risk/reward setup. Machine analysis confirms buyer accumulation at these levels. Target the recent high at $518 initially, then $525-530 on a breakout. Stop loss below $508 for a favorable 3:1 risk/reward ratio.
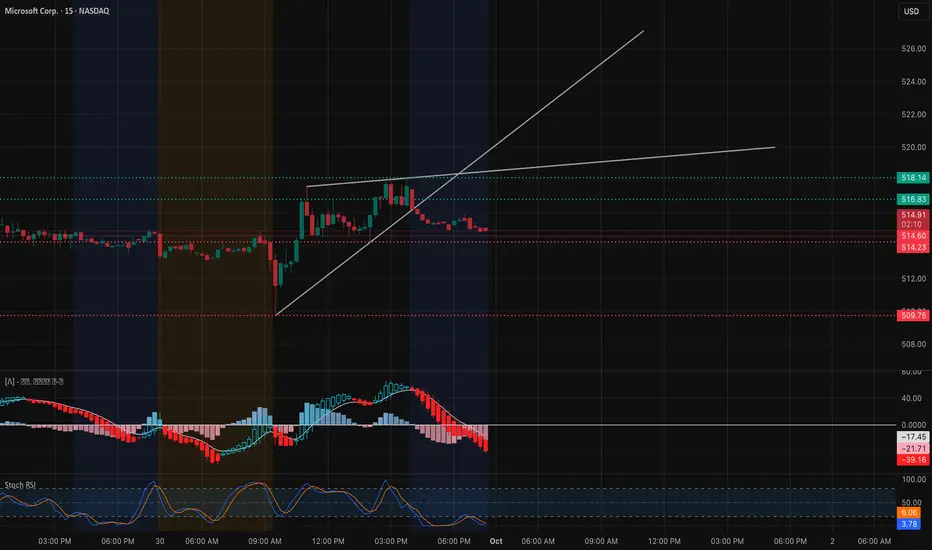
MSFT Setting Up for a Key October Move! 🚀Intraday View (15-Min Chart)
MSFT opened strong but momentum cooled into the close. Price is consolidating just above $514 support, with rejection near $518 showing sellers stepping in. The short-term trendline has already broken.
* Support Levels: $514.20, $509.75
* Resistance Levels: $516.80, $518.14
* Indicators: MACD is firmly red with downside momentum. Stoch RSI is bottoming, hinting at a possible oversold bounce.
📌 Intraday Thought: Watch $514 — if it holds, bounce potential back to $516.8–$518. A break below exposes $510. Scalpers can trade the $514 support bounce with tight stops, or fade $518 if retested.
Options & Swing View (1H + GEX)
The Gamma map is clear:
* Call positioning: Heavy between $522–$530, with a big wall at $524.
* Put support: Strong around $507–$505.
This sets up a coil between $514–$524. A breakout over $524 could fuel a gamma squeeze toward $530+, while failure at $514 risks a drop back to $507.
* Bullish Play: Debit call spread targeting $524 → $530 if $518 reclaims with volume.
* Bearish Hedge: Short-dated puts toward $514 → $507 if support cracks.
* Neutral Play: Iron condor between $507–$524 to capture premium while MSFT stays pinned.
My thoughts:
MSFT is gearing up for volatility into October. Intraday pressure favors caution, but the GEX landscape signals explosive potential if $524 breaks. Best approach: scalp intraday ranges, but keep eyes on $524 breakout vs. $507 breakdown for swing setups.
Disclaimer: This analysis is for educational purposes only and does not constitute financial advice. Always do your own research and manage risk before trading.
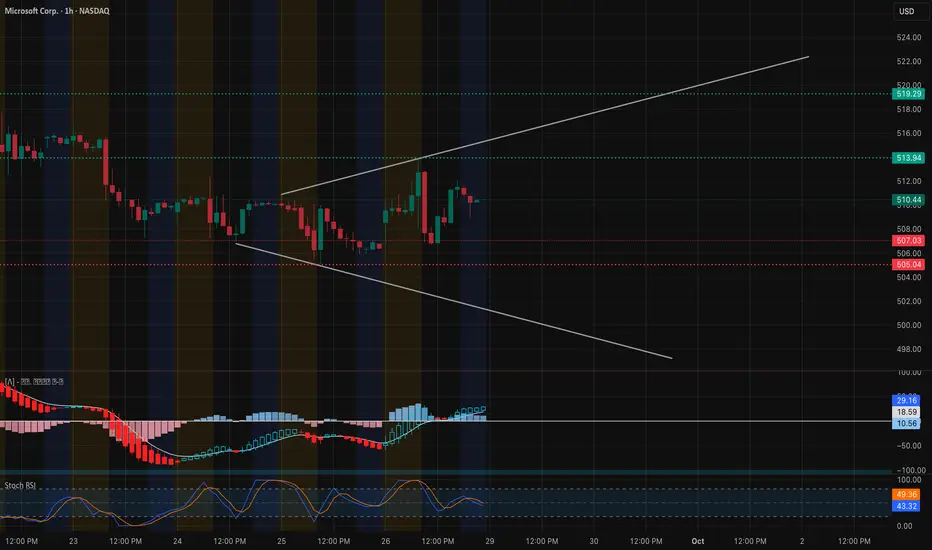
MSFT – Building a Base Breakout as Gamma Aligns Price. Sep 291-Hour Technical Outlook
Microsoft is forming an expanding wedge after a week of sideways-to-up action. Price is trading around $510–$511, testing mid-wedge support after a strong bounce from the $505 floor. MACD histogram is positive and climbing, and the Stoch RSI is curling up from mid-range, signaling that momentum is resetting for another potential leg higher.
Key resistance to watch is $513.9, with heavier supply stacked at $519–$520. On the downside, the critical support remains $505, with a safety net near $500.
Gamma Exposure (GEX) Confirmation
Options positioning provides solid backup to the chart:
Largest positive GEX / Call Resistance sits at $512, now acting as the key breakout trigger.
Next call walls cluster at $519–$520 (~44% call interest), matching the top of the expanding wedge.
On the downside, put support is significant at $500, aligning with the technical safety zone.
This GEX structure suggests that a strong hourly close above $513.9 could unleash dealer hedging that pushes MSFT quickly toward $519–$520. If $505 fails, negative gamma flow may accelerate selling to the $500 area.
Trade Ideas & Option Plays for This Week
Bullish Play: Go long on a sustained move above $513.9, targeting $519–$520. Options: 1-week 515 calls or 515/520 call spreads to keep risk contained.
Protective Hedge / Bearish Setup: Short below $505, looking for a slide to $500. Suitable instruments: 505/500 put spreads or short-dated puts.
With IVR near 21.4 and IVx around 22.9, premiums are relatively mild—ideal for debit spreads.
My Take
MSFT is showing early signs of accumulation inside a broadening formation. Gamma levels perfectly reinforce the $512 breakout line and the $505 fail-safe. Unless sellers regain control under $505, the stock leans toward a bullish continuation this week.
Disclaimer: This analysis is for educational purposes only and does not constitute financial advice. Always do your own research and manage risk before trading.
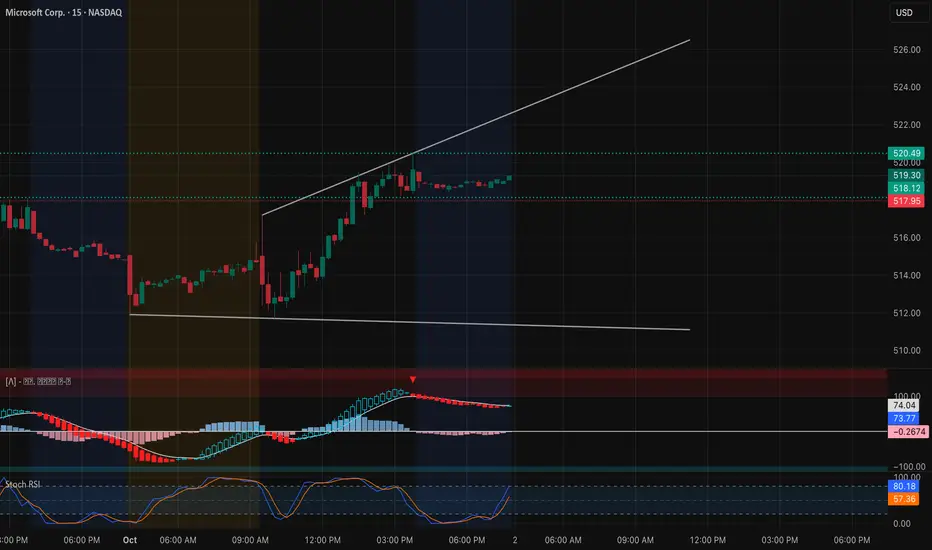
MSFT Hovering at $520 – Will Gamma Unlock the Next Leg? (Oct 2)Intraday (15-Min Chart)
Microsoft extended its rally into the $519–$520 zone, where it’s consolidating after a strong push. On the 15-min chart, the trendline remains supportive, but momentum is starting to flatten. MACD is rolling sideways, and Stoch RSI shows MSFT is cooling after overbought readings earlier in the session.
* Immediate support: $518.1 intraday pivot, then $515.9 for trendline support.
* Upside trigger: A breakout above $520.5 could fuel a run toward 522–525.
* Downside risk: Break below $515 risks a pullback toward 511.7–510, where buyers likely defend.
Bias intraday: constructive above 515, but the $520 wall is proving sticky — momentum traders need a clean break.
Options / GEX (1-Hour Chart)
Gamma positioning highlights where the next move could emerge:
* Call walls: Clustered at 522.5 and 525, with a heavy stack at 525 acting as the gamma ceiling.
* Put walls: Strong at 510, deeper at 505 and 500, outlining the risk floor.
* Sentiment: Options flow isn’t overly bullish (only ~10% calls), showing weaker speculative appetite compared to TSLA/PLTR.
This suggests MSFT could remain range-bound if it fails to clear 520. A breakout through 522.5–525 would shift hedging dynamics bullish and potentially unlock 530–535 as upside targets. Conversely, rejection here pulls MSFT back toward 510–505.
My Thoughts
For Oct 2, MSFT is coiling at resistance. Intraday plays favor long scalps above 515 targeting 522–525. For options traders, the clean play is a 520/525 call spread, defined risk into the gamma ceiling. If weakness emerges under 515, hedges with short puts toward 510 provide protection.
Bias: Bullish leaning, but the real breakout requires 522.5+. Until then, MSFT likely chops between 515–520.
Disclaimer: This analysis is for educational purposes only and does not constitute financial advice. Always do your own research and manage risk before trading.
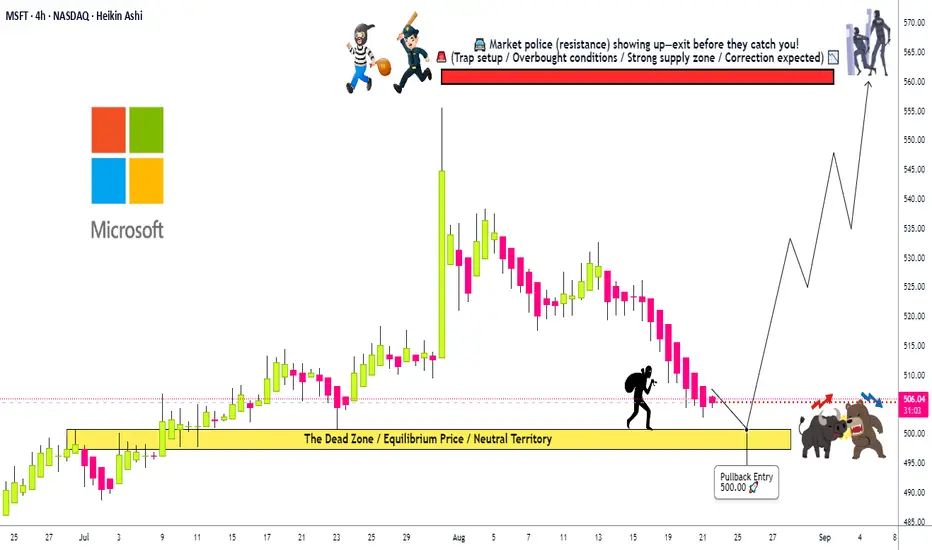
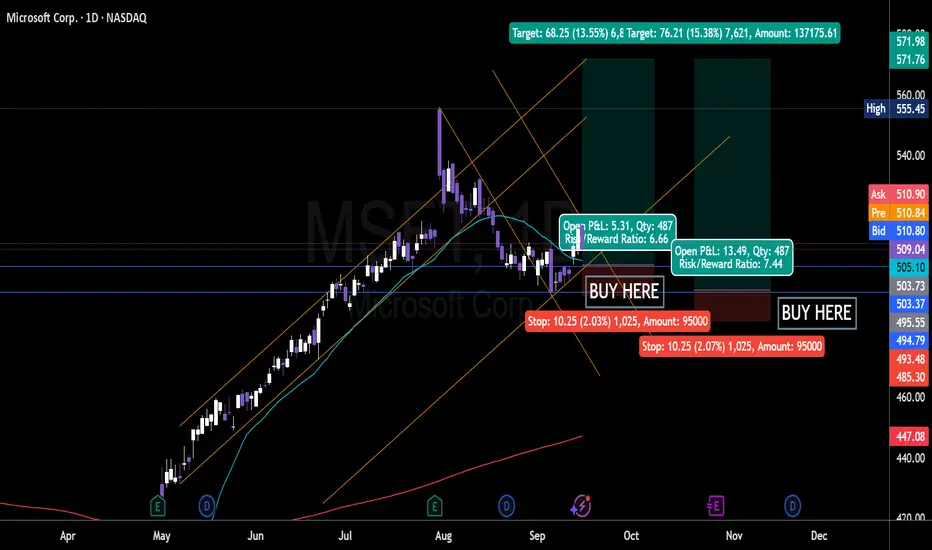
Microsoft: The Perfect Pullback Is Coming. Are You Ready?🌟 MSFT HEIST ALERT! 🌟 Steal from the Cops, Not from the Citizens! 🚔➡️🤑
Dear Ladies & Gentleman of the Thief Trading Guild, 🎩👒
Based on the 🔥Thief Trading Style Analysis🔥, here is our master plan to heist the Microsoft Corporation (MSFT) fortress. Our intel confirms a BULLISH ambush is setting up! It's time to loot! 💰💸✈️
🦹♂️ THE HEIST PLAN (SWING TRADE) 🦹♂️
Entry Point: The Perfect Pullback Loot Zone! 🎯
We're waiting for the asset to pull back to our LAYERED LIMIT ORDER TRAP! 🪤 Thief OG's use multiple entries to maximize the steal!
LAYER 1: 510.00 (First dibs!)
LAYER 2: 505.00 (Loading the bag!)
LAYER 3: 500.00 (MAIN HEIST - Perfect Pullback!)
LAYER 4: 498.00 (Bonus loot! Add more layers based on your own risk, thieves!)
Stop Loss: The Getaway Car Location! 🛑🏎️
This is Thief SL @ 485.00. This is where the trade idea is invalidated. Dear Thieves, adjust your final SL based on your own risk, strategy, and how many layers you used. Don't get caught! 👮♂️🚔
Target: The Police Barricade! 🚧🚨
Intel shows a major resistance wall (Police Barricade) at 565.00. Our mission is to escape with the stolen money BEFORE we get there! Escape Target: 560.00! Count your profits and live to trade another day! 💵🎉🤝
📢 THIEF'S BROADCAST 📢
Yo! Listen up, crew! 🗣️ If you're placing limit orders on this pullback, your stop loss should be set ONLY AFTER your order is filled! You feel me? Now, if you're smart, you'll place that stop loss where I told you 📍, but if you're a rebel, you can put it wherever you like 🤪 - just remember, you're playing with fire 🔥, and it's your risk, not mine! 👊
⚠️ TRADING ALERT : EARNINGS & NEWS ⚠️
MSFT is a big cap stock, and news/earnings can cause extreme volatility! To protect your stolen loot:
Avoid entering new layers before major news.
Consider taking some profit before earnings.
Use trailing stop-loss orders to protect running positions!
💖 Supporting our robbery plan = 💥Hitting the Boost Button💥 It fuels our getaway car and helps us find the next big heist! Let's make stealing money look easy! 🏆💪❤️🎉
I'll see you at the next heist, so stay tuned! 🤑🐱👤🤗🤩
Microsoft’s Battle with the $520 Resistance!🔎 Technical Outlook
📍 Current Situation
The stock is testing the critical $515–$520 resistance zone (purple line).
The 50-day moving average (yellow) sits around $511, acting as near-term support.
Multiple rejections around $520 highlight how important this level is.
🎯 Short-Term Strategy (Swing / Daily)
Entry: Daily close above $522
Target 1: $535
Target 2: $548–$550
Stop-loss: Daily close below $511 (50-day MA and recent support)
⚠️ If the price fails to hold above $520 and breaks below $511, a pullback toward $490 is likely.
🎯 Long-Term Strategy (Position / Weekly)
Safe Entry: Break and hold above $530
Mid-term Target: $565
Long-term Target: $580–$600 (potential new all-time high)
Stop-loss: A breakdown below $484 (major support and previous swing low)
📌 Summary
Short-term: The $520 zone is the battlefield. Breakout = bullish momentum, rejection = correction.
Long-term: A confirmed breakout above $530 clears the path toward new highs.

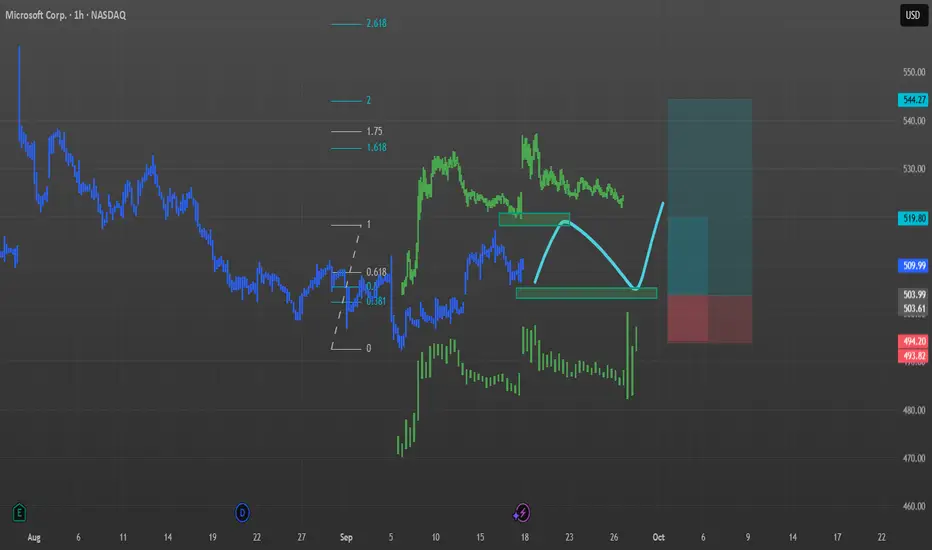
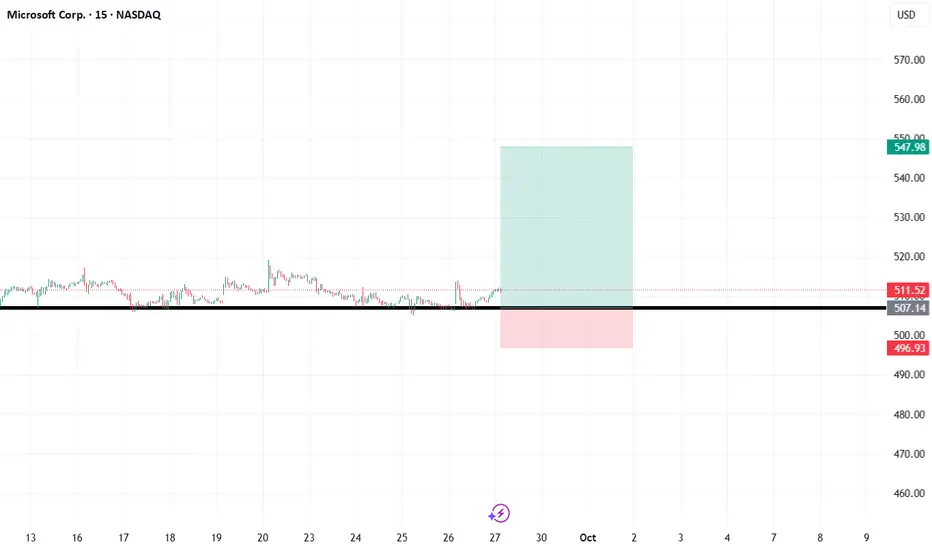
MSFT: Potential Long Opportunity from Key Support LevelThis is a technical analysis of Microsoft Corp. (MSFT) on the 15-minute chart. The idea presented is based on the price action consolidating above a significant support level, suggesting a potential move to the upside.
Analysis:
The chart indicates that MSFT has been trading within a range, establishing a strong horizontal support level at approximately $507.14. The price has respected this level on multiple occasions, indicating strong buying interest and accumulation in this zone. This repeated defense of the support line suggests it is a critical level to watch.
The current trade setup anticipates a bounce from this consolidation area, betting on the continuation of the support's strength.
Trade Setup:
Entry: The proposed entry is around the current price level of $511.52, acting on the assumption that the support will hold.
Take Profit: The upside target is set at $547.98. This level represents a significant potential reward if the bullish momentum resumes.
Stop Loss: A stop loss is placed at $496.93, positioned below the key support zone. This is a crucial risk management measure to protect against a breakdown if the support level fails.
Risk/Reward:
This setup offers a favorable risk-to-reward ratio. By risking the distance between the entry and the stop loss for the potential gain up to the take-profit level, traders can aim for a reward that is substantially larger than the initial risk.
Disclaimer: This analysis is for educational and informational purposes only and should not be considered investment advice. All trading involves risk. Please conduct your own research and due diligence before making any trading decisions.
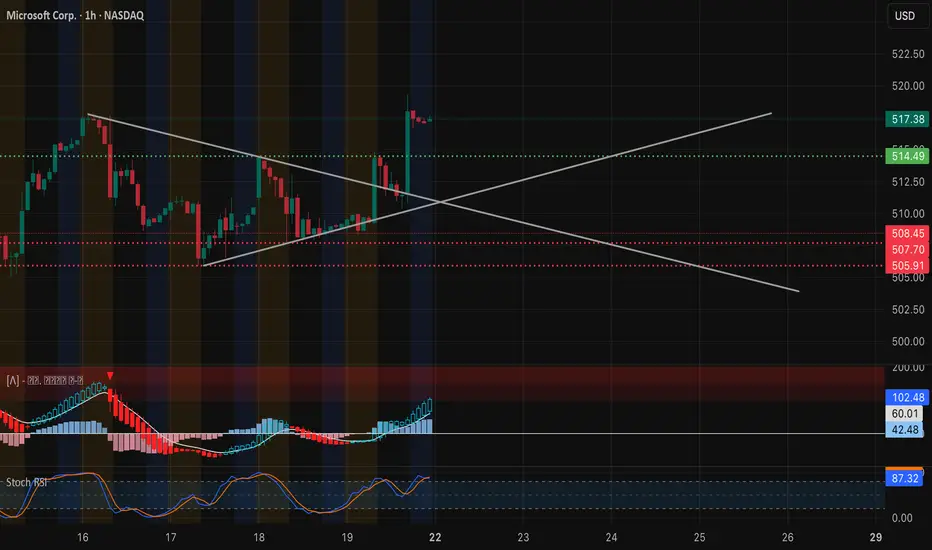
MSFT Sep 22 TA – “Breaking the Ceiling or Back to the Box?”
1️⃣ Big Picture on the 1-Hour Chart
* Price action: Microsoft closed around 517.38, breaking out of a multi-day consolidation. Price ripped above 514.5 and is holding gains just under the next resistance zone.
* Key levels:
* Resistance: 519.3 → 525 (recent high and call wall)
* Support: 514.5 → 510 (former resistance and trendline retest area)
* Indicators:
* MACD is strong and rising, showing solid bullish momentum.
* Stoch RSI is elevated near 87, signaling overbought conditions that could lead to a short pause or pullback.
The short-term structure is bullish, but after a sharp pop, MSFT might need to consolidate to build fresh energy.
2️⃣ GEX / Options Flow
* Largest call clusters appear around 525 and 540, with notable resistance at 520 already being tested.
* Key put support stands at 502.5, with heavier walls near 497.5 and 495.
* IVR sits at 7.8—low compared to historical norms—indicating that option premiums remain relatively cheap for quick trades.
The options board suggests market makers may try to pin MSFT in the 514–520 area if momentum cools. A decisive close above 520 would shift gamma flows toward 525–530 quickly.
3️⃣ Trading Thoughts & Suggestions
* Scalp / day trade: Watch for a sustained push over 519–520 with strong volume. Target 523–525, with a tight stop below 516.
* Support bounce: A controlled dip back to 514–515 that holds could provide a fresh long entry.
* Fade setup: A quick rejection at 520–523 with heavy selling pressure could send price back to 510–505.
4️⃣ Bottom Line
MSFT just broke out of its consolidation box and is testing key resistance. Bulls need a clean break above 520 for another leg higher. Bears want to see a rejection at 520 with a fade back toward 510.
Disclaimer: This is just market opinion for educational discussion. It’s not financial advice. Always manage your own risk before trading.
MSFT HAGIA SOPHIA! Self-explanatory, I think. Never trust motivational moves! They fade faster than a New Year's resolution! Yet we all fall for it all the time. The difference is we don't bet our hard-earned money every time we get motivated to learn our lesson after about the fifth or sixth or seventh... time!
For some reason, in trading, it's different; most don't even learn after the hundredth time! I am guessing it has something to do with the herd mentality. Others are doing it so its okay for me to lose my ass with them for the one hundredth and one time chasing!!
If I haven't convinced you yet, NOT to do it. Try thinking of it like this. There are many better trades out there to buy!
Hagia Sophia is not there to make you rich! It is there to humble you!
Click boost like and subscribe! l3ts get to 5,000 followers! ))

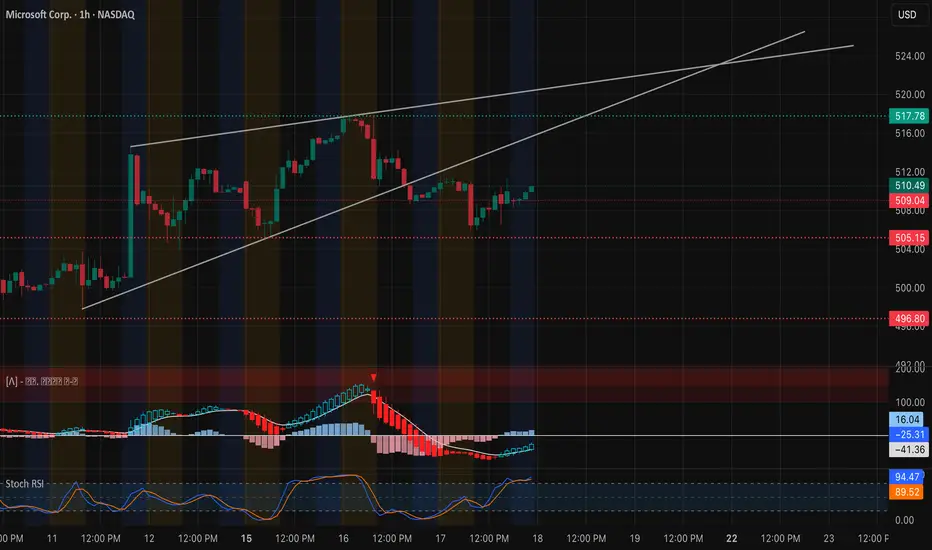
MSFT Trying to Reclaim Momentum – Sept 18 Trade Setup 💡 Here’s my TA look at Microsoft for Wednesday, using the 1-hour chart and GEX options data.
1️⃣ Price Action & Structure
* Sideways-to-up channel: MSFT is still within its rising channel but recently pulled back to test the lower boundary near $505. Buyers stepped in, bringing price back to $510.
* Key pivot: $510–512.5 is the short-term battleground. A clean hourly close above here would likely target $517.5 next.
* Support zone: If $505 breaks, next guardrails are $500 and $497.
2️⃣ GEX (Options Flow) Check
* Call magnets: Strong gamma walls cluster at $512.5 and $517.5, with heavier resistance around $525–530.
* Put defense: Major put walls stack at $495 and $490, providing a cushion if the market turns.
* Low IVR: IVR is only 9.4 with IVx ~23.7—options are on the cheaper side.
3️⃣ Trading Thoughts
* Bullish play: If MSFT closes above $512.5, look for a run to $517.5 and maybe $525. Logical stop under $505.
* Bearish hedge: Short only if $505 fails. First downside target is $500, then $497.
4️⃣ Option Angles
* Upside trade: Call spreads like 510/520 or 510/525 are a defined-risk way to catch a move higher.
* Neutral strategy: Selling puts under $495 offers premium if you expect MSFT to hold above major support.
5️⃣ My View
Microsoft is still in a healthy structure after last week’s shakeout. If it clears $512.5 with good volume, I’d favor a push to the mid-$520s. A drop under $505, however, flips the script quickly.
Disclaimer: This analysis is for educational discussion only and does not constitute financial advice. Always do your own research and manage risk before trading.
Microsoft (MSFT)Microsoft (MSFT) has partnered with OpenAI, integrating AI into products like Office, Bing, and its Azure cloud platform. This is a classic “picks and shovels” play, because Microsoft makes money whenever other businesses use its cloud services to run AI models.
MSFT 1H + GEX Game Plan for Tue, Sep 16MSFT Closing In on 520 Gamma Zone — Ready for a Fresh Breakout? 💡
Market Structure (1-Hour View)
* Reversal & breakout: Microsoft powered off a 504 base, reclaimed the broken trendline, and is grinding higher toward 516.
* Momentum: MACD remains bullish with an expanding histogram; Stoch RSI is hovering near overbought (~90+), signaling strong momentum but risk of short pullbacks.
* Trend context: Price is now above key short-term MAs and pointing to a continuation pattern.
Key Levels to Watch
* Resistance: 515.7 (current cap), 520.0–522.5, and 525–530 as upper gamma targets.
* Support: 512.5, 509.9–505.0, and 495.0 as deeper safety nets.
GEX Read (Sep 16)
* Highest positive NETGEX / Call Resistance / Gamma wall: 520.0
* 2nd Call Wall: 522.5, 3rd Call Wall: 530.
* Put walls / downside magnets: 495 and 490.
* Options sentiment: Calls ~13% (light but steady), IVR ~10, IVx ~23.5 → low implied volatility, option premiums relatively cheap for directional plays.
Implication:
* Dealers may attempt to pin MSFT between 510 and 520 if flow is neutral.
* A decisive breakout >520 could invite hedging that propels price toward 522.5 → 525–530.
* Lose 505 and momentum can quickly unwind toward 495–490.
Trade Scenarios
1) Bullish Breakout
* Trigger: 1H close >516–518 with rising volume.
* Entry: 518 on retest/hold.
* Targets: 520 → 522.5 → 525.
* Stop: Below 514.
* Options: 520/525 call debit spread for a near-term push.
2) Range Fade
* Trigger: Failure to clear 516 with multiple rejection wicks.
* Entry: 515.5–516 short.
* Targets: 512.5 → 509.9.
* Stop: Above 518.
* Options: 515P or 515/510 put spread for a short pullback.
3) Breakdown
* Trigger: 1H close <505 with weak retest.
* Entry: 504–505 short.
* Targets: 495 → 490 (put support).
* Stop: Back above 508.
Options: 505/495 put spread for a deeper corrective leg.
Scalping & Swing Notes
* If MSFT gaps up near 518, expect a quick test of 516 before direction sets.
* EMA/VWAP retests that hold above 514–515 favor continuation; dips to 512–513 may offer buy-the-dip scalps.
Risk & Management
* IV is relatively low, making debit call spreads cost-efficient.
* Keep stops tight near breakout zones; take partial profits at first target to lock gains.
This analysis is for educational purposes only and does not constitute financial advice. Always trade with a plan and manage your risk.

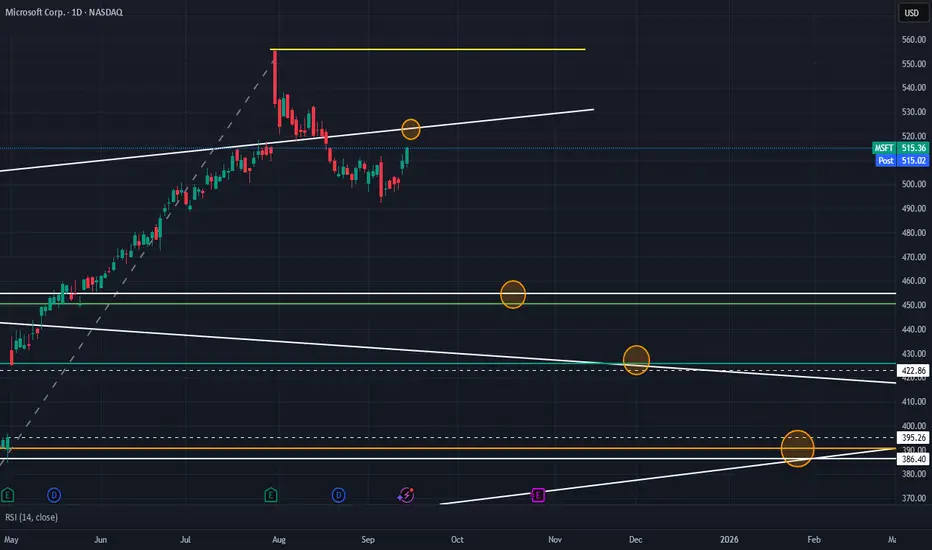
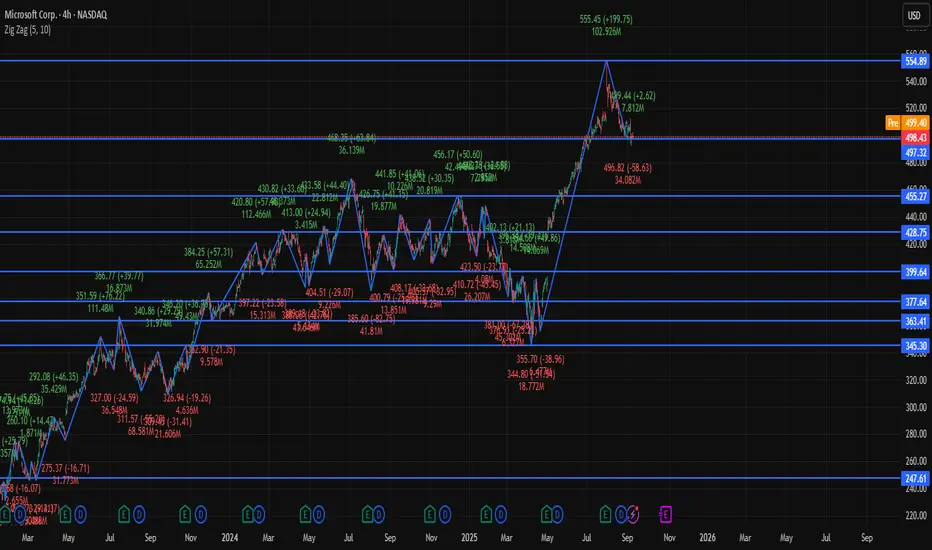
MSFT - Price ProjectionMSFT made a high on 31/07/2025 at 555 which turned out to be a big bearish engulfing candle. Chart pierced above a long term trendline at 515 to touch 555 and then formed a bull trap and continued its downward journey. Since then, price has been making Lower Highs and Lower Lows. Although it’s still just above SMA50.
In the short term, price is likely to kiss a trendline at 522 to 525 before heading downwards.
The question is where would I be a buyer?
I would inch in to buy for a swing trade at three levels:
- my first buy would be at around 450 to 455. This is strong support zone with previous pivot highs hitting this zone. This is also a Fib retracement level of 50%
- my second buy would be 425. This a support level, driven from a trendline which has acted as resistance for previous 3 pivot highs. This is also a Fib retracement level of 61.8% at 425.80. There is a gap fill at 422.86 as well
- my third buy would be between 395 and 386. This is a strong support level and a confluence of a long term trendline that dates to 2023. There is gap fill at 395.26 and Fib retracement level of 78.6% at 390.75
If stock market really had a strong dump, then my buy level for hodl/long term would be around 320. There is a trendline at this level that dates to 2019.
Alternatively, my thesis will be invalid if MSFT close above 555.50.
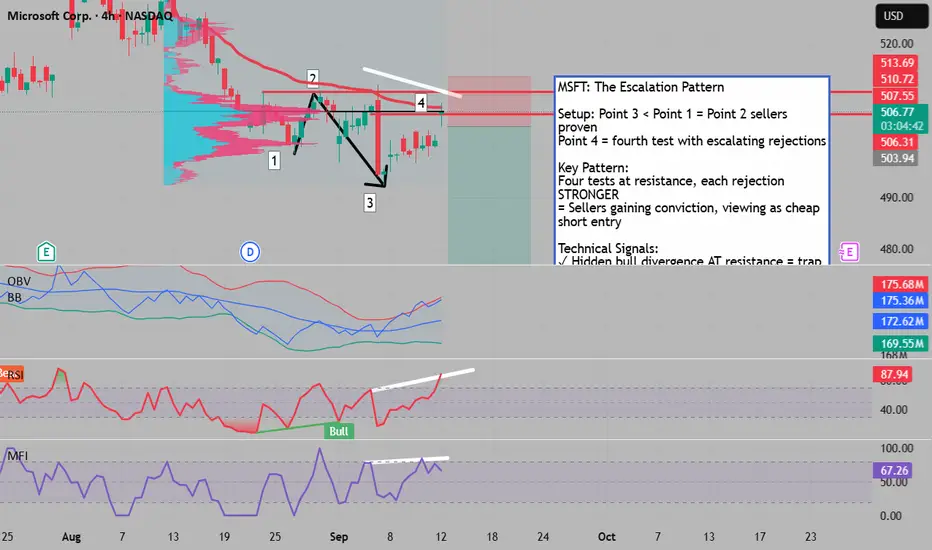
The Escalation Pattern: MSFT's Strengthening Rejection# The Escalation Pattern: MSFT's Strengthening Rejection
## Seller Authority Confirmed (Points 1→3)
The market delivered its verdict when Point 3 closed decisively below Point 1 , establishing Point 2 sellers as the dominant force in the local market structure. This wasn't a minor victory - it was proof of seller superiority. Now at Point 4 , price has returned to test these proven sellers' resolve.
## The Escalation Phenomenon
What makes this setup extraordinary is the escalating rejection pattern . Price has tested this resistance zone three times , and each rejection has been progressively stronger . This isn't random - it reveals sellers gaining conviction, increasingly viewing these levels as attractive short entries.
Think of it as the opposite of accumulation - it's distribution with growing confidence . Each failed attempt emboldens more sellers to defend this zone.
## Hidden Bullish Divergence - The Trap
Here's where it gets interesting:
• Price : Lower high at Point 4
• RSI/MFI : Higher highs (hidden bullish divergence)
• Both oscillators : Oversold territory
Typically, hidden bullish divergence suggests continuation up. But when it appears at proven resistance with escalating rejections , it becomes a trap. The divergence shows buyers trying harder (higher momentum) but achieving less (lower price high) - a sign of exhaustion, not strength.
## The Volume Ceiling Signal
The OBV has pierced the upper Bollinger Band - a rare occurrence that typically precedes reversals. When volume indicators hit extremes while price fails to break resistance, it suggests:
• Buyers exhausting their ammunition
• Sellers absorbing all buying pressure
• Imminent reversal as buying dries up
## VWAP and POC Alignment
Using a local high anchor, price touches the VWAP median line - a mathematical resistance point. More importantly, at trade entry (stop order), we'll be below the Point of Control (POC) , meaning:
• Highest volume node acts as support for shorts
• Majority of traders have positions above current price
• Institutional algorithms defend POC levels
## The Triple Test Rule
In technical analysis, the triple test is significant:
• First test : Establishes resistance
• Second test : Confirms resistance
• Third test : Often breaks OR fails spectacularly
With each test showing stronger rejection , we're seeing the "fail spectacularly" scenario setting up.
## Risk Management Framework
Entry Signal:
• Current rejection from Point 4
• Stop order activation below POC
Stop Loss: 513.69 (1.93% risk) - Above Point 2 (proven seller level)
Target: 496.69 (11.25% reward) - Chaos Theory zone support
Risk/Reward Ratio: 1:5.8
Position Advantages:
• POC below entry provides support
• Multiple rejections reduce false breakout risk
• Escalating pattern suggests strong conviction
• Target aligns with mathematical support zone from Chaos Theory indicator
## The Conviction Story
The escalating rejections tell a clear narrative:
1. Sellers defend their territory (first test)
2. Sellers gain confidence (second test, stronger rejection)
3. Sellers become aggressive (third test, even stronger rejection)
4. Sellers dominate completely (fourth test, strongest rejection yet)
5. Buyers exhaust despite trying harder (divergence trap)
This isn't just resistance - it's active, confident distribution .
---
Key Takeaway: When resistance strengthens with each test rather than weakens, when divergences appear at proven resistance, and when volume hits extremes without price progress, you're witnessing distribution, not accumulation. The escalation pattern suggests this isn't just a top - it's a top with conviction.
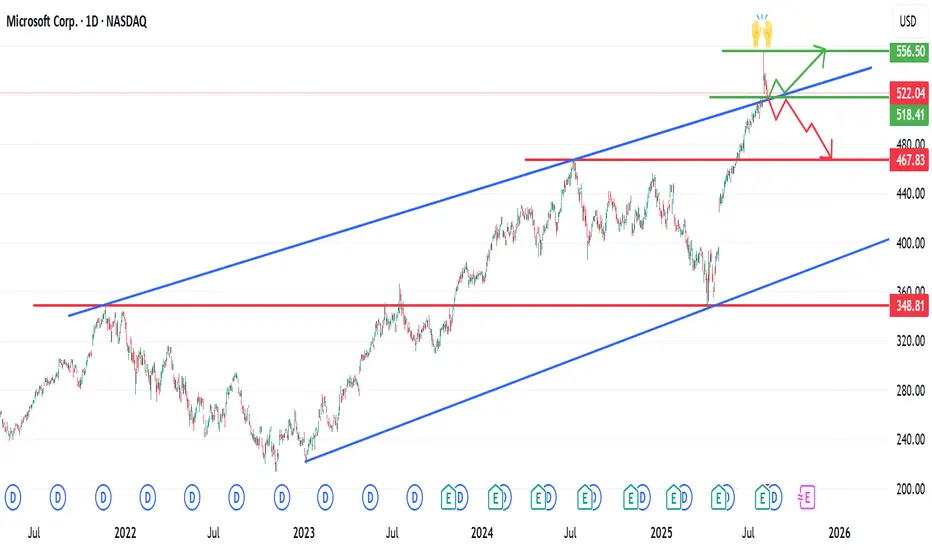
Microsoft (MSFT) Technical Update & its channelMicrosoft (MSFT) Technical Update & its channel
Microsoft began forming a long-term ascending channel as far back as November 2021, marked by three higher highs and two higher lows, as illustrated on the chart.
The price action became particularly interesting when it broke out of this channel, reaching a new all-time high (ATH) of approximately $557.
However, the underlying fundamentals (catalysts) were insufficient to sustain momentum at that level, leading to a pullback.
The stock is now consolidating around the $522 zone — a key confluence area where the ascending trendline meets a horizontal support level.
Outlook:
If price breaks below this zone and re-enters the channel, a deeper correction could follow, with potential downside targets in the $500 – $480 range.
As always, I encourage you to review the chart, share your thoughts in the comments, and connect if you’d like to discuss further.
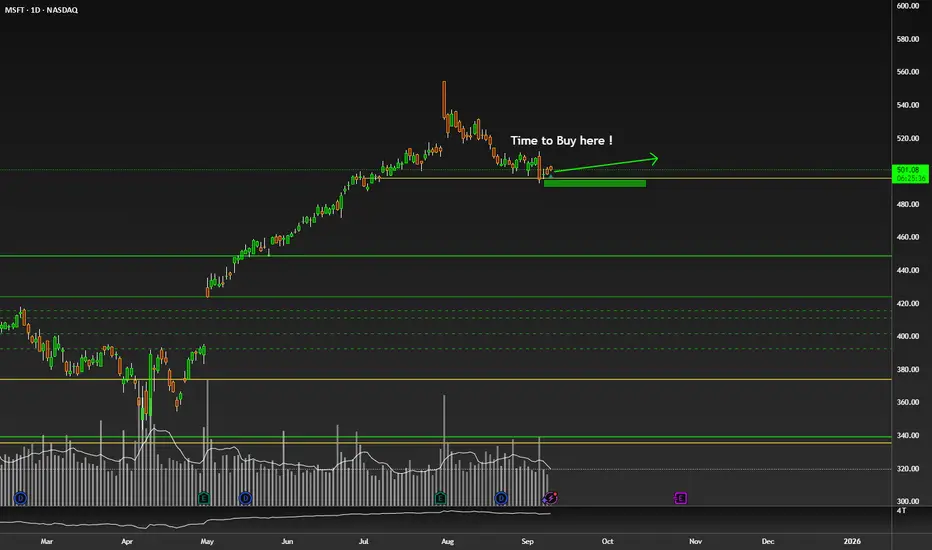
$NASDAQ:MSFT Nice Area to Long or Accumulation !NASDAQ:MSFT Nice Area to Long or Accumulation !
Price Action Tells Every thing !
Cooled already here.
Accumulation place.
nice support area.
Boost if you agree !
MSFT 1D Time frameMarket Snapshot
Current Price: ~$498.41
Daily Change: +0.23 (≈0.05%)
Market Cap: ~$2.79 Trillion
P/E Ratio: ~28.9
EPS: ~12.93
🔎 Technical Indicators
RSI (14-day): ~41 → Neutral, leaning slightly bearish.
MACD: –2.7 → Negative but giving a weak buy crossover signal.
Williams %R (14-day): ~–74 → Suggests a possible rebound (buy).
CCI (14-day): ~–108 → Oversold zone, buy indication.
ADX (14-day): ~20.6 → Weak trend strength.
ROC (Rate of Change): –3.5 → Mild bearish momentum.
📈 Moving Averages
5-day MA: Below current price → Bearish short-term.
20-day MA: Below current price → Bearish.
50-day MA: ~$509, above price → Acting as resistance.
100-day MA: ~$476, below price → Supportive.
200-day MA: ~$443, below price → Long-term uptrend still intact.
🔧 Support & Resistance
Support Zone: ~$491 – $497
Resistance Zone: ~$500 – $510
📅 Outlook
Bullish Case: If MSFT climbs above $509–510, momentum could extend toward new highs.
Bearish Case: A break below $491 may lead to a pullback toward $480–485.
Overall Bias: Neutral to slightly bearish in the short term, but long-term bullish trend remains intact above the 200-day MA.

MSFT 45Minutes Time frameMSFT 45-Minute Snapshot
Metric Value
Current Price $498.41 USD
Change +0.05% from previous close
Market Cap $2.79 Trillion
P/E Ratio 28.88
EPS $12.93
🔎 Technical Indicators
RSI (14): 40.92 — Neutral
MACD: -2.70 — Bearish momentum
Moving Averages:
5-period SMA: $502.33 — Sell signal
10-period SMA: $504.10 — Sell signal
20-period SMA: $509.62 — Sell signal
50-period SMA: $509.09 — Sell signal
📈 Market Sentiment
Pivot Points:
R1: $507.19
R2: $519.38
R3: $526.79
S1: $487.59
S2: $480.18
S3: $467.99
📅 Outlook
Bullish Scenario: A breakout above $507.19 could lead to a push toward $519.38 and higher.
Bearish Scenario: A drop below $487.59 may test support around $480.18.
Overall Bias: Neutral to slightly bearish, with mixed signals from moving averages and momentum indicators.

MSFT 4Hour Time frameMSFT Snapshot (as of latest session)
Current Price: Around $498.40
Day Range: $497.0 – $502.2
Open: ~$501.4
Market Cap: ~$2.79 Trillion
P/E Ratio: ~28.9
EPS: ~12.93
Pivot Levels (Daily basis, useful for 4-Hour analysis)
Pivot Point: ~$498.9
Resistance Levels:
R1: ~$499.5
R2: ~$500.0
R3: ~$500.6
Support Levels:
S1: ~$498.4
S2: ~$497.8
S3: ~$497.3
Technical View (4-Hour Frame)
Momentum: Price is consolidating near the pivot (~$498–499).
Indicators:
RSI around 45 → neutral to slightly bearish.
MACD negative → bearish bias.
Moving Averages (short and long) → leaning bearish.
Bias:
A breakout above $500 may open short-term upside toward ~$500.6 or higher.
If MSFT falls below $498, pullback risk increases toward $497.8 → $497.3.
✅ Conclusion: On the 4-hour timeframe, MSFT is in a neutral-to-bearish phase, stuck around its pivot. Buyers need a clear move above $500 to regain strength; otherwise, it risks drifting lower toward support.
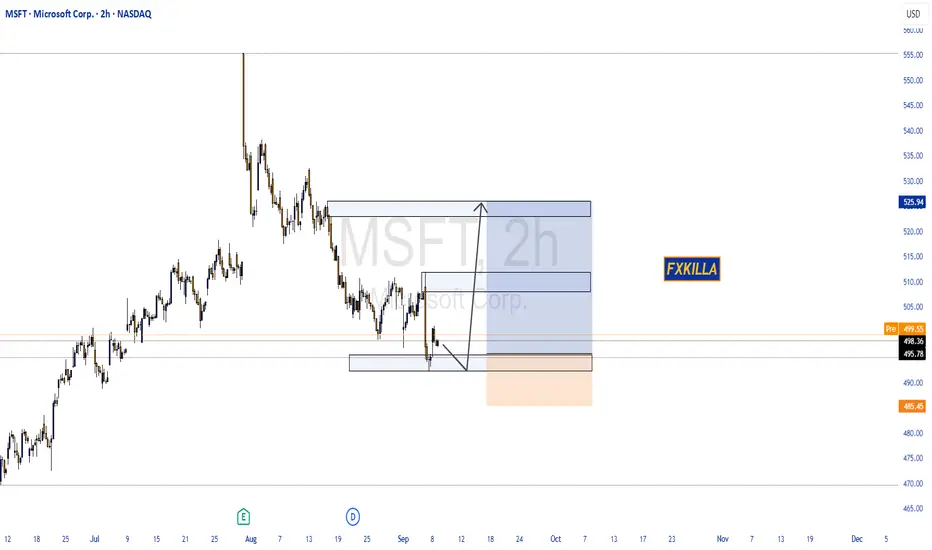
MICROSOFT CORP. HIGH PROBABILITY SETUP SOON!!🚨 MSFT HIGH PROBABILITY BUY SETUP 🚨
* Here We Can See Clearly The Next Potential Move For MSFT Coming Hours/Days.
* Keep Your Eyes Close On Your Trading Positions.
* Happy PIP Hunting Traders.
FXKILLA.