Texas Instruments Stock Surge on Strong Q1 ResultsTexas Instruments ( NASDAQ:TXN ) saw a remarkable surge of around 7% in premarket trading following the release of its strong Q1 results, igniting a broader rally in chip stocks. The company's robust second-quarter revenue forecast, surpassing analyst estimates, has instilled optimism in the semiconductor market's recovery prospects.
Texas Instruments ( NASDAQ:TXN ), renowned as a semiconductor bellwether due to its extensive product applications across various industries, reported a stellar performance in its first-quarter results. The company's shares soared in premarket trade, indicating a positive market sentiment towards semiconductor stocks.
One of the key highlights of Texas Instruments' Q1 earnings report was its bullish revenue forecast for the second quarter, with a midpoint projection of $3.8 billion. This forecast exceeded the expectations of analysts, who had estimated revenue of $3.77 billion. Such optimistic guidance from Texas Instruments bodes well for the broader semiconductor industry, reflecting a potential uptick in chip demand across multiple sectors.
Analysts at J.P. Morgan expressed confidence in Texas Instruments' growth trajectory, anticipating a sustained recovery throughout the year's second half and into 2025. This outlook underscores the company's resilience and its ability to capitalize on improving market conditions.
Furthermore, the resurgence in demand for consumer electronics signals a positive trend for Texas Instruments ( NASDAQ:TXN ), suggesting that inventory corrections in clients' analog chip holdings may be nearing completion. However, challenges persist in the automotive segment, where inventory clearance is still underway. Despite this, Texas Instruments ( NASDAQ:TXN ) remains well-positioned to navigate market fluctuations and capitalize on emerging opportunities.
Trade ideas

TXN rising and at fair value LONGTXN is on a 240 minute chart. It is a grinder from the 70s. I was there and a proud owner of
a TI programmable calculator costing $500 as a teenager. New cars cost $5000 for a nice VW
Bug ( got them nearly the same time). TXN has a role to play in semi-conductor and AI space.
It has been lagging others. The chart makes me believe that it is waking up. Buying after
a TTM squeeze at the mean of the anchored VWAP or the middle line of the bands is a way
to lower risk and get fair value. TXN was there for me back in the day. I am taking a long
trade now. It's time to get a full rebate ( or more with badly inflated dollars). TXN has retested
that mean VWAP line. It's good to go.

RiskMastery's Red Flag Stocks - TXN EditionWelcome to RiskMastery's Red Flag Stocks - Stocks with bearish potential.
In this edition, we'll be looking at NASDAQ:TXN ...
I believe this code is at a point of potential volatility.
If price can hold below $164.09 ... Bearish potential may be unlocked.
My key downside targets include:
- $155.15 (Conservative)
- $145.16 (Medium)
- $133.85 (Aggressive)
If however price breaks above $173.68 ... Bullish potential may be unlocked.
(My key risk targets - C, M,& A - are as noted on the chart)
Enjoy, and I look forward to being of further service into the future.
If you'd like to connect, feel free to reach out and comment below.
Mr RM | Risk Mastery
Disclaimer:
This post is intended for educational purposes only - Publicly available RiskMastery information & content is not intended to be financial advice in any shape or form. Please do your own research and seek advice from a licensed professional before acting on any of the information contained within this post. This post is not a solicitation or recommendation to buy, sell or hold any positions in any financial instrument. All demonstrated trades are merely incidental to the educational training RiskMastery aims to provide. You are solely responsible for your own investment and trading decisions, of which should be made only according to your own opinion, knowledge and experience. You should not rely on any of the information contained on this site or contained in any RiskMastery material on any website or platform. You assume the sole risk of any trade or investment you elect to make. RiskMastery and affiliates shall not be liable to you for any monetary losses or any other damages incurred directly or indirectly, from your use, reliance or reference of RiskMastery materials, content and educational information. Thank you for your understanding and cooperation - We look forward to working with you into the future to navigate the fine line of trading and investment success.

TXN: Potential BuyJust broken out of a bullish flag pattern, I'm expecting the price to keep climbing upwards. Final target at 196 USD.

Intuition stock TXNThese intuition hits have been $, so I'm not gonna fight it.
I asked on Sunday & was delivered this one with the numbers $149 first (which was close to the Friday closing price). I do NOT look at a chart first as I aim to be completely neutral, and this stock isn't even on my watchlist, so I didn't know where it was trading.
Anyway, the following numbers were 163 and later 171 chimed in.
It just so happens earnings are tonight. I don't try to predict earnings anymore, but dowsing suggested a low to $140 and I'd assume buy it. Dowsing also gave a price of $161 today and Sunday gave $167. Suggestion it's "bottoming out" and will hit the targets, as they usually do.
Let's hope cuz now I am getting more confident with these!

Texas Instruments $TXN Trade IdeaYesterday I took a trade on NASDAQ:TXN
The price broke above the 50 MA and all the key moving averges I use for short term trading.
In addition the price closed with a bullish hammer resting on the moving average.
Recently the price also closed above the long term diagonal resistance.
THe oscillators are showing overbought condition in the short term, so I could see a pullback at some point to test the MAs, however the stock seems to be showing bullish momentum.
My price target will be around $165 in the short/medium term but I might exit with profit at $160.50 if it starts to look overextended in the short term and re-enter if the price makes a pullback before another way up.
Hope this was helpful for the readers, can follow me for more ideas.
Thank you,
BK

$TXN - WeeklyNASDAQ:TXN showing signs of clear stopping volume on the weekly. Bullish engulfing, followed by another high volume retest of $145.

TXN BUY+++++Way oversold for some time now, if one wanted to catch the proverbial falling knife TXN is a good bet here at support I'd expect a bounce back to $161.05 to $163 in coming two weeks
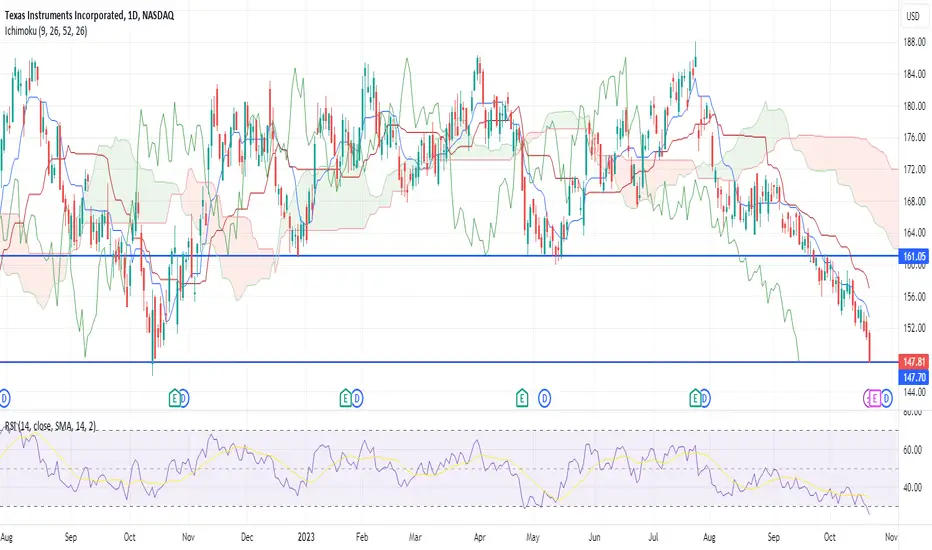
RECTANGLENeutral pattern until broken and this one has broken to the downside.
Horizontal trading channel and a consolidation pattern.
The top line is resistance and the bottom line is support until broken.
Support is now resistance for TXN.
Short interest below 2 percent.
NO RECOMMENDATON

The Semiconductor Industry and Texas Instruments Long TXN
Company Overview: Texas Instruments (TXN) is a prominent and long-established semiconductor company headquartered in Dallas, Texas. Founded in 1930, TXN has evolved into a global leader in the semiconductor industry, with a diverse portfolio of analog and embedded processing products. Here are some key aspects of the company:
Product Range:
TXN specializes in analog and embedded processing semiconductors. Analog chips are designed to process real-world signals such as sound, light, temperature, and motion. They are used in a wide range of applications, from industrial and automotive systems to consumer electronics.
As tensions between Taiwan and China continue to rise, it is a good idea to consider the semiconductor business as an industry to invest in. The largest chip manufacturer in Taiwan by far is Taiwan Semiconductor Manufacturing Co (TSMC). Although TSMC focuses on digital semiconductors, the hype alone could lead many investors to add TXN to their portfolio simply because they don't understand the difference. TXN is also in a unique position, where in the event of a China-Taiwan conflict, it could certainly garner increased government funding.
We are currently watching three main price points.
1. $156.00
2. $167.00
3. $186.00
We are currently hitting the direct top of our Ichimoku cloud.
If we bounce here i anticipate All targets being hit within 2 months.
Especially if we see geopolitical events continue in their current manner.

TXN : Double bottom15 minutes chart.
While all the other time frames are very bearish, the 15 minutes sees a double bottom at $155 with bullish test of our emas. All the previous crosses didn't create a new price action.
Looking for that again


TXN bears appear to be exhausted from consolidationNASDAQ:TXN has been consolidating below the bottom band of the quarterly VWAP for some time. Volume indicators show bears leaving and bulls entering, and on the 1hr chart we have some nice long bull candles. It seems the price is ready to make its way back toward the top of the quarterly VWAP.

Texas Instruments WCA - RectangleCompany: Texas Instruments Incorporated
Ticker: TXN
Exchange: NASDAQ
Sector: Technology
Introduction:
Today, we turn our gaze towards Texas Instruments Incorporated (TXN), a distinguished player in the Technology sector listed on the NASDAQ. The weekly chart reveals a Rectangle pattern that has been in formation over the course of 490 days, indicating a possible bullish breakout.
Rectangle Pattern:
A Rectangle pattern typically denotes a period of market consolidation, before the price action resumes/reverses its prior direction. The pattern is characterized by price movements within a well-defined support and resistance range.
Analysis:
Previously, TXN was on a downward trend, which was halted by a consolidation phase, creating a Rectangle pattern over 490 days. This pattern, with its three touch points at the upper boundary and two at the lower, suggests a likely bullish breakout.
At present, the price is above the 200 EMA, signaling a bullish market. If we observe a successful breakout above the upper horizontal resistance level of 186.31, it could provide a promising opportunity for a long position.
In the event of a successful breakout, the price target would be situated at 226.52, representing a potential gain of about 21.60%. Please note, a minor resistance may be encountered at 200.97 en route to the price target.
Conclusion:
Texas Instruments' weekly chart displays an interesting setup with a bullish Rectangle pattern, hinting at a potential reversal of the previous downtrend. This setup could offer a beneficial long trading opportunity.
As always, use this analysis in combination with your overall market research and risk management strategy, not as direct trading advice.
If you found this analysis helpful, please consider liking, sharing, and following for more insights. Wishing you profitable trading!
Best regards,
Karim Subhieh
Disclaimer: This analysis is not financial advice and is intended for educational purposes only. Always conduct your own research and consult with a financial advisor before making investment decisions.

RectangleThis is not a perfect rectangle but rarely is anything perfect as of late.
There appears to be an M forming that has peak 2 higher than peak 1 which usually points to a Shark or a Cypher, but there is also the rectangle to think about as it has a resistance line and a support line.
Several touches (blue stars) to the support line and each touch increases the support at this level.
This looks like it will get close to the support line at least and a lot will depend on market sentiment.
No recommendation/.786 would mark a cypher/.886 and 1.113 would mark a shark.
Any pattern can fail.

TXN LongAlright, I'm comfortable with this now.
RSI divergence, Stoch RSI super strong, Deltas flipping from bear to neutral
This is still not confirmed, set a stop under 161/162 spot (or whatever your spot might be, 160 is the last low)
Buy some time, probably a month worth of theta would be good enough, maybe less depending on your general market outlook. Probably 165 strk
PT would be 168/169, take profit 1, ~172 id say at least be out half of your pos.
Let's see!

TXN LongOne of the more oversold chip stocks due to slowing forecast in recent ER.
Forming a very solid base at weekly vwap support, RSI moving up and forming a divergence on 1hr, 2hr, and 4hr.
PT would be around 171 mayyyybe 172 BUT, we would have to trade over the sellers vwap, earnings vwap, AND a higher high on daily RSI by the end of this week.
Looking at the May2023 OPEX on May19 slightly OTM calls, see what tomorrow looks like.
This is not confirmed yet! If you have a farther exp, I would say this is an opportunity to accumulate. You want to see that rollllling bottom.
If you buy with an exp of 2 weeks, give it a chance to confirm and trap some shorts to go all in.
Stop loss will be discussed in the coming days when we really talk about an entry.

TXN - long positionOn the chart we can see that there are higher highs and higher lows. The RSI indicator crossing above the 50 mark and heading upward, indicates a bullish momentum. We expect that the price will reach the resistance. As it is a strong resistance, we anticipate the price to get rejected. Next, we expect another upsloping attempt towards the resistance level. Invalidation of this theses would be if the price closes below the upsloping trendline.

$TXN ShortThere is a major imbalance here. Subjective analysis of a chart that simply looks "heavy." I like it short to 144 because there is also confluence with downward sloping MACD and an income statement headed in the wrong direction QoQ.

$TXN double bottom and ascending triangleAs per the chart, double bottom and ascending triangle on the daily. bullish with the bounce today off the ascending triangle support line..... publishing for me to reference back to

Triangle in Texas InstrumentsTexas Instruments has been consolidating for almost a year, but now there could be signs of a pending move.
The first pattern on today’s weekly chart is the series of higher lows since October as prices remained below roughly $184. The result is an ascending triangle, a potential bullish pattern that TXN could be trying to escape.
Second, Average True Range tightened to the narrowest since early 2022. Will the squeeze give way to price expansion?
Next, this week brought a lower low than last week and a higher high. That kind of outside candle could suggest buyers are getting active.
Finally, the 10-week simple moving average (SMA) is roughly equivalent to the 50-day SMA. Notice how it’s rising and starting to follow TXN higher -- a potential sign of a bullish intermediate-term trend.
TradeStation has, for decades, advanced the trading industry, providing access to stocks, options, futures and cryptocurrencies. See our Overview for more.
Important Information
TradeStation Securities, Inc., TradeStation Crypto, Inc., and TradeStation Technologies, Inc. are each wholly owned subsidiaries of TradeStation Group, Inc., all operating, and providing products and services, under the TradeStation brand and trademark. TradeStation Crypto, Inc. offers to self-directed investors and traders cryptocurrency brokerage services. It is neither licensed with the SEC or the CFTC nor is it a Member of NFA. When applying for, or purchasing, accounts, subscriptions, products, and services, it is important that you know which company you will be dealing with. Please click here for further important information explaining what this means.
This content is for informational and educational purposes only. This is not a recommendation regarding any investment or investment strategy. Any opinions expressed herein are those of the author and do not represent the views or opinions of TradeStation or any of its affiliates.
Investing involves risks. Past performance, whether actual or indicated by historical tests of strategies, is no guarantee of future performance or success. There is a possibility that you may sustain a loss equal to or greater than your entire investment regardless of which asset class you trade (equities, options, futures, or digital assets); therefore, you should not invest or risk money that you cannot afford to lose. Before trading any asset class, first read the relevant risk disclosure statements on the Important Documents page, found here: www.tradestation.com .

Texas Instruments: Don’t Rush It! 🐢With a healthy respect, Texas Instruments is advancing toward the resistance line at $158.99 slowly but surely. Soon, the share should climb above this mark and push off into the green zone between $215.90 and $237.98 to complete wave B in green before turning downwards again. There is a 33% chance, though, that the course could shift away from the next resistance line, dropping below the support at $144.49 instead. In that case, we would expect Texas Instruments to develop wave alt.IV in gray in the gray zone between $130 and $107.68 before moving upwards anew.

TXN long positionThe price is making an ascending triangle pattern so we expect the price to raise. Take the entry once the price breakout of the triangle. Look at the volume surge in order to avoid fake breakouts.
Take profit and target are shown on the chart.
Good luck
