Trade ideas


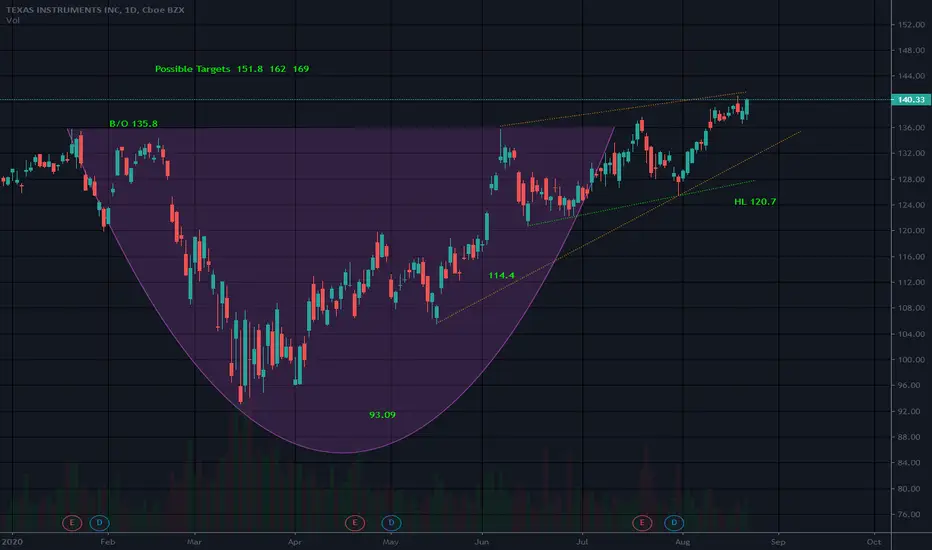
Cup and HandlePossible Rising wedge. Just beware as Rising wedges can have a bearish bias
Handle low came dangerously close to mid cup which would invalidate the pattern.
The Rising Wedge is a bearish pattern that begins wide at the bottom and contracts as prices move higher and the trading range narrows. In contrast to symmetrical triangles, which have no definitive slope and no bullish or bearish bias, rising wedges definitely slope up and have a bearish bias.
While though this article will focus on the rising wedge as a reversal pattern, the pattern can also fit into the continuation category. As a continuation pattern, the rising wedge will still slope up, but the slope will be against the prevailing downtrend. As a reversal pattern, the rising wedge will slope up and with the prevailing trend. Regardless of the type (reversal or continuation), rising wedges are bearish.
Not a recommendation

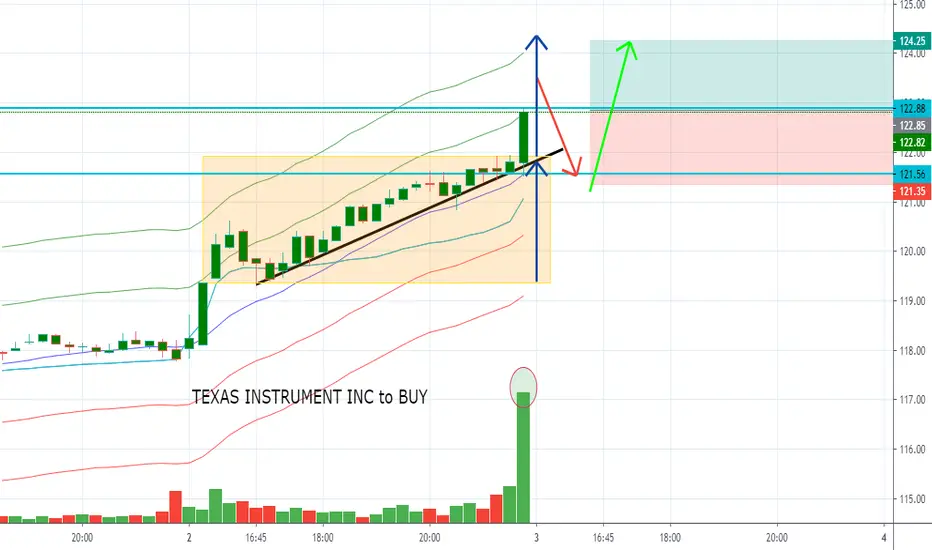
TEXAS INSTRUMENTS INC: Two in OneThere are great opportunities that must be seized. According to the tendency of the stock market, we suggest a simple process that is divided into four principals actions. The appropriate time when each postion should be taken is indicated in the given chart.
Traders who are concerned, write in comments.

TXN Round upTXN has tested a major resistance level more the six times, within the longer term on the chart it has been setting up inverse head and shoulders patterns. It had a false break out to 137 before it retraced. I expect it to break out of 133 and go back to 137, then continue rising to all time highs with 145 as a target.

TXNBased on my analysis:
1. Right now, TXN at major resistance.
2. Moreover, at fibo 1.0 from head & shoulder pattern.
3. MACD shows momentum is going down.

Inverted Head and ShouldersI see a possible inverted H&S
Neckline is Breakout
Earnings 7-21 AMC
All time high is 135.7
TXN has fallen out of it's rising wedge
This is not a recommendation. The stock has not broken the neckline, and I do not own this stock..yet (O:
Rising wedges are bearish and I do not like to trade until the stock has fallen out. Falling wedges can be very bullish and can be a reversal signal when the stock breaks from the falling wedge
There are a lot of stocks in rising wedges right now. WDAY, KLAC, LRCX, these wedges can vary in size. I have noticed they do not fall out or down very far but they can fall the width of the wedge.
Be safe!

$TXN Oversold - Buy The Dip$TXN Oversold - Buy The Dip
Texas Instruments selling off today with the rest of tech. Looking like a prime "buy the dip" candidate for a quick bounce back after holding ~$129 support area and beating earnings estimates earlier this week.
Near term target: $137.50-$140.00 range
Note: Not investment advice


$TXN Texas Instruments on verge of Major Breakout
Alert set for breakout above $136.
Possible Cup&Handle formed .
Golden cross complete on 50\200ma's
Volume bullish.
A possible earnings pop on the cards
Indicators bullish
TSM earnings and guidance last week were a blowout
and maybe a window in TXN>
PLEASE GIVE US A LIKE IF YOU FIND OUR CONTENT HELPFUL, THANK YOU.

Texas Instruments SELLStock markets will crush hard in August...
If you found this analysis useful, please like it and share it with others

TXN Inverse Head and ShouldersTXN is about to complete its inverse head and shoulders pattern. With a neckline break at 135, it can see a run up to new highs. The range of the shoulders are roughly 15points, so the range of the breakout move will be roughly 15points to the 150 area.

TEXAS INSTRUMENTS INC DIAGRAMHey investisors ,**DISCLAIMER** content on this analysis is subject to change at any time without notice, and is provided for the sole purpose of assisting traders to make independent investment decisions. TEXAS INSTRUMENT is in a bullish configuration, the sellers could try to take their shares, the solid support can be break or just make a pull back on this one.
Please LIKE & FOLLOW, thank you!

TXN - Not as prime (but potential candidate) for Call credit spread. I might be looking to enter this one as depicted.
Trade opportunity expires 23rd.

$TXN Texas Instruments No Conviction into earnings
Looks very vulnerable heading into earnings tonight .
Rejected at .5 fibonacci level and the entire sector is been sold off today.
Its a wait and see stock.


TXN: ABSORPTION/ ACCUMULATION PHASESSpecialists (DMM) absorb public selling during the noted accumulation phase and now on the dip. March toward target price of $405. How long it will take none of us mortals know?

