Mean Reversion Setup: XLK1. RSI in oversold region
2. Price likely to rebound back to the mean
Trade Rules:
Entry Trigger - RSI has cross below oversold region, enter limit buy at close price
Exit Trigger - Close at market when close price cross above exit trigger (Red Line)
Notes: Maximum of 3 open positions
Key stats
About State Street Technology Select Sector SPDR ETF
Home page
Inception date
Dec 16, 1998
Structure
Open-Ended Fund
Replication method
Physical
Dividend treatment
Distributes
Distribution tax treatment
Qualified dividends
Income tax type
Capital Gains
Max ST capital gains rate
39.60%
Max LT capital gains rate
20.00%
Primary advisor
SSgA Funds Management, Inc.
Distributor
State Street Corp. (Fund Distributor)
Identifiers
3
ISIN US81369Y8030
XLK was the first to launch in this space, as such it offers a more narrow focus on the US technology segment. Its S&P 500-only portfolio tilts away from our segment benchmark. XLK is heavily concentrated and also a few that seem like misfits, such as financial payment processers or telecom firms. Its limited selection universe excludes small-caps and most midcaps. Avoiding smaller, less-stable firms results in lower volatility and a tilt toward value compared to our broad tech-industry benchmark index, and can cause other minor performance differences. XLK held the title for a long time as the cheapest and the largest fund in its segment. Prior to Dec. 1, 2025, the fund name did not include the Issuer's name, State Street.
Related funds
Classification
What's in the fund
Exposure type
Electronic Technology
Technology Services
Stock breakdown by region
Top 10 holdings

Mean Reversion Setup: XLK1. RSI in oversold region
2. Price likely to rebound back to the mean
Trade Rules:
Entry Trigger - RSI has cross below oversold region
Exit Trigger - Close price cross above exit trigger (Red Line)

XLK Bullish Breakout: Big Tech Back in Control#XLK #long #active_management #investment_idea #stocks
We opened this long today in the premium channel (and shared the exact entry in the VIP chat). Below is the chart breakdown.
📊 #XLK — Technology Select Sector SPDR ETF
XLK is a sector ETF focused on the largest U.S. technology companies (essen

Potential Megaphone in TechTechnology stocks have been struggling, and some traders may see long-term topping patterns.
The first item on today’s chart of the SPDR Select Sector Technology ETF (XLK) ETF is the pair of diverging lines since December 22. That directionless movement is a potential “megaphone” pattern that could

Mean Reversion Setup: XLK1. RSI in oversold region
2. Price likely to rebound back to the mean
Trade Rules:
Entry Trigger - RSI has cross below oversold region, enter limit buy at close price
Exit Trigger - Close at market when close price cross above exit trigger (Red Line)
Notes: Maximum of 3 open positions

Mean Reversion Setup: XLK1. RSI in oversold region
2. Price likely to rebound back the the mean
Trade Rules:
Entry Trigger - RSI has cross below oversold region, enter limit buy at close price
Exit Trigger - Close at market when close price cross above exit trigger (Red Line)

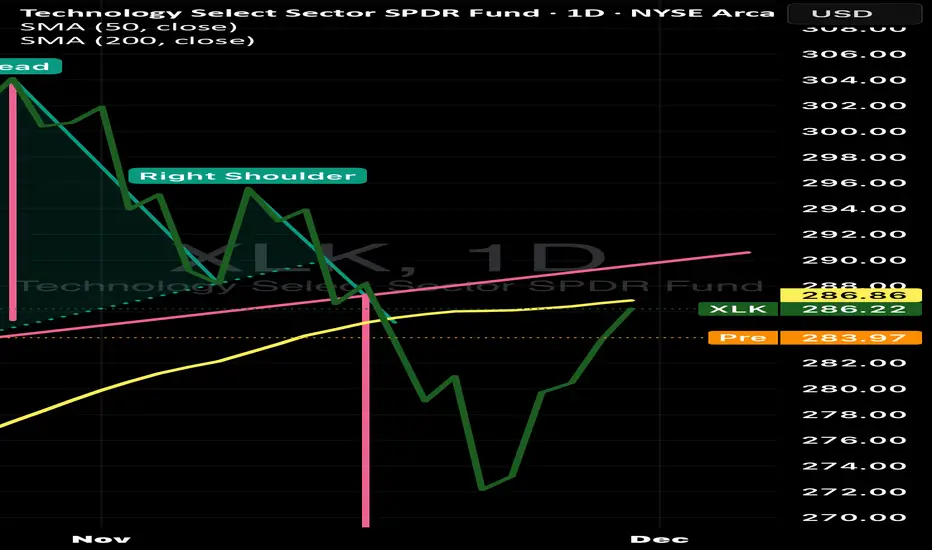
A H&S Pattern has formed in the XLK. What does it mean?A head-and-shoulders pattern usually signals a potential trend reversal from bullish to bearish.
What to watch (triggers & confirmation)
1. Neckline break on volume — primary sell signal. Wait for a daily close below $283–285 with higher volume for confirmation.
2. Retest behavior — if price brea
Sell short XLKAll details on the chart. It would be ok to wait for an 50 ma touch/cross before entering . Also Take profit zone can be extended around 200 ma.

Tech Sector Goes "Three Black Crows" — Bear Market Cont PatternThree Black Crows is a term used to describe a bearish candlestick pattern that can predict a reversal in an uptrend.
Classic candlestick charts show "Open", "High", "Low" and "Close" prices of a bar for a particular security. For markets moving up, the candlestick is usually white, green or blue. W

XLK significant technical breakdownThis is a critical moment for the Technology Select Sector SPDR Fund. XLK has experienced a **significant technical breakdown** and is now testing a crucial support zone that will determine its short-term trend.
XLK's performance is driven almost entirely by its concentration in **NVIDIA , Apple an

See all ideas
Summarizing what the indicators are suggesting.
Oscillators
Neutral
SellBuy
Strong sellStrong buy
Strong sellSellNeutralBuyStrong buy
Oscillators
Neutral
SellBuy
Strong sellStrong buy
Strong sellSellNeutralBuyStrong buy
Summary
Neutral
SellBuy
Strong sellStrong buy
Strong sellSellNeutralBuyStrong buy
Summary
Neutral
SellBuy
Strong sellStrong buy
Strong sellSellNeutralBuyStrong buy
Summary
Neutral
SellBuy
Strong sellStrong buy
Strong sellSellNeutralBuyStrong buy
Moving Averages
Neutral
SellBuy
Strong sellStrong buy
Strong sellSellNeutralBuyStrong buy
Moving Averages
Neutral
SellBuy
Strong sellStrong buy
Strong sellSellNeutralBuyStrong buy
Displays a symbol's price movements over previous years to identify recurring trends.
Frequently Asked Questions
An exchange-traded fund (ETF) is a collection of assets (stocks, bonds, commodities, etc.) that track an underlying index and can be bought on an exchange like individual stocks.
XLK trades at 139.56 USD today, its price has risen 0.25% in the past 24 hours. Track more dynamics on XLK price chart.
XLK net asset value is 139.18 today — it's fallen 4.78% over the past month. NAV represents the total value of the fund's assets less liabilities and serves as a gauge of the fund's performance.
XLK assets under management is 89.75 B USD. AUM is an important metric as it reflects the fund's size and can serve as a gauge of how successful the fund is in attracting investors, which, in its turn, can influence decision-making.
XLK price has fallen by −4.08% over the last month, and its yearly performance shows a 18.15% increase. See more dynamics on XLK price chart.
NAV returns, another gauge of an ETF dynamics, have risen by −4.78% over the last month, have fallen by −4.78% over the last month, showed a −4.83% decrease in three-month performance and has increased by 18.73% in a year.
NAV returns, another gauge of an ETF dynamics, have risen by −4.78% over the last month, have fallen by −4.78% over the last month, showed a −4.83% decrease in three-month performance and has increased by 18.73% in a year.
XLK fund flows account for −348.39 M USD (1 year). Many traders use this metric to get insight into investors' sentiment and evaluate whether it's time to buy or sell the fund.
Since ETFs work like an individual stock, they can be bought and sold on exchanges (e.g. NASDAQ, NYSE, EURONEXT). As it happens with stocks, you need to select a brokerage to access trading. Explore our list of available brokers to find the one to help execute your strategies. Don't forget to do your research before getting to trading. Explore ETFs metrics in our ETF screener to find a reliable opportunity.
XLK invests in stocks. See more details in our Analysis section.
XLK expense ratio is 0.08%. It's an important metric for helping traders understand the fund's operating costs relative to assets and how expensive it would be to hold the fund.
No, XLK isn't leveraged, meaning it doesn't use borrowings or financial derivatives to magnify the performance of the underlying assets or index it follows.
In some ways, ETFs are safe investments, but in a broader sense, they're not safer than any other asset, so it's crucial to analyze a fund before investing. But if your research gives a vague answer, you can always refer to technical analysis.
Today, XLK technical analysis shows the sell rating and its 1-week rating is neutral. Since market conditions are prone to changes, it's worth looking a bit further into the future — according to the 1-month rating XLK shows the buy signal. See more of XLK technicals for a more comprehensive analysis.
Today, XLK technical analysis shows the sell rating and its 1-week rating is neutral. Since market conditions are prone to changes, it's worth looking a bit further into the future — according to the 1-month rating XLK shows the buy signal. See more of XLK technicals for a more comprehensive analysis.
Yes, XLK pays dividends to its holders with the dividend yield of 0.54%.
XLK trades at a premium (0.02%).
Premium/discount to NAV expresses the difference between the ETF’s price and its NAV value. A positive percentage indicates a premium, meaning the ETF trades at a higher price than the calculated NAV. Conversely, a negative percentage indicates a discount, suggesting the ETF trades at a lower price than NAV.
Premium/discount to NAV expresses the difference between the ETF’s price and its NAV value. A positive percentage indicates a premium, meaning the ETF trades at a higher price than the calculated NAV. Conversely, a negative percentage indicates a discount, suggesting the ETF trades at a lower price than NAV.
XLK shares are issued by State Street Corp.
XLK follows the S&P Technology Select Sector. ETFs usually track some benchmark seeking to replicate its performance and guide asset selection and objectives.
The fund started trading on Dec 16, 1998.
The fund's management style is passive, meaning it's aiming to replicate the performance of the underlying index by holding assets in the same proportions as the index. The goal is to match the index's returns.