Tech vs Energy Stick a fork in it, it's done!
Technology CONFIRMED breakdown versus Energy.
Bear Market Rally Seems to be Over
Key stats
About SPDR Select Sector Fund - Technology
Expense ratio
0.09%
Home page
Inception date
Dec 16, 1998
XLK was the first to launch in this space, as such it offers a more narrow focus on the US technology segment. Its S&P 500-only portfolio tilts away from our segment benchmark. XLK is heavily concentrated and also a few that seem like misfits, such as financial payment processers or telecom firms. Its limited selection universe excludes small-caps and most midcaps. Avoiding smaller, less-stable firms results in lower volatility and a tilt toward value compared to our broad tech-industry benchmark index, and can cause other minor performance differences. XLK held the title for a long time as the cheapest and the largest fund in its segment.
Classification
What's in the fund
Exposure type
Electronic Technology
Technology Services
Stock breakdown by region

Insights into Market Analysis: SPDR XLK Sector trend analysisThe upward trend of XLK experienced a halt in mid-April, marked by a price breakout below the swing low at $197.3. By retracing the price action from January 2022 to October 13, 2022, a potential pattern emerges, suggesting the formation of a 'Head & Shoulders' reversal pattern.
XLK had been on an

Sector Watch4/2/24 Sector Watch:
XLK Technology
XLE Energy
XLV Health Care
XLF Financials
XLB Materials
XLY Consumer Discretionary
XLU Utilities
XLRE Real Estate
Communication Services XLC, Consumer Staples XLP, Industrials XLI.

XLK Support?Tech sector bounced off lower trend channel. Looks like it could get squeezed and a breakout setup could be near... Which way though? A downside break could mean lower lows for the summer.

XLK Price Momentum DivergenceTech printed a triple divergence on a daily timeframe today between price and MACD, with a bearish engulfing candle close.
Even if today's high holds, we are likely to see a retrace higher of this downside move in the first half of next week.
Assuming the high holds, we are likely to see a pullback

XLK - Overhead SupplyWe are in a higher time frame uptrend but risk/reward at supply is interesting.

$XLK: 195 Has MomentumTech sector ETF AMEX:XLK is showing incredible resilience following TSM earnings which is currently leading the market. I believe over the intermediate term we will see AMEX:XLK push to new highs especially with NASDAQ:AAPL trying to carve out a bottom. The green line below is from the previou

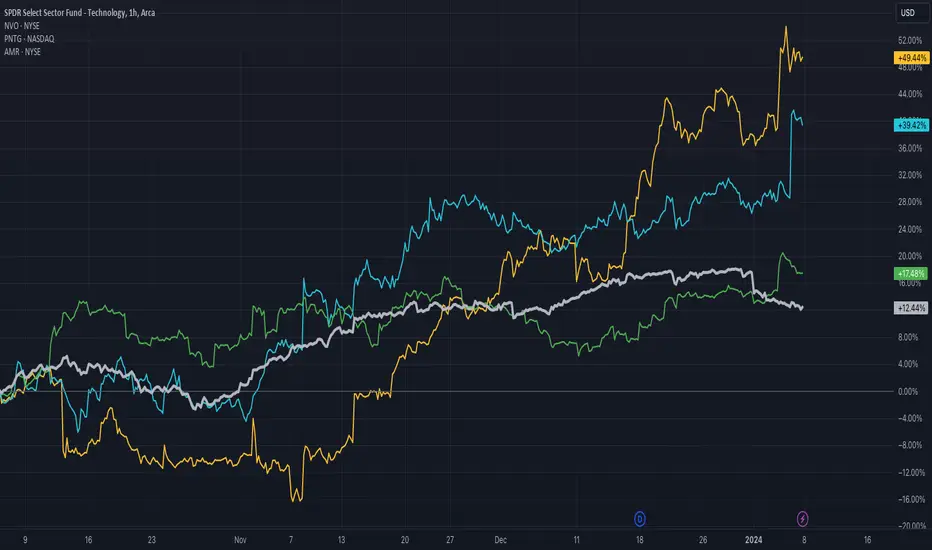
XLK vs some higher growth stocksXLK vs some higher growth stocks. Just wanted to see how the Mag7 performed against some upstarts.
12/18/23 Sector Watch12/18/23 Sector Watch:
XLK Technology
XLE Energy
XLV Health Care
XLF Financials
XLB Materials
XLY Consumer Discretionary
XLU Utilities
XLRE Real Estate
Communication Services XLC, Consumer Staples XLP, Industrials XLI.

Risk measures from relevant ratios ... Xlk analysis and some risk measures from relevant ratios in order to read parts of the market...

See all ideas