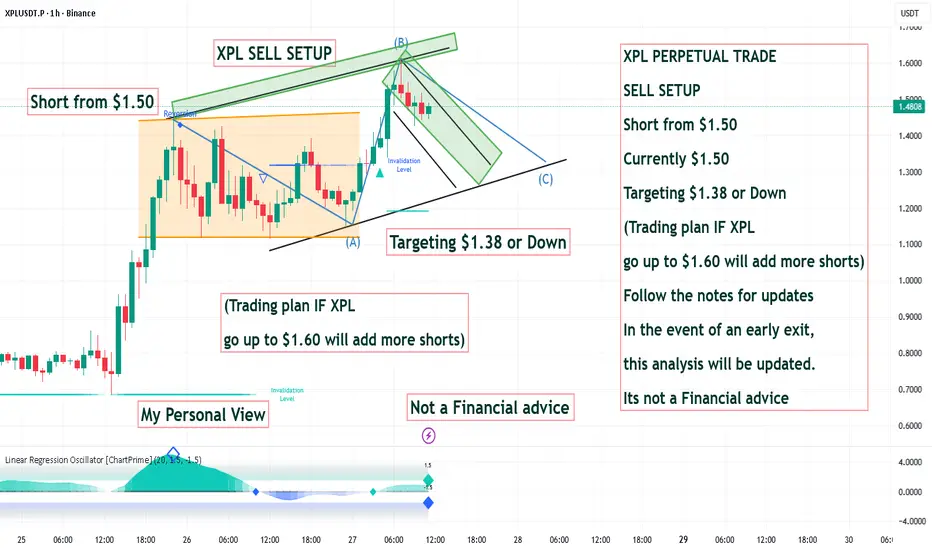
XPL PERPETUAL TRADE SELL SETUP Short from $1.50XPL PERPETUAL TRADE
SELL SETUP
Short from $1.50
Currently $1.50
Targeting $1.38 or Down
(Trading plan IF XPL
go up to $1.60 will add more shorts)
Follow the notes for updates
In the event of an early exit,
this analysis will be updated.
Its not a Financial advice
XPLUSDT trade ideas
$XPL: Ready for another Leg Up?BINANCE:XPLUSDT | 1h
Crypto markets are heating up this week with significant action. Plasma’s launched its mainnet beta, securing over $2B in stablecoin liquidity and key integrations, positioning it as a top contender in the stablecoin Layer-1 space.
The chart shows a solid upward trend, surging to a local high of $1.69, and now consolidating around $1.50
Current resistance sits near $1.65; a rejection here could push prices toward support at $1.30–$1.40. Despite a 12.3% dip, the bullish structure remains intact. If bulls hold the $1.30–$1.40 zone, momentum could drive a breakout above $1.70. A break below $1.30 might see a retest of $1.12–$1.24 area.
XPL shows strong potential with no token unlocks until next year and a leading role in the stablecoin narrative, suggesting significant upside. Will XPL shrug off this dip for another rally, or will sellers take control?

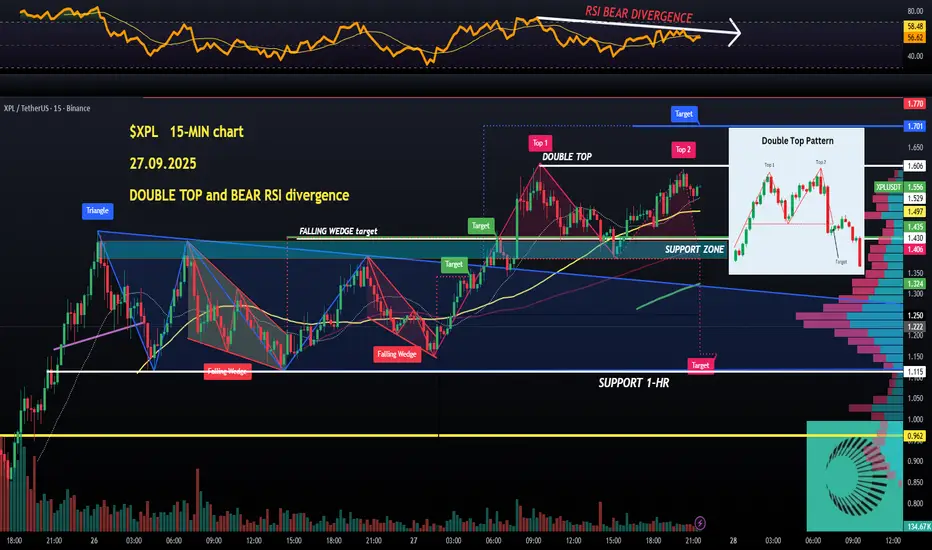
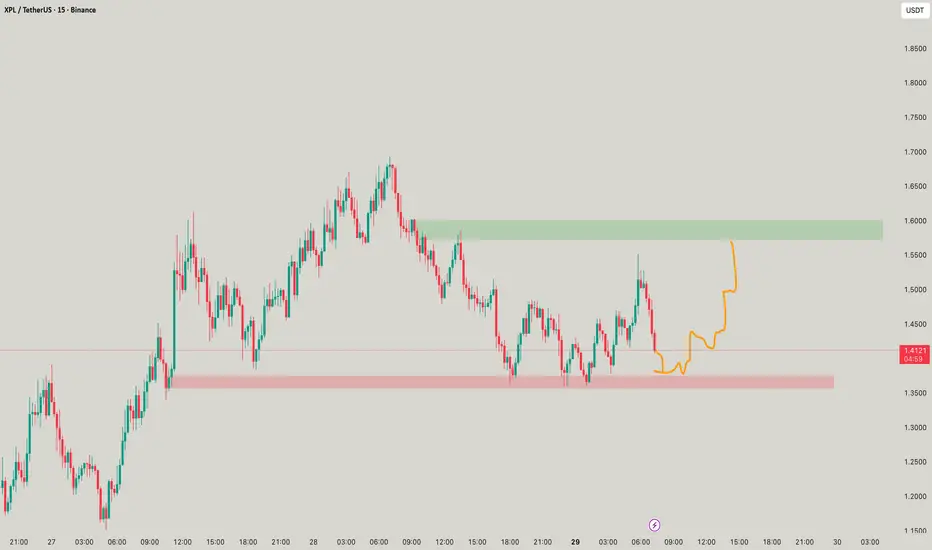
$XPL double TOP chart pattern with BEAR RSI divergence (15M)Okay, AMEX:XPL is finally showing first signs of losing steam after hitting a DOUBLE TOP with bearish RSI divergence (equal high on price, and lower high on RSI = weakening momentum).
Support zone: $1.38 (also the DOUBLE TOP's neckline, breakdown below would target $1.15) up to $1.43 (previous rejections from this level as resistance, flipped).
The double TOP doesn't mean a reversal is here, but surely works as a red flag.
I will try and buy at discount prices between $1.10 and $1.15, in case of a breakdown or another Sunday nite bloodbath.
No longs for me yet, but they will come💙👽
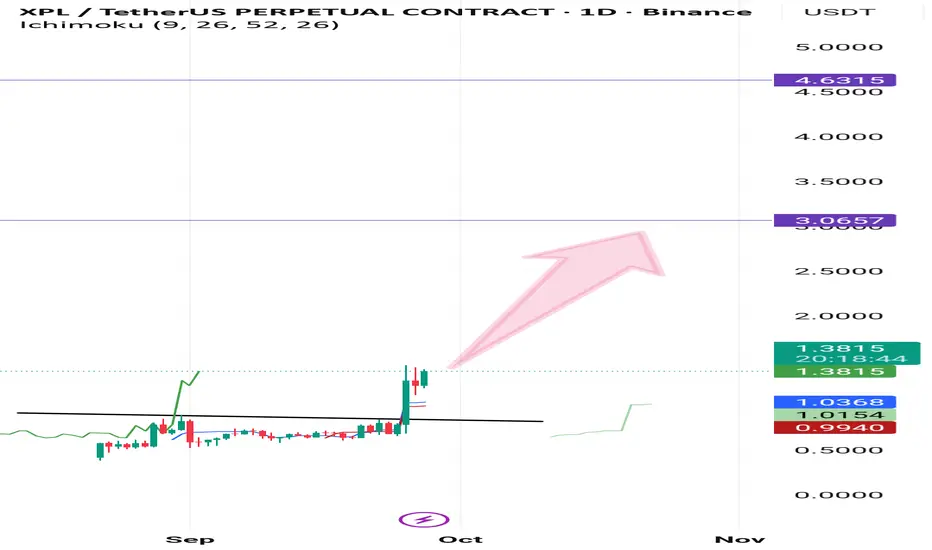
Long XPL/USDTXPL/USDT Trade Setup
Price is showing strong momentum and holding above key support. Current analysis suggests potential upside targets at 3.0 and 4.6.
Target 1: 3.0
Target 2: 4.6
As long as support levels hold, the bullish scenario remains valid. Traders should manage risk properly and adjust stops accordingly.
؟
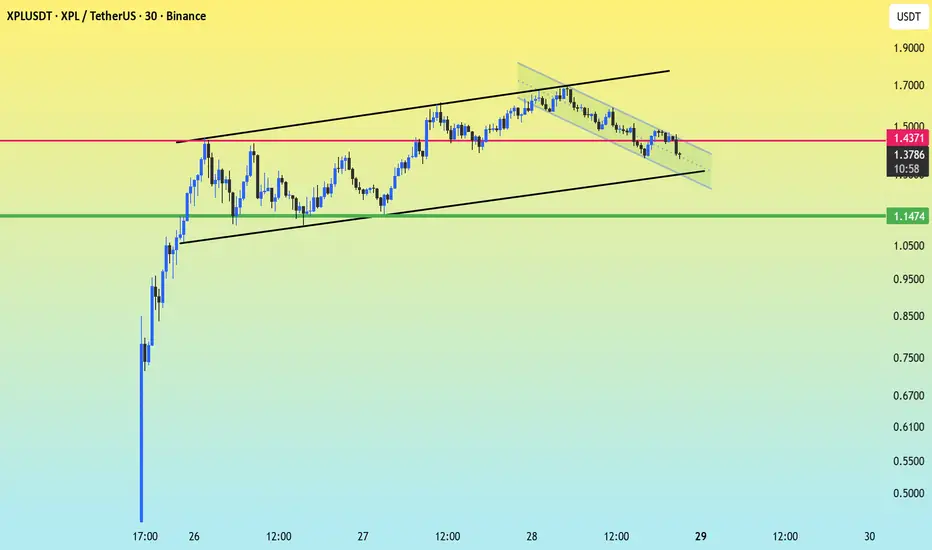
XPL : Trapped in a Channel, Targeting the $1.70 Top.The price is currently testing the lower boundary of this small corrective channel and is sitting just below the $1.4371 resistance.
After touching the top boundary of the major Rising Channel, the price began a short-term correction, forming a smaller, diagonal Descending Channel (the shaded area).
Bullish Breakout: A decisive break and close above the upper line of the small descending channel, followed by clearing the key horizontal resistance at $1.4371
TARGETS: $1.70 (Top of the major Rising Channel) 2. $1.90 (Psychological resistance)
Bearish Breakdown: A break and close below the lower line of the major Rising Channel
TARGETS: $1.1474 (The primary horizontal support - Green Line)
XPLUSDT CHART ANALYSİSWHAT IS A CRYPTO WALLET?
Cryptocurrency wallets, or simply crypto wallets, are places where
traders store secure digital codes needed to interact with a blockchain.
They do not actively store your cryptocurrencies despite what their
name may lead you to believe.
Crypto wallets need to locate the crypto associated with your address
in the blockchain, which is why they must interact with it. In fact,
crypto wallets are not as much a wallet as they are ledgers: They
function as an owner’s identity and account on a blockchain network
and provide access to transaction history.

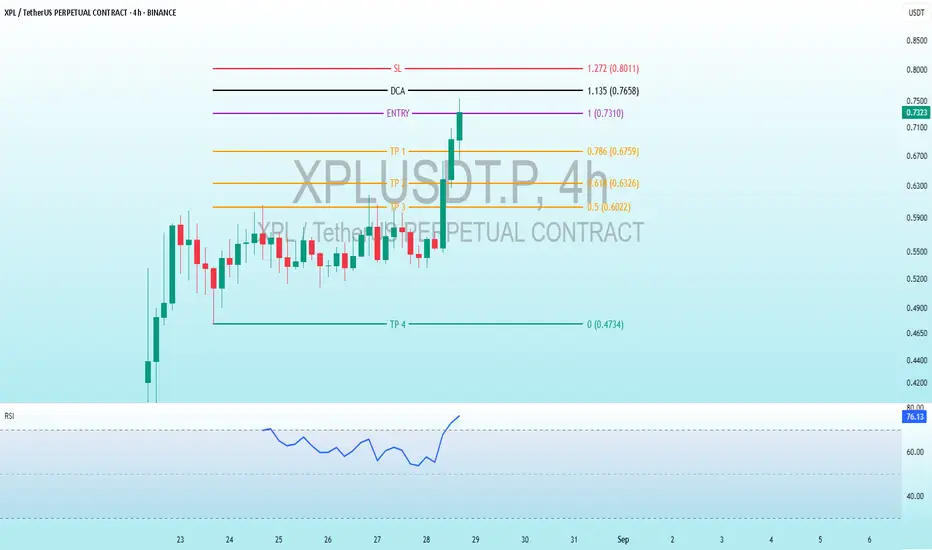
Big Breakout: $XPL Bullish Strategy for Your Gains!BINANCE:XPLUSDT.P
Big Breakout: AMEX:XPL Bullish Strategy for Your Gains!
Trading Levels
The chart indicates predefined levels for a trading strategy:
Entry: 0.7310 - 0.7330 USD - The point where the trader plans to enter the market.
SL (Stop Loss): 1.272 USD (0.8011) - A level to close the position at a loss, which seems high and might be a typographical error (could be 0.1272 or 0.7127, but clarification is needed).
TP (Take Profit): Four exit levels for profit:TP1: 0.786 USD (0.6759)
TP2: 0.618 USD (0.6326)
TP3: 0.5 USD (0.6022)
TP4: 0.4734 USD
DCA (Dollar Cost Averaging): 1.135 USD (0.7658) - A level for cost averaging, possibly for additional purchases if the price drops.
Price Analysis
The price has experienced a sharp decline earlier, reaching a low of around 0.47 USD, before recovering to the entry level (0.7310).
The current movement appears bullish, with a steady rise after a consolidation period, but the high RSI suggests a potential pullback or correction soon.
Interpretation
Strategy: The chart suggests a moderately risky strategy with good profit potential. The TP levels are set with a relatively balanced risk-reward ratio, but the high SL (1.272) seems unusual and might be an error.
RSI: The value of 77 - 76 indicates a condition nearing overbought, which may signal a pullback or correction toward levels like TP1 or TP2.
Trend: There are signs of a short-term bullish trend, but the proximity to overbought conditions might lead to consolidation or a slight decline.