XRP/USDFirst attempt at making a chart. I wanted something to refer to while watching XRP. Constructive criticism welcomed!
XRPUSD.P trade ideas
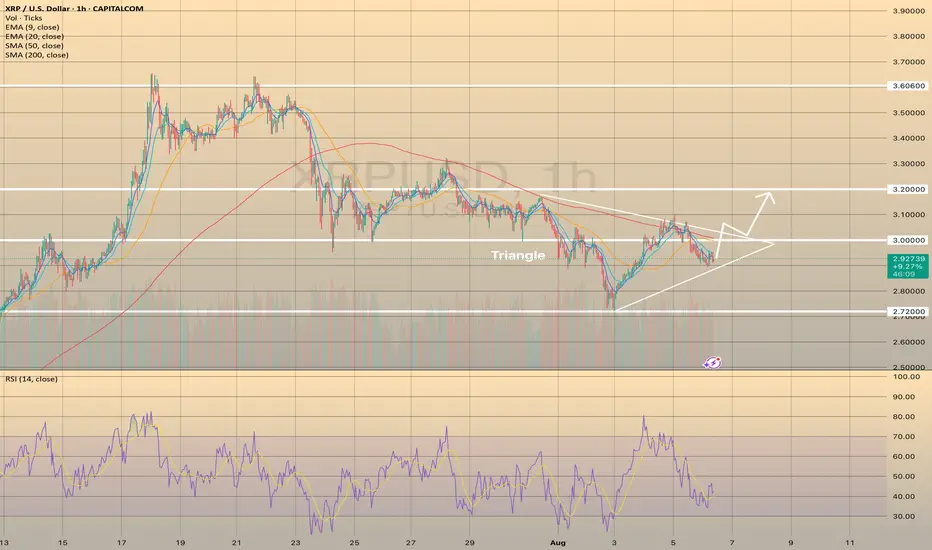
XRPUSD formed the Triangle pattern. The price may increase.XRPUSD formed the Triangle pattern. The price may increase.
XRPUSD has been declining since July 23, reaching the lowest mark at 2.72000 on August 3. Since then the price started to form the triangle pattern. It is not a reversal chart pattern, however, RSI indicator started to show some strength of the bullish momentum. In this case, if the price breaks through the SMA200 on hourly chart and holds above it and the level of 3.00000, the following rise towards 3.20000 is expected.
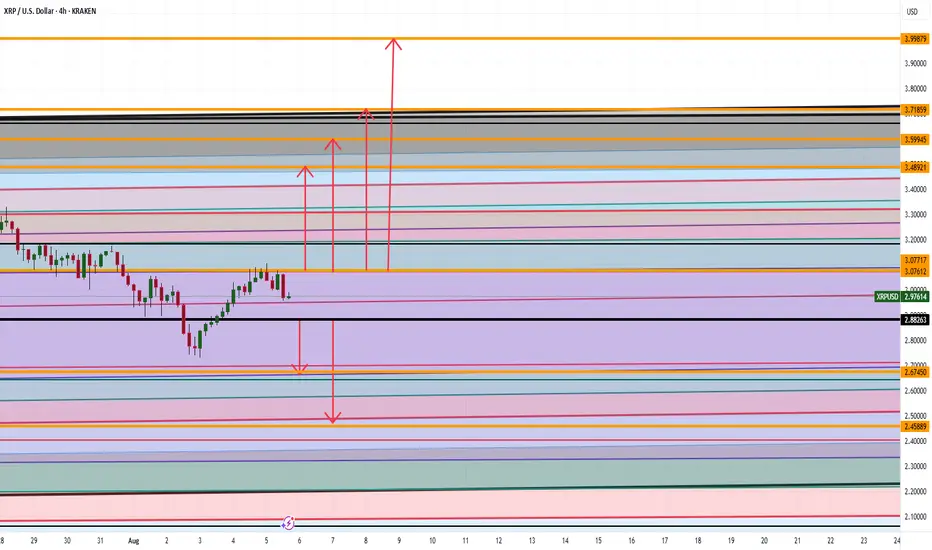
XRP ARE WE GOING TO $4 ANALYSIS Good afternoon
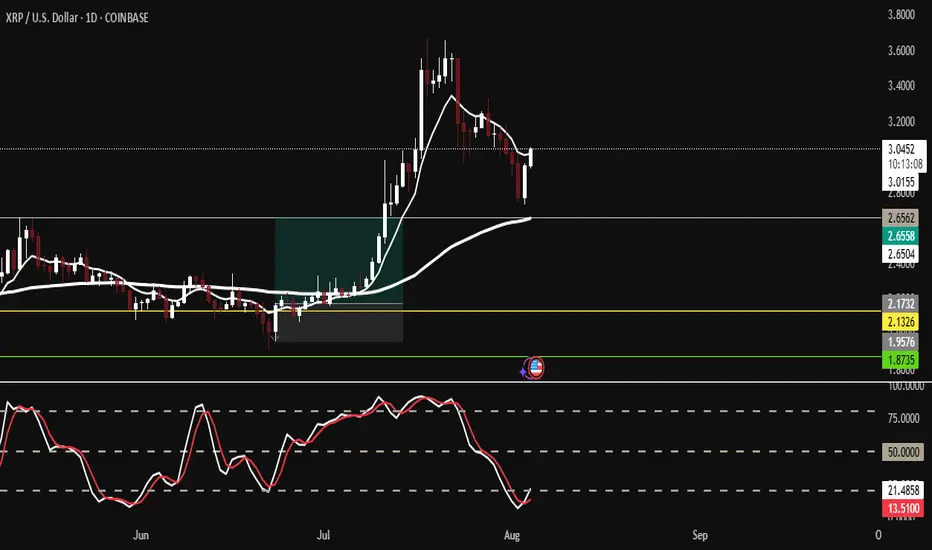
So looking at XRP we can spot a couple things :
Bullish Side: If we can break the high at 3.07 then 3.48,3.59,3.71, and 3.99 makes sense
Bearish Side: If we go below 2.88 then a drop down to 2.67 then 2.45 makes sense
Trade Smarter Live Better
Kris
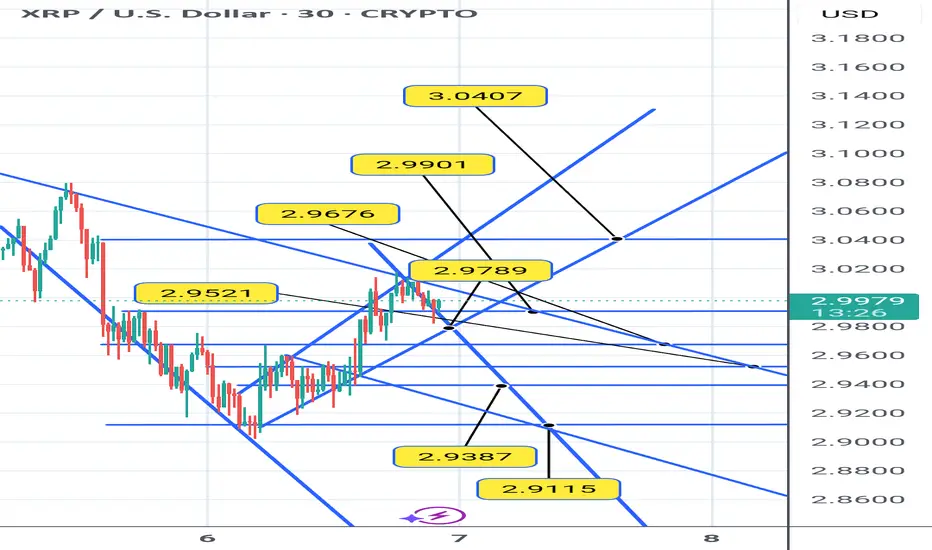
T2 bounce now confirmed. Are XRP and alts now heading to my T3?On July 23rd my chart anticipated a 25% crash. Then a bounce.
That has been now been confirmed. I have taken taken profits at the top of this current bounce on alts. But now I am anticipating Eth and alts to drop to T3?
I will post my altcoin T3 targets if/when they hold resistance below my recently hit T2 targets. But I assume alts will bottom when Eth hits my T3 target posted on July 23rd ($2950)

XRPUSD – Fade then HoldXRP saw an early-week fade from the $3.12 zone and is now trying to hold support above the 200 SMA ($2.96). RSI is gradually turning back up (44.27 to 50+ range soon), showing first signs of stabilization.
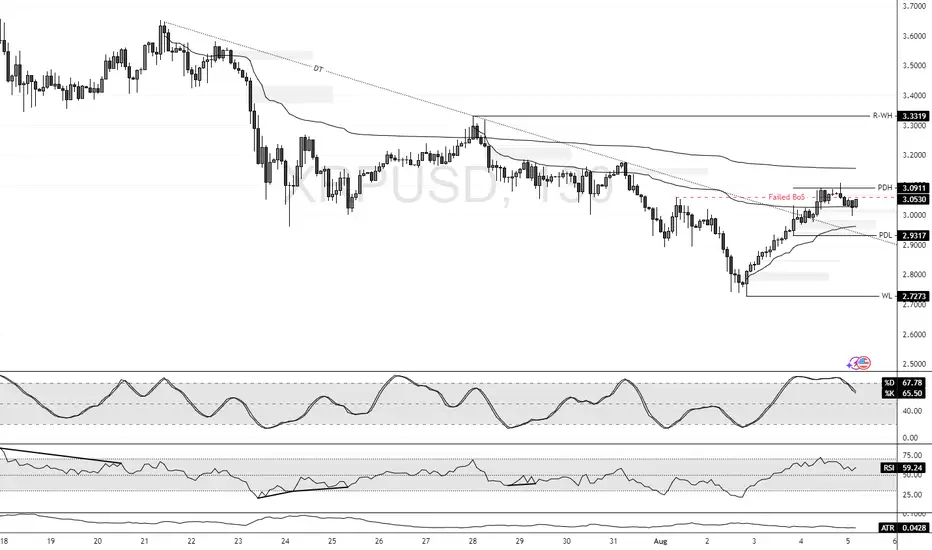
XRP's Failed Structure Break Signals Further ConsolidationFenzoFx—XRP/USD currently trades around $3.045 in a low-momentum market. Stochastic exited the overbought zone and is declining, signaling strengthening bearish momentum. The failed structure break in the New Session suggests a liquidity sweep with weak bullish interest.
Immediate resistance stands at $3.091. Technically, price is expected to decline toward the previous day's low at $2.931, a key liquidity zone. Please note that the bearish outlook is invalidated if price exceeds $3.091.
XRP ?
Hi
Don't miss 3-3.05 range
I think it's a value area for now.
Risking 0.05c only
Potential Upside as per previous analysis, AI etc
All the best
Not a guru

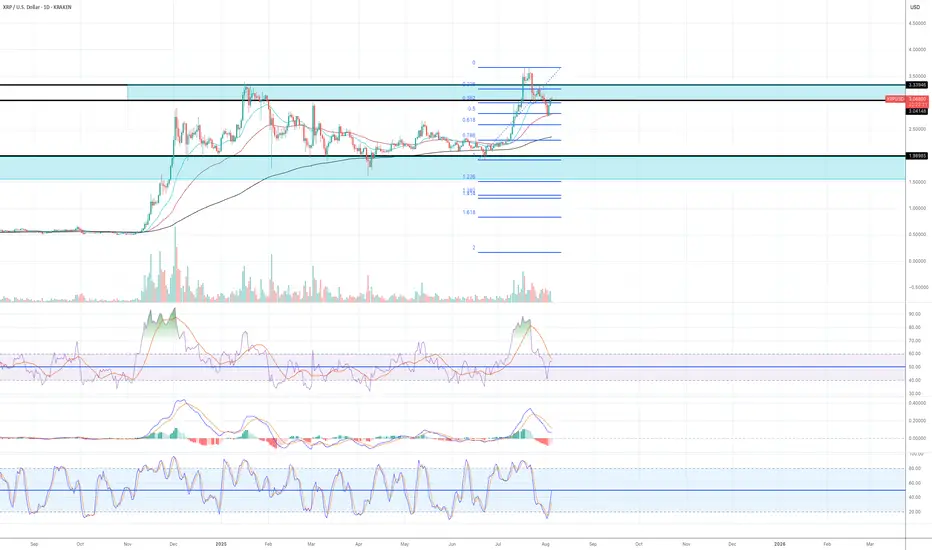
Working to move to the upsideMy views on XRP still hasn't change since my last article. The price action has been quite volatile, but if you look at it in the higher time frames such as monthly/weekly/daily, I think XRP is still working to move to the upside.
Daily:
1) The price has found the temporary support at Fib 0.5 level and EMA55.
2) yesterday's daily candle closed above $3.07 area (previous major resistance area)
3) Both RSI and MACD are still in the bull zone.
4) Stochastic has reached the oversold territory the lines have crossed and now are moving to the upside.
Vague idea of purchaseXRP after this sideways we had a median breakout if prices remain like this and there is a pullback to the next support.
It would be a huge trigger to buy until the next resistance region.
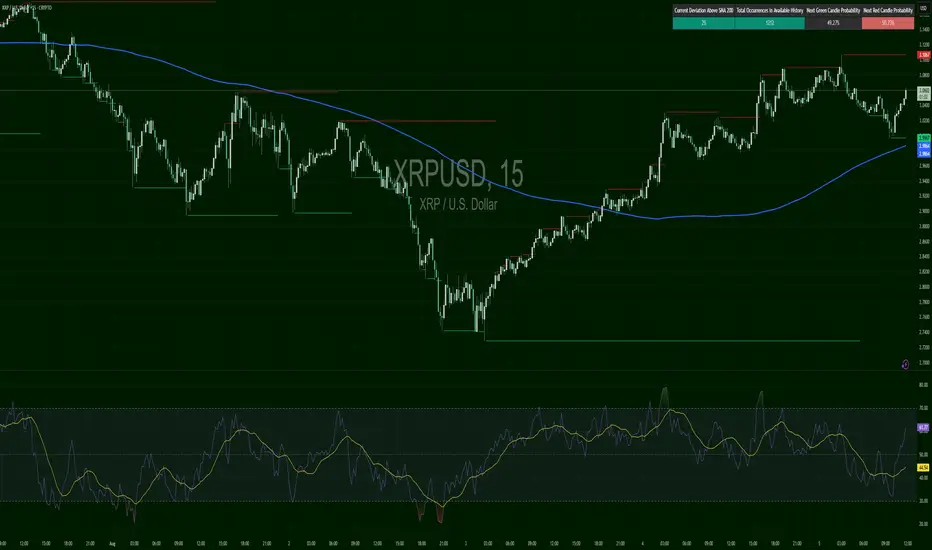
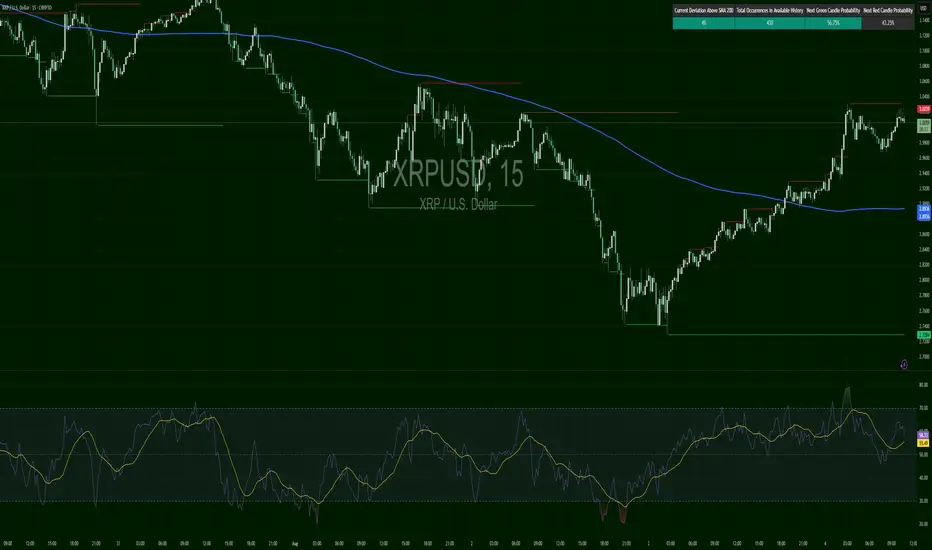
XRPUSD – Return to BattlefrontXRP lifted hard off support and is now hovering near $3.0166, just below resistance at $3.0329. RSI has surged back over 60, while green candle probability is decent at 56.69%.
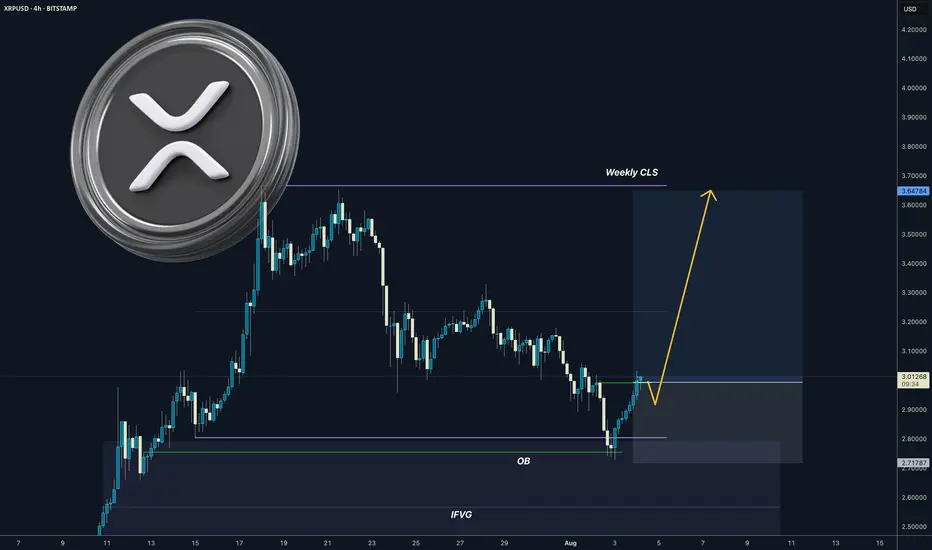
XRP I Weekly CLS I Model 1 I OB confirmations - Highs in playYo Market Warriors ⚔️
Fresh Crypto Analysis— if you’ve been riding with me, you already know:
🎯My system is 100% mechanical. No emotions. No trend lines. No subjective guessing. Working all timeframes. Just precision, structure, and sniper entries.
🧠 What’s CLS?
It’s the real smart money. The invisible hand behind $7T/day — banks, algos, central players.
📍Model 1:
HTF bias based on the daily and weekly candles closes,
Wait for CLS candle to be created and manipulated. Switch to correct LTF and spot CIOD. Enter and target 50% of the CLS candle.
For high probability include Dealing Ranges, Weekly Profiles and CLS Timing.
“Adapt what is useful. Reject whats useless and add whats is specifically yours.”
David Perk aka Dave FX Hunter
💬 Comment any Coin I ll give you my quick view
XRP - IH&SLike I said in my last post, xrp was to hit 2.80. Nailed it. Right on the money!
Now, it seems like we're printing an IH&S. No other real patters are matching up l well. We finally have some liquidity in the market to chart some rough patterns.
I'm seeing a little push up off the bottom BB - to 3.12 ish? But rejection back down to the daily pivot for the right shoulder. And acuminate there prior to any news from the SEC. And then were primed and strapped to a rocket!
But honestly, who really knows what these MM have in store. So stay light on your feet in this area.
Roll them bones for it!

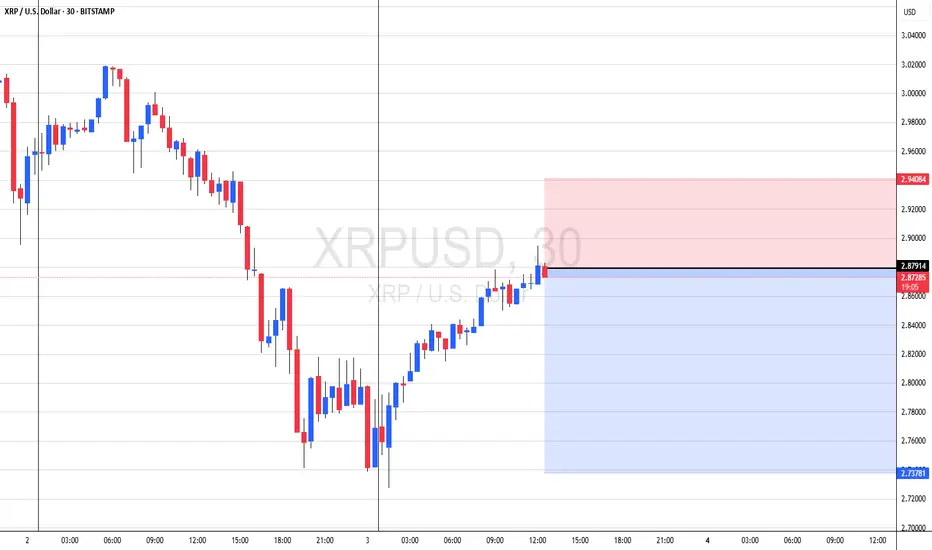
Ripple XRP Bullish Reversal📈 CRYPTO:XRPUSD dropped in 3 swings vs June low, now in buy zone $2.78–$2.47. Marginal lows still possible, but bounce expected next week from this extreme area.
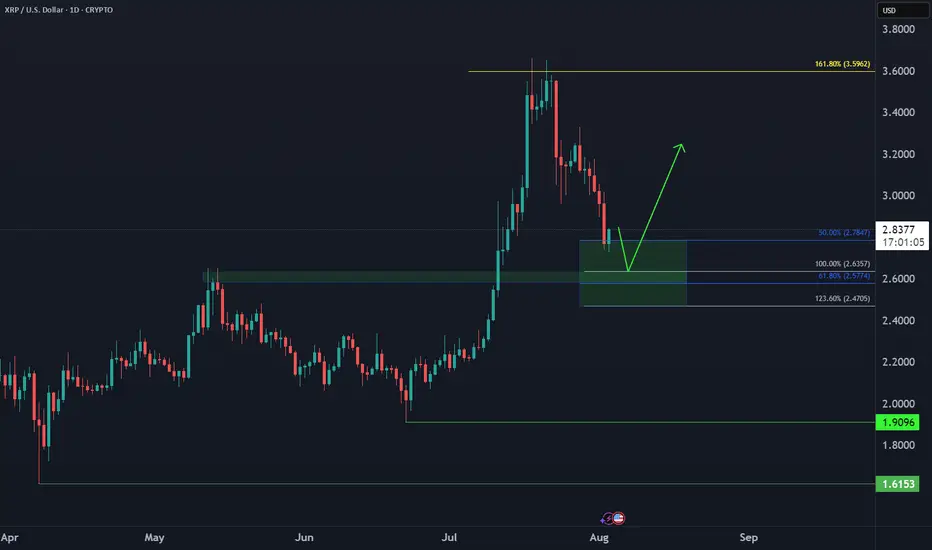
XRPUSD Is Heading Up, The Best Case Above 3.66Possibility for xrpusd as well to go up. As we have complete h4 expanding flat.
The stop could be below the low of the latest low of bullish engilfing candle. The best case we can go all the way up above the high of July 2025, 3.66.
Dont risk more than 1 % for this trade.


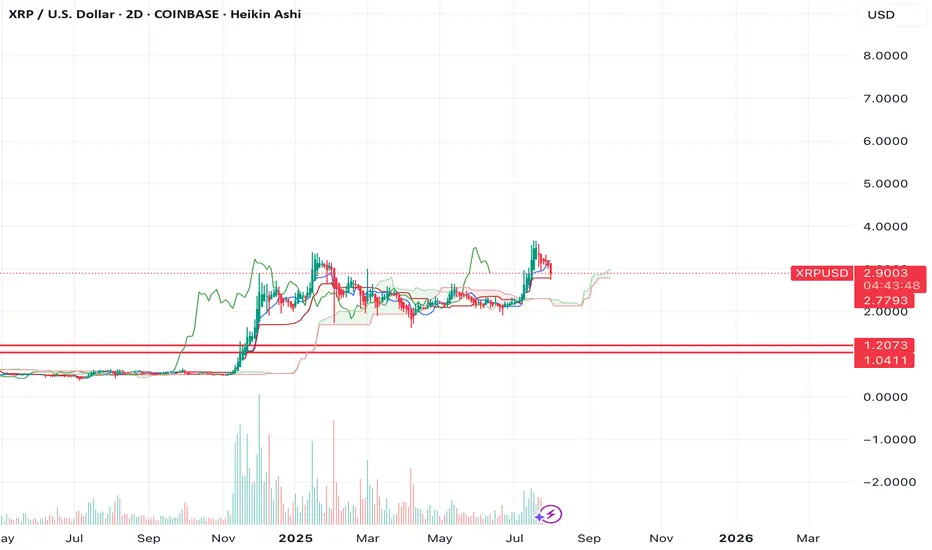
$XRP ENJOYERRRs see ya at $1.04-$1.20If we look at the chart of XRP, you can see that since the move in fall of 2024, we've had a massive lack of balance on the chart.
We ran up quickly without testing any levels as support.
That makes me think we're going to see the lack of balance get corrected and the same move is now going to happen in the opposite direction.
The $1.04-1.20 region looks like a good area of support to me.

XRP/USD Breakout Watch: $3.22 Target in SightA key blue trendline on the XRP/USD chart that reflects market sentiment. If price breaks above it with strong volume, we could see a rally toward $3.22.
Support zone: $0.55–$0.60
Bullish case: Improved sentiment, easing tariffs, and regulatory cooling
Strategy: Wait for breakout confirmation before entering
Share your thoughts — are you preparing for a breakout?

XRP VS AI ?Hi,
This is fun, come on XRP $4.95
Average Speed (Points/Day) 0.053
Retracement Amount (Points) 0.80
Retracement % 51.28%
Probability of Retracement % 5-10%
Projected Next Move Size (Points) 2.09
Next Projected High Price 4.95
Estimated Duration to Next Target 39.4 days
Projected End Date 2025-09-10
All the best
Not a guru

XRPUSD 4 Hour BottomXRP has broken out of the weekly wedge leaving a long weekly candle stick close. Price has pulled back indicating it it ready for the next leg higher. Daily candle closed bullish and 4 hour time from has double bottom.

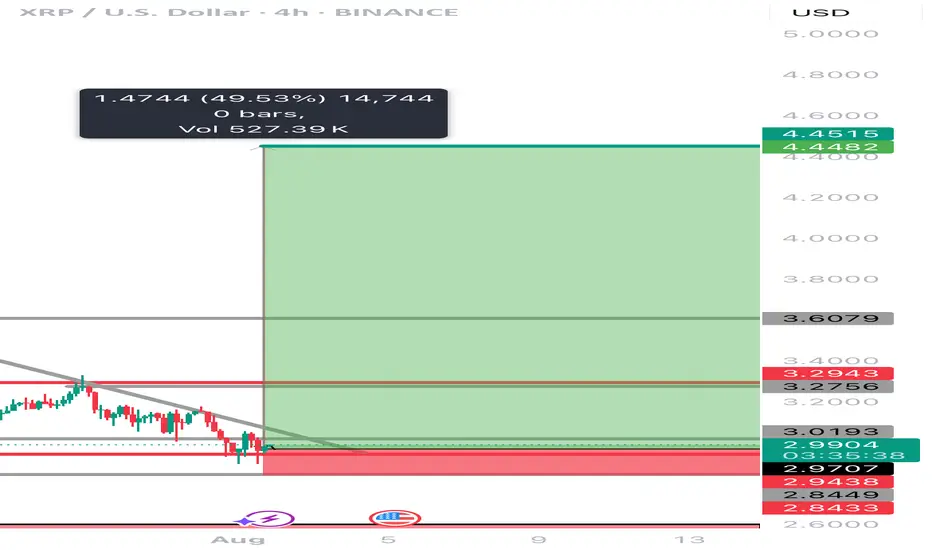
Can XRP obtain a 50% increase in the next few weeks XRP has recently been under a lot of manipulation lately! Is it time for the bulls to finally step in and move the price point on this digital asset to a 50 percent increase to another ATH at $4.45………? The world will see with the next few weeks! And why is #Bradgarlinghouse X account always following 589………..? It’s it a signal or is he just trolling
Xrp - The final bullish breakout!💰Xrp ( CRYPTO:XRPUSD ) will create new all time highs:
🔎Analysis summary:
After a consolidation of an incredible seven years, Xrp is finally about to create new all time highs. With this monthly candle of +40%, bulls are totally taking over control, which means that an altcoin season is likely to happen. And the major winner will simply be our lovely coin of Xrp.
📝Levels to watch:
$3.0
🙏🏻#LONGTERMVISION
SwingTraderPhil
