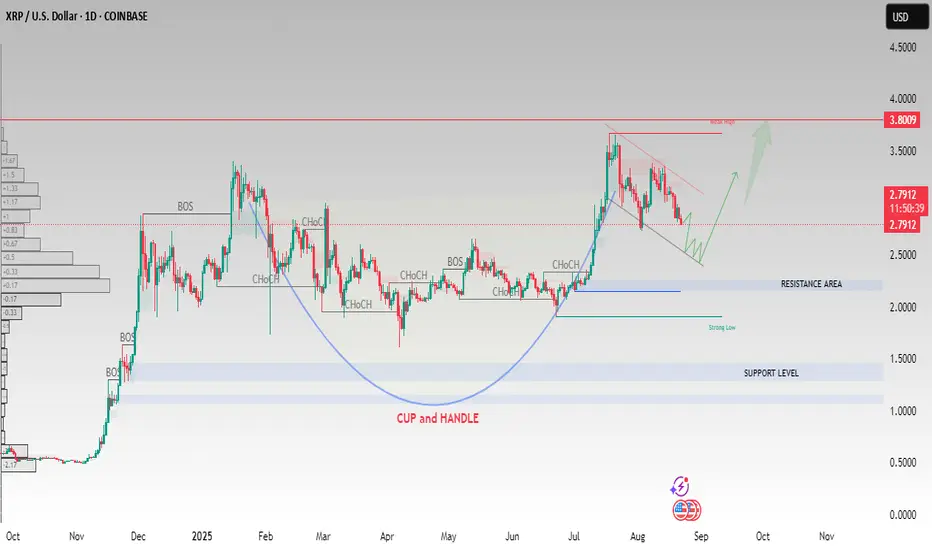
XRP/USD – Cup and Handle Formation Suggests Bullish ContinuationXRP has recently completed a Cup and Handle pattern, which is a strong bullish continuation signal often seen before major upward moves.
Key technical insights:
✅ Cup and Handle structure formed successfully.
✅ Price is currently consolidating inside a falling channel (handle).
✅ A breakout above the handle could trigger bullish momentum toward the $3.80 resistance area.
📈 If buyers sustain momentum, XRP may extend gains toward the psychological $4.00 level.
On the downside, if price fails to hold, support can be found around $2.50–$2.00 levels.
This setup suggests XRP may be gearing up for the next bullish leg if it manages to break and sustain above the handle resistance.
This analysis is for educational purposes only and should not be considered financial advice. Always manage risk properly before entering trades.
XRPUSD.P trade ideas

XRPTechnical Analysis is broken down into 4 parts:
Mental Analysis, Comparative Analysis, Risk Analysis, & Procedural Analysis.
M.A. - Why learn about candle charts and markets? Are you ready to be disciplined to manage money as well as emotions?
The markets always know what they are doing, can you see it or not, that's the real question and can you handle being wrong more than once?
C.A. - What have the markets done in the past? where is the money / liquidity? what is the direction of trade or market sentiment? These clues are strategically left behind in the 4 candles and 6 levels they leave behind. From a High timeframe to a lower timeframe, these breadcrumbs are left behind. Train the eyes to see them first and develop a theory with personal "MarketMeta" journal practice or publish of ideas on tradingview
R.A. - Risk, the only real edge to any traders plan. measuring risk & reward before a trade and waiting for that trade to happen take patience. What are the signs candles leave behind showing respect or disrespect for a level? wicks vs body of candle.
P.A. - How to proceed when a trade is entered. How to read price action in real time. Candle formation and countdown timer between timeframes. scaling up from scalp to swing or investment trades.

XRPPossible trade setup opportunity in XRP based on:
1-Price action
2-Volumen action
3-Moving averages and momentum
4-General market conditions

Xrp - Take profit targetsOn Sept 5th I suggested that Xrp would bounce to 1 of my 3 take profit targets. Target 2 has now been hit and I am trailing stops up towards T3.
Can Xrp go higher...sure. But my strategy is to take the highest probability trades so I will win way more than I lose. I don't need to ride alts to the moon, I just need to be in profit week after week, so I can keep playing this game and afford to travel the world at will.
May the trends be with you.

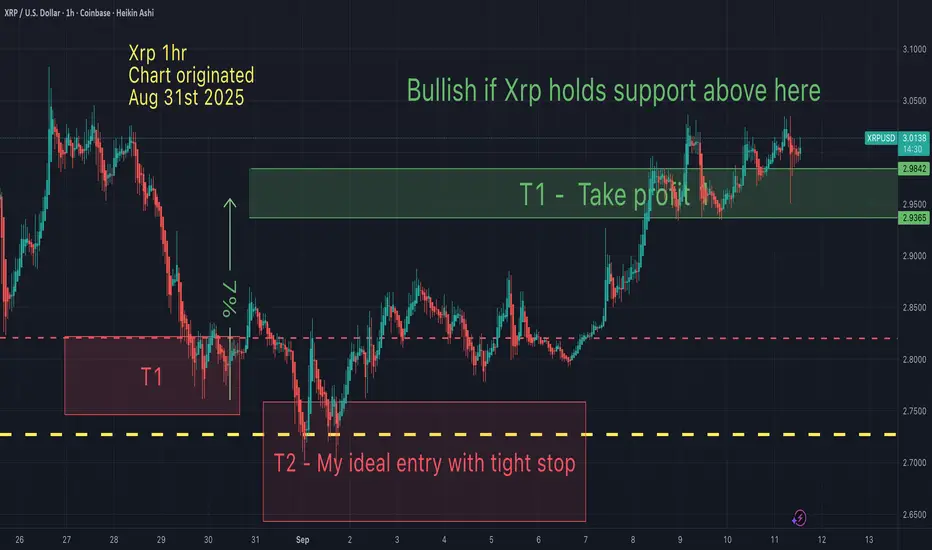
XRP - Take profit targets On Aug 31st I suggested that Xrp would drop lower (to T2) then bounce to my 1st take profit. That played out perfectly. Now the question remains, what next?
Taking some profits at this level is not a bad idea, although I do have 2 other targets slightly higher where I anticipate taking all profits. Until the 3 week down rule plays out, I continue to remain cautious.
I will post these 2 other targets in a chart to follow soon.
May the trends be with you.
XRP uptrend with signal MACD and OBVXRP will continue its uptrend, as can be seen from the green MACD bar line and there is a slow increase and the OBV signal is rising.

XRP/USD – Capped at $3.04🔴 SHORT below $3.04 – target $2.99
XRP trades at $3.01, rejected from $3.04 resistance. SMA200 sits at $2.98, acting as support. RSI dropped from 59 → 52, showing weakening momentum. Bears favored unless $3.04 breaks.
📖 Keywords: #XRPUSD #Ripple #CryptoReversal #BearishSetup #AltcoinWatch

Uptrend with MACDXRP will continue its uptrend, as can be seen from the green MACD bar line and there is a slow increase.

XRP Forms Head and Shoulders At PremiumFenzoFx—Ripple (XRP) displaced above $2.900, confirming a bullish trend. It now trades around $2.978, filling a bearish fair value gap and forming a head and shoulders pattern. On the 4-hour chart, equal lows at $2.934 and a liquidity void at $2.912 suggest a potential downside move.
Please note that $2.912 remains in the premium zone, however, it could trigger a bullish wave targeting $3.037. A break below $2.912 may extend the decline toward the fair value gap at $2.837. Traders should monitor these levels closely for bullish setups.

XRP $17The Target 3 moon mission is preparing for launch.
The #Huntvolatility funnel is well underway.
Targets 1 and 2 have already been achieved and honoured.
In my humble opinion, we are poised to exceed many people's dream level of $10.
It's important to manage your risk as we ascend...
T3 may very well be exceeded.
However, it's crucial to adhere to your own trading strategy and financial objectives.
As we all know, the crypto market is extremely volatile.
Wishing everyone good luck.

XRPOur last trade hit the SL. Now new trade was open and it already hit TP1 at 1:2 RR. Lets see how it plays out until the end.

XRP possible shortXRP could by my analysis have a short position around 2.9370 level.
P.S. That is my first post so i hope it will help anyone. I will try to share my ideas and parts of my trading journey.

1day xrp bullish pennantHard to tell which of these trendlines is the most valid top trendline and bottom trendline of this triangle/pennant so I have to include them all since any can potentially be. *not financial advice*

XRPUSD - Monthly Not Done Yet XRPUSD is looking for more with this nice almost like flag structure signaling a further breakout on the Monthly
This can be seen on the RSI in the green circles. Two peaks are created as price moves up. This pattern is repeating itself.
Very bullish, probably even leading alts into altszn

XRPUSD is following our projectionThe red pressure line is broken.
After dabbling with the L-MLH, price decided to jump back into the fork, projecting a potential huge move ahead.
But not so fast!
The slope of the white fork is super steep.
In such situations I like to throw a Modified-Shiff-Fork, or a Shiff-Fork on the chart too. This gives me often more realistic profit targets.
The trade could be managed by using the light-grey fork's centerline as PTG1 and the rest of the position aims for the white mooning centerline §8-)
A second steak of the position could be loaded, after the yellow CIB-Line is broken. I like to wait for a test of it after the crack and jump-above. It's the same like a test/retest of a Medianline-Parallel if price broke out of it.
Let's have fun here §8-)

#XRPUSDT_H4With the completion of the corrective wave (WXY) at the end of wave (IV) and in the price range of $2.60 to $2.70, an upward movement of wave (V) is likely for initial targets of $4.60 to $5.00.

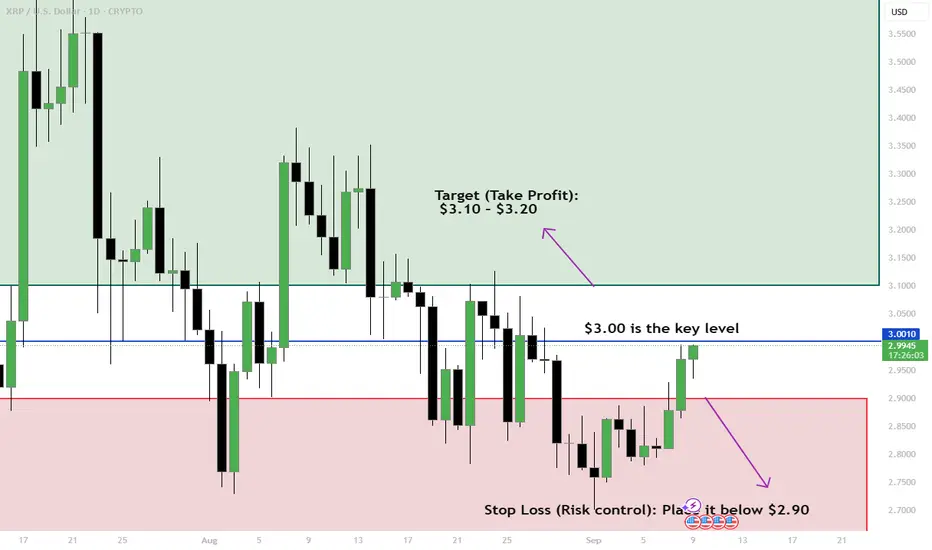
XRP Trading Scenarios (Daily Chart)Hey traders! Let’s break down what’s happening with XRP around the $3.00 level. This price area is very important right now, it could decide the next move. 🚀 or 📉
✅ Bullish Case (If XRP breaks $3.00 upwards)
What to watch: If the daily candle closes above $3.00, that means buyers are strong.
Entry idea: Wait for a break and retest of $3.00 (price goes above $3.00, then comes back down slightly to confirm it as new support).
Target (Take Profit): $3.10 – $3.20
Stop Loss (Risk control): Place it below $2.90
👉 Tip for beginners:
Don’t FOMO in! Always wait for the candle to close above $3.00 to confirm the breakout.
❌ Bearish Case (If $3.00 rejects downwards)
What to watch: If XRP fails to break $3.00 and gets pushed down, sellers are in control.
Entry idea: Look for a rejection pattern near $3.00 (long wicks, bearish engulfing, etc.) before entering short.
Target (Take Profit): $2.85 – $2.75
Stop Loss (Risk control): Place it above $3.05
👉 Tip for beginners:
Patience is key! A clear rejection will give you a safer entry instead of guessing.
🔑 Quick Reminders
Always use Stop Loss → This protects you from big losses.
Trade with a plan → Don’t jump in without knowing your entry, target, and stop.
$3.00 is the key level → Above it = bullish bias, below it = bearish pressure.
Don't forget to follow me, boost this post and comment your ideas.
-Neo
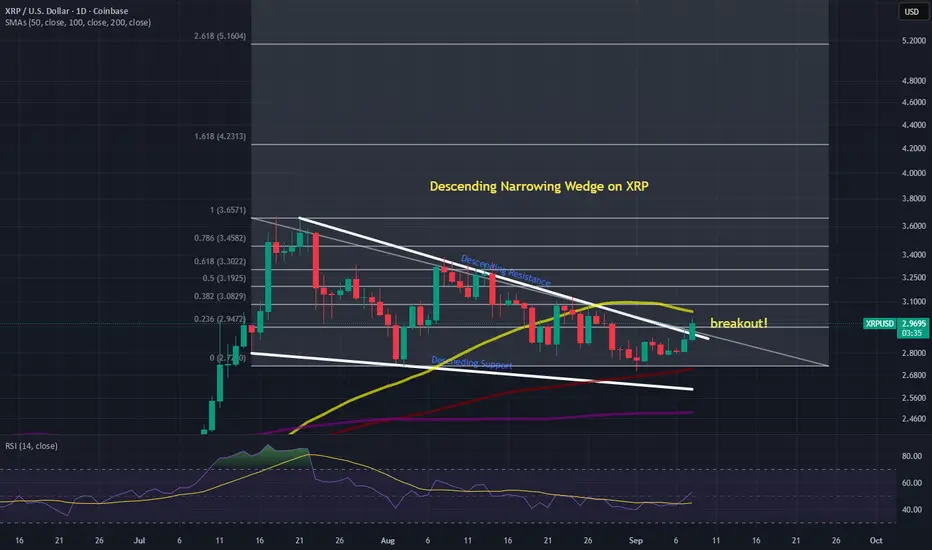
XRP Descending Narrowing Wedge Daily ChartXRP is currently breaking out of a descending narrowing wedge on the daily timeframe. XRP may meet some resistance at the 50 simple moving average as it approaches this level. I expect the price to fly after breaking this moving average. Seat belts everyone!
Not financial advice. Do your own DD.
Thanks for viewing the idea.
XRP: Lacks Momentum Despite Modest GainsRipple’s XRP is trading slightly higher today compared to last Monday, but it still hasn’t found real momentum. For now, it’s expected to continue moving upward toward resistance at $4.09 as part of turquoise wave B, before the correction of wave (2) is finally completed. The following magenta wave (3) should then drive gains above the $4.09 resistance level. If the altcoin manages to break directly above this level, this will suggest that wave alt.(2) has already wrapped up.

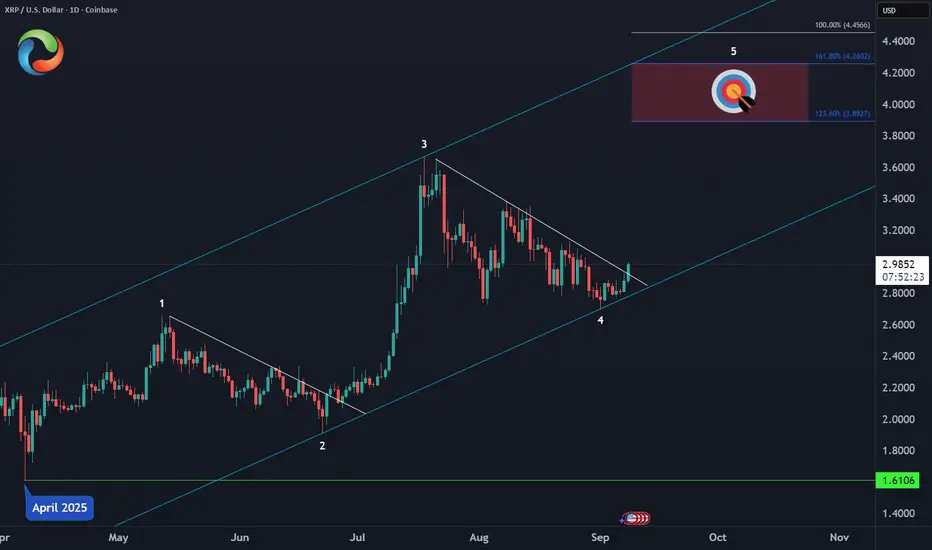
XRP – Next Upside Target🎯 CRYPTO:XRPUSD is poised to resume its impulsive cycle from the April 2025 low, with the minimum extension for wave 5 targeting the $3.89–$4.26 zone.
Structure remains constructive as long as price holds above the recent low, with potential for continuation in the coming sessions.
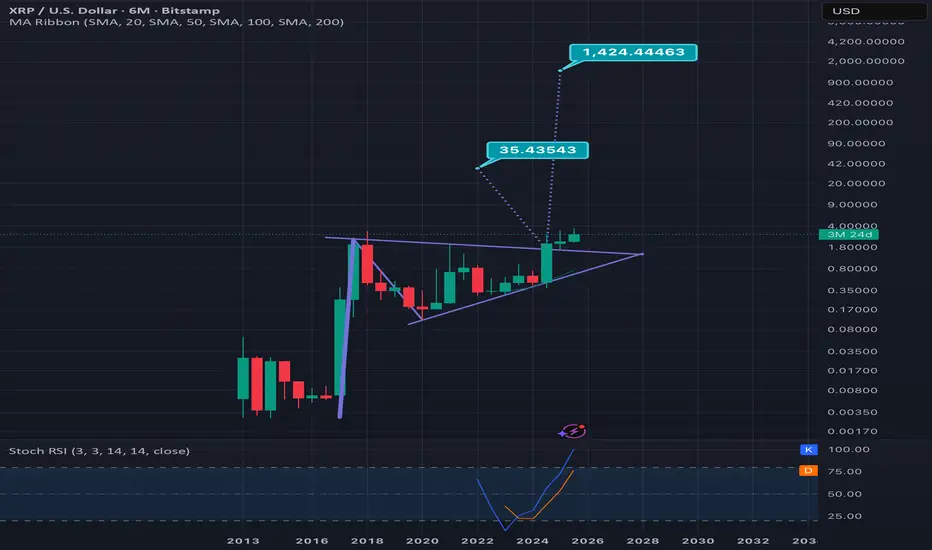
6 month log scale xrpusd chart updatedMy previous version of this chart I placed the breakout tarts arbitrarily before the actual breakout so I wanted to post an updated version with the two targets lined up directly at the point of the breakout. Smaller target is for just the triangle and the bigger target for the entire bullish pennant. Remember this being a 6 month time frame this could take several years still even to hit the highest target *not financial advice*
XRP/USD – Sharp Breakout🟢 LONG above $2.92 – target $2.95
XRP trades at $2.93, surging above SMA200 ($2.84). Resistance: $2.94–$2.95, support: $2.79. RSI climbing at 68, just under overbought. Strong momentum suggests bulls can squeeze higher unless rejected hard at $2.95.
📊 Keywords: #XRPUSD #Ripple #CryptoBreakout #MomentumTrade #AltcoinWatch
