XRP owners...BEWARE!BEWARE all XRP holders...I see bearish move coming...not bullish! The structure shows a large PB coming soon...but you do you boo.
XRPUSD.P trade ideas

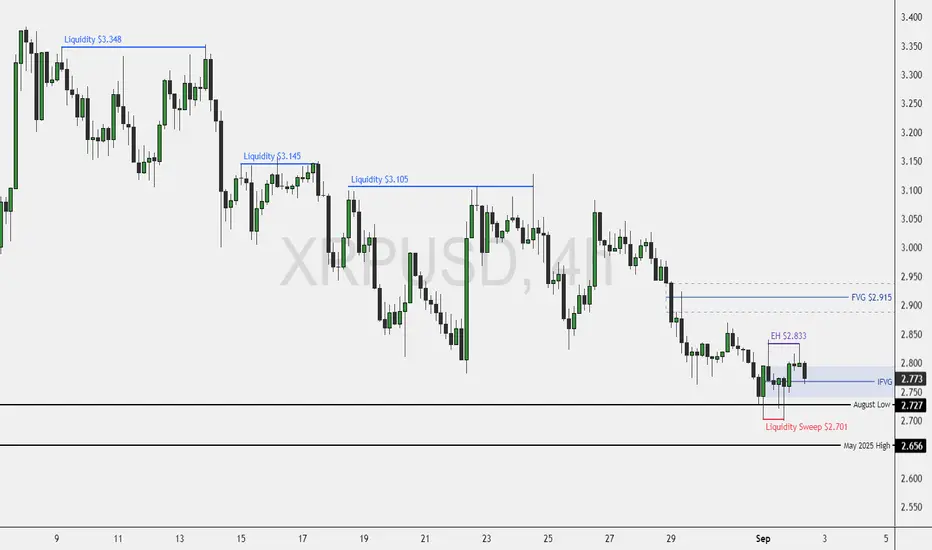
XRP: Bullish Setup Forms Above $2.833FenzoFx—XRP extended its downtrend to the August low of $2.727, briefly sweeping below. On the 4-hour chart, three equal highs at $3.105, $3.145, and $3.348 suggest a bullish setup. Immediate resistance sits at $2.833.
A bullish wave may emerge if this level is engulfed with a fair value gap, targeting $2.915. A strong exit above $2.195 could push toward $3.105 and $3.145.
XRP Wave 3/3 pendingA thought about the impending move on XRP after an expanded flat wave 2 correction

XRPUSD—Is Wave 4 near the end?Trend: Retracement of uptrend from Wave 3.
Pattern: Double zigzag (at this moment)
Remarks:
I review the EW counting, and at this moment the XRPUSD is coming to the bottom near the invalidation of wave 4 (in the blue circle). If the price breaks the invalidation level, I assume the recounting is required and need to review the EW in the bigger picture or higher TF.
Possible pattern for wave 4:
- Flat (3-3-5) - Regular/Running/Irregular
- Triangle (3-3-3-3-3)
- Double/Triple Three
- Zigzag (5-3-5) - In Diagonal (Rarely for Wave 4)
This is not a recommendation to buy or sell. Do you own analysis prior to place a trade.


WHEN NOTHING FEELS RIGHT XRP⚡ Hey hey, hope things have been well. Here with a quick and short idea for you guys, been juggling a lot lately but wanted to take the opportunity to get a quick idea out while I had the chance so thanks for stopping by.
⚡ We sit here at a time where nothing seems to feel right in a few ways, at a time when we'd expect things to be pushing with all the hype we had going for us from the crypto legislation and the break above that $3 resistance showing the strength behind the market and XRP.
⚡ That being said we've still got our rules and channels which will continue to apply regardless of sentiments and news. Can see how the last month or so we've been pulled down thanks to these two major descending channels with our second one forming after we broke out and broke away from $2.7 before we again slowly descending back to the $2.7 range where we currently stand.
⚡ Technically speaking we're at a support point, we've bounced back up from here before so it'll be a good reference point for active traders on whether or not we'll be headed for another possible breakout or if we'll continue to trend further down within the descending channel until we regain that 200 EMA.
⚡ Next few days should be pretty eventful, especially once memorial day weekend wraps up I'm sure traders will want to get active and make a move but that brings us to my next highlight.
⚡ Historically speaking September is the weakest performing month for the market, it's the month we see stocks and indexes usually stumble a bit before they recover as the new year then approaches so that should be kept in mind. I'd love to see a breakout but if not this would also be a great time to accumulate given that within the next year or two we'll more than likely be trading above that $5 and $6 range.
⚡ Have to go for now but wanted to get a quick idea out and give some reference points with these descending channels. They will either help us get a breakout or push us further if we can't break out of them so keep that in mind along with Septembers historical performance. Much as we love the present looking on the past helps identify and note many key and potential plays.
⚡ As always, thank you so much for the support and all the best till next.
Best regards,
~ Rock'

Bloody sempsI just made a research on crypto moves in Septembers and found that most septs are bloody then in Octobers market revives and jumps!
This is my opinion on xrp , price need a brief and complete retracement to mentioned area, I will all in there , I suggest you all to turn off your PCs and enjoy last summer moments

XRP Is Ready For Blast Off!I foresee a big pump coming for XRP. When support is found, the big picture accumulation pattern should take us soaring to new all-time highs in a mass adoption phase. I am very excited about this coin and firmly believe we will see a strong run. Based on fractal analysis, it looks very similar to its first accumulation fractal.
As always, stay profitable.
- Dalin Anderson

XRP Critical Levels to Play This MonthHello I am the Cafe Trader.
This weekend we are shifting focus into the crypto market for a quick overview. If you read my last XRP article, we nailed the bottom for longs, and the sellers for a great positional play. This time we are going to analyze the current failed breakout.
Are Bulls Trapped? Does this still have room to leg up?
Point 1
We can start with the trend break. Massive buyers pushed this move higher, giving XRP a relatively quick All time high, But July 23rd shorts were able to shove this back inside of the previous high.
This signifies that there are bulls trapped, but the interesting thing to note is that the volume has reduced significantly since the last two ATH's. So this also would indicate a lack of buying interest at the highs.
Buyers are just not willing to to get involved with the same conviction as before (yet). No buyers, no continuation (even if there is not many sellers/profit takers).
Point 2
Strong buyers proved their interest with a "hot" reaction at $2.95.
With no "real" seller coming into this market yet, there is nothing stopping this continuation from legging up (so far).
Therefore I stand bullish, and am looking for a move up to $4.64 as a Target.
Point 3
Buying into this can feel tricky, your first entry for a classic two bar trend break would've been at the top of demand. I do think we will get another opportunity here, I definitely would not chase this, because it could play this range for a while before another leg up.
Setup
Trend break continuation.
Entry 3.13
Stop 2.65
Exit TP 4.64
Risk to Reward 3.1
If there is a close below these strong buyers, this could com all the way back down to 2.15-2.3 at least.
The reason for the wider stop here is because we don't want to get swept and then ran. A more conservative stop could be $2.85 which would be a 6R trade. Take your pick
Long Term
If you are late to the party on XRP (I know many are) here are some entries according to your sentiment:
Almost FOMO = 3.13
Aggressive = 2.95
Good price = 2.15-2.3
Steal = 1.60 - 1.93
That's all for XRP. We are going to be looking at Ethereum ETH Next.
Thanks for reading and happy trading!
@thecafetrader

Bearish Continuation With Bounce RiskTrend: Overall bearish across 30m → 1D. Price continues making lower highs/lows, hugging the lower Bollinger Bands.
📊 Momentum: RSI oversold on lower TFs (5m/15m) → possible small relief bounce, but no strong bullish divergence yet.
🔑 Levels to Watch:
• Support: $2.70 → $2.65. Break below = continuation to $2.60–2.62.
• Resistance: $2.77 (BB basis 30m/1H). Needs reclaim to flip short-term bullish.
⸻
Trade Setups
• Base Case (Bearish):
• Entry: Breakdown <$2.70
• Target: $2.65 → $2.60
• Stop: ~$2.75
• R:R ≈ 2–3x
• Alt. Bounce Play (Riskier):
• Entry: $2.72–2.70 support hold
• Target: $2.77–2.80
• Stop: $2.68
• Scalper’s bounce only — trend still bearish
⸻
⚠️ Bias: Sellers in control unless $2.77 is reclaimed. Watch volume reaction at $2.70 for next move.

$XRP E Wave Time multiplier = E Wave Percentage Multiplier?
CRYPTOCAP:XRP 's E wave, starting 11/14/24 at the 2/1 .236, currently shows about a ~7x time multiplier compared to the Origin's 63-day E wave. Waves A-D have a ~2x multiplier. A % change matching the Origin's E wave = the 3/2 Golden Pocket at $56.66-$62.48. Time multiplier = much higher?

XRP BUllish FlagConsolidation triangle trap. It wants to break out but where?
With upcoming news of a weakening dollar it seems that a lot of stocks and crypto will begin to break out of the range for newer highs.
There will be a short window of a money grab when the highs are hit.
Just brace for a break out to the bullish side but it will be short lived.

XRP Weekly ChartSee if it breaks out of this range, holding up for now.
Clean range below here back down to $2.
Will XRP Break $5 in Q4? Analysts Spot Bullish SetupXRP is trading near an important support zone, with traders watching for signs of direction. Analysts are weighing two key scenarios: either a continued rebound or a deeper pullback in early September. Market structure, on-chain activity, and regional demand are all being considered as the final quarter of the year approaches.

Bearish vibes on $XRPXRP’s decline from $2.48 has already begun, and the charts suggest continued downward pressure. Selling pressure has dominated recent price action, with rallies failing to gain traction. The market structure points to further weakness ahead, with lower price zones likely coming into play as the downtrend continues to unfold.

XRP/USD 1D Chart ReviewFormation
The chart shows a narrowing symmetrical triangle (orange lines).
The price is now in the lower part of the triangle, with support around $2.80–2.79.
If the price breaks out of this consolidation, we could see a larger trend move.
Supports
$2.80–2.79 – local support (lower line of the triangle).
$2.63 – strong horizontal support, reinforced by the earlier rebound.
$2.46 (SMA200) – key intermediate-term level.
Resistances
$3.00–3.08 (SMA50) – first major resistance.
$3.17 – next barrier.
$3.42 – strong resistance from July.
Indicators
MACD: below the 0 line, negative histogram → bearish signal, but no strong downward momentum yet.
RSI (41): close to the oversold zone, but still neutral-weak – no clear divergence.
SMA50 (red) is falling and is above the price → selling pressure.
SMA200 (blue) is rising and acting as medium-term support.
Scenarios
Bullish – a rebound from the lower boundary of the triangle (2.80) and an attack on $3.00–3.08. A breakout from the upper boundary of the formation will open the way to $3.42.
Bearish – a breakout below the $2.80–2.79 zone → a test of $2.63 and deeper into $2.46 (SMA200).
Summary
The market is at a critical juncture – price is squeezed within the triangle, indicators are neutral-weak, and volume is decreasing. A breakout from this consolidation (most likely in early September) will set the course for the next move.
👉 If you're trading short term, maintaining the $2.80 level is key.
👉 If you're trading medium/long term, only a break above $3.08–3.17 will provide a strong bullish signal.

XRP. Short term pain followed by a Weekly Wave 5 to $5.20.For me this bull market we're in started on 26th Oct 2024 when the market cemented its prediction of a Trump win at the US elections. Before Trumps win XRP was in limbo. A win for the Dems and Gensler would still be at the SEC, XRP would still be under $1.
Monthly Wave 1 - $0.48 to $3.40:
Wave 1 was frantic especially in the early stages, fueled by euphoria. Corrections were brief as XRP raced to catch up for lost time.
Monthly Wave 2 - $3.40 to $1.61 (the 0.618 retrace was $1.60)
I believe we're currently in a Monthly Wave 3:
Wave 1 - $1.61 to $2.65
Wave 2 - $2.65 to $1.90
Wave 3 - $1.90 to $3.66
Wave 4 - $3.66 to....
Wave 4 looks to be a Zig Zag (descending a-e, a-c, a-e), and as of today 14th Aug we appear to be in the 2nd half of this correction.
My predictions?
Wave 4 will end around $2.65 but I wouldn't be surprised to see the wick as low as $2.55 (Wave 1 closed the day here despite reaching $2.65)
Weekly Wave 5 and the Monthly Wave 3 end to reach the 1.618 extension of our Monthly Wave 1 at $5.20 withe the potential for a massive end of year blow off top. Having said all this I wouldn't be surprised to see Wave 3 extend in which case my target would be $8.10 which is a further extension of Wave 1.

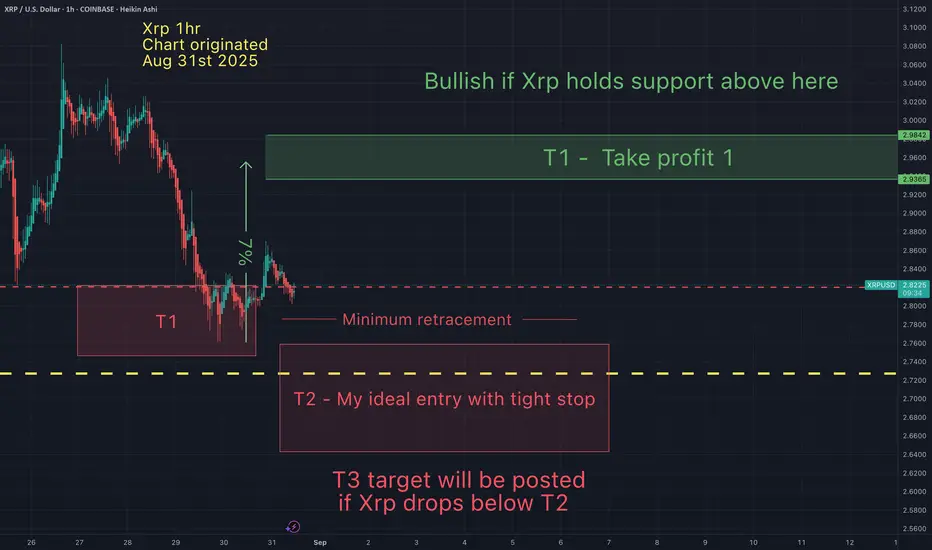
Xrp - Support and resistance & my take profitsThese are my Xrp support and resistance & my take profits. I've been patiently waiting for price to come to me. Now that my T1 has been hit, I'm hoping for a swipe of those lows for my ideal entry. I am cautiously bullish, because there is a chance Xrp goes one leg lower. For now I will chance a long from T1 and T2 (with tight stops) and take profit at my green T1 box.
XRP update all time frames XRP/USD – Bearish Bias, Watching 2.80 Support
XRP continues to trade in a downtrend across multiple timeframes.
🔹 Daily / 4H:
• Price below mid-Bollinger → bears in control.
• RSI < 40, weak momentum.
• Key support: 2.80 → break = 2.75–2.70.
🔹 1H / Lower TFs:
• Rejections at 2.83–2.85.
• Weak bounces near 2.81 but sellers dominant.
• Volume favors downside moves.
📉 Bias: Bearish unless 2.85–2.90 is reclaimed with strong volume.
⚠️ Break below 2.80 opens 2.75–2.70.
✅ Relief bounce possible only above 2.85 → targets 2.93–3.00.
XRP Next Extreme Area to Watch📉 CRYPTO:XRPUSD correction from the July peak is unfolding as a double three structure, with price still likely to test the $2.5–$2.2 zone before bulls return.
This area aligns with key Fibonacci symmetry and prior support, making it a potential launchpad for the next leg higher.
Let the structure complete then watch for confirmation.

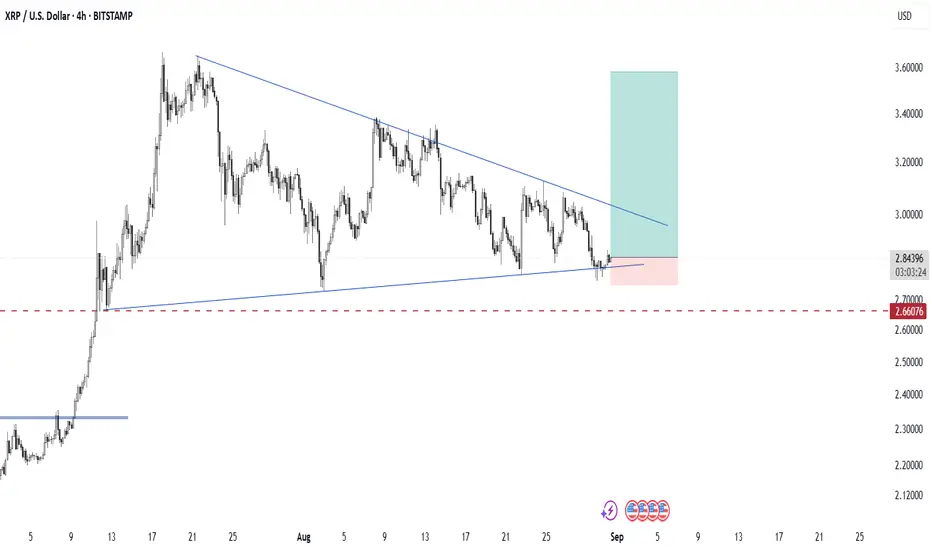
XRP 4H PatternXRP is currently consolidating within a symmetrical triangle pattern, with price action forming lower highs and higher lows. This indicates a period of compression where volatility is decreasing, and a potential breakout could be approaching.
At the moment, the price is testing the lower boundary of the triangle, showing signs of support. As long as XRP holds above the $2.66 support level (highlighted by the dashed red line), the bullish scenario remains valid.
Pattern: Symmetrical Triangle (continuation/neutral pattern)
Entry Zone: Current support trendline near $2.18–$2.20
Stop Loss: Below $2.66 support zone
Target Zone: $3.40 – $3.60 (upper projection of the triangle)
📌 A confirmed breakout above the descending trendline could trigger strong bullish momentum, while a breakdown below $2.66 would invalidate this setup and open the door for deeper correction.
Ripple ( $XRP ) is literally the reflection of 2017The current wave movements of XRP appear to be a reflection of the period from 2013 to 2017. We are in a re-accumulation phase before the next major upward wave.

XRP/USD: Potential Bullish BreakoutXRP/USD is currently in a consolidation phase, holding strong above the support level at $2.75. We have also observed a positive divergence on the RSI, which is holding within a similar consolidation pattern. This suggests a potential shift in momentum.
Trade Plan:
Support: $2.75
Target: $3.80
Entry Options:
Aggressive Entry: A buy entry can be considered around $2.80.
Safe Entry: For a more conservative trade, wait for a confirmed breakout and retest above $3.01.
This is not financial advice. Always do your own research before trading.
