XRP. Short term pain followed by a Weekly Wave 5 to $5.20.For me this bull market we're in started on 26th Oct 2024 when the market cemented its prediction of a Trump win at the US elections. Before Trumps win XRP was in limbo. A win for the Dems and Gensler would still be at the SEC, XRP would still be under $1.
Monthly Wave 1 - $0.48 to $3.40:
Wave 1 was frantic especially in the early stages, fueled by euphoria. Corrections were brief as XRP raced to catch up for lost time.
Monthly Wave 2 - $3.40 to $1.61 (the 0.618 retrace was $1.60)
I believe we're currently in a Monthly Wave 3:
Wave 1 - $1.61 to $2.65
Wave 2 - $2.65 to $1.90
Wave 3 - $1.90 to $3.66
Wave 4 - $3.66 to....
Wave 4 looks to be a Zig Zag (descending a-e, a-c, a-e), and as of today 14th Aug we appear to be in the 2nd half of this correction.
My predictions?
Wave 4 will end around $2.65 but I wouldn't be surprised to see the wick as low as $2.55 (Wave 1 closed the day here despite reaching $2.65)
Weekly Wave 5 and the Monthly Wave 3 end to reach the 1.618 extension of our Monthly Wave 1 at $5.20 withe the potential for a massive end of year blow off top. Having said all this I wouldn't be surprised to see Wave 3 extend in which case my target would be $8.10 which is a further extension of Wave 1.
XRPUSD.P trade ideas

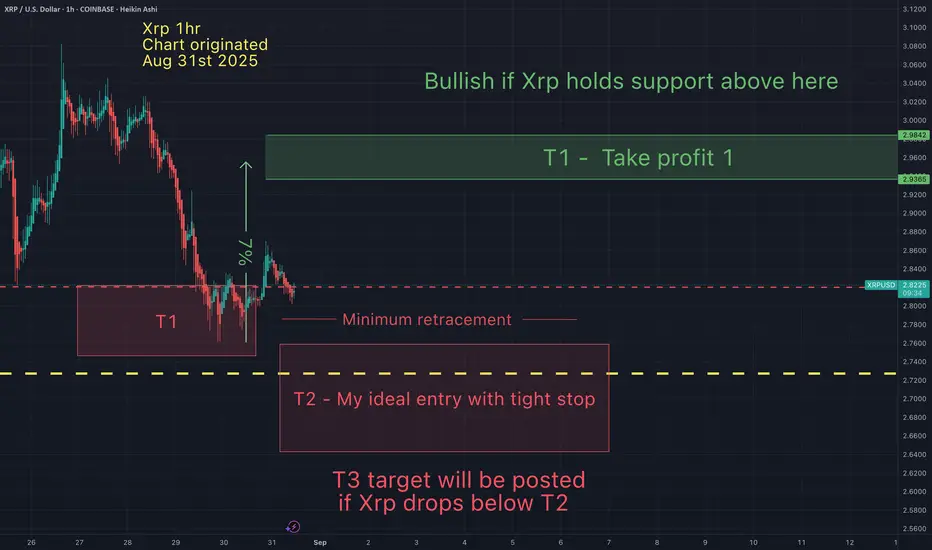
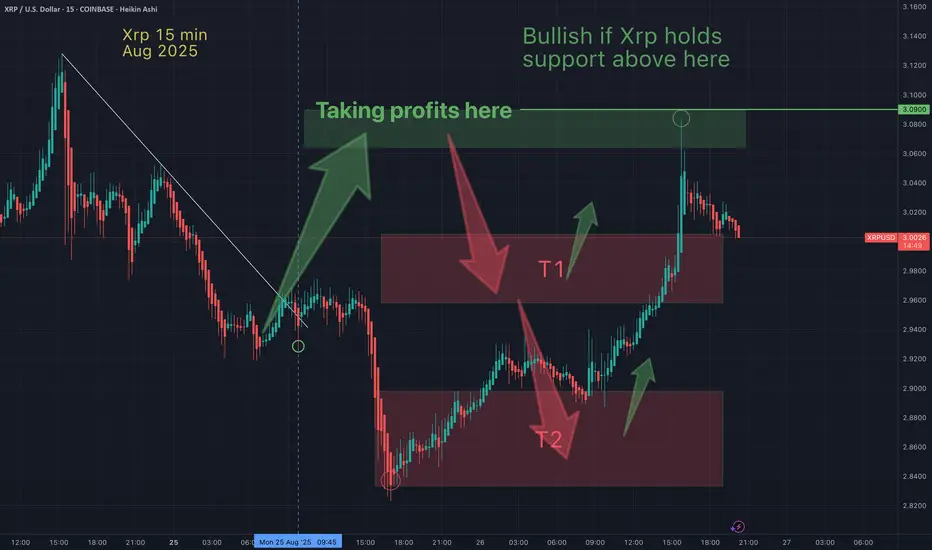
Xrp - Support and resistance & my take profitsThese are my Xrp support and resistance & my take profits. I've been patiently waiting for price to come to me. Now that my T1 has been hit, I'm hoping for a swipe of those lows for my ideal entry. I am cautiously bullish, because there is a chance Xrp goes one leg lower. For now I will chance a long from T1 and T2 (with tight stops) and take profit at my green T1 box.
XRP update all time frames XRP/USD – Bearish Bias, Watching 2.80 Support
XRP continues to trade in a downtrend across multiple timeframes.
🔹 Daily / 4H:
• Price below mid-Bollinger → bears in control.
• RSI < 40, weak momentum.
• Key support: 2.80 → break = 2.75–2.70.
🔹 1H / Lower TFs:
• Rejections at 2.83–2.85.
• Weak bounces near 2.81 but sellers dominant.
• Volume favors downside moves.
📉 Bias: Bearish unless 2.85–2.90 is reclaimed with strong volume.
⚠️ Break below 2.80 opens 2.75–2.70.
✅ Relief bounce possible only above 2.85 → targets 2.93–3.00.
XRP Next Extreme Area to Watch📉 CRYPTO:XRPUSD correction from the July peak is unfolding as a double three structure, with price still likely to test the $2.5–$2.2 zone before bulls return.
This area aligns with key Fibonacci symmetry and prior support, making it a potential launchpad for the next leg higher.
Let the structure complete then watch for confirmation.

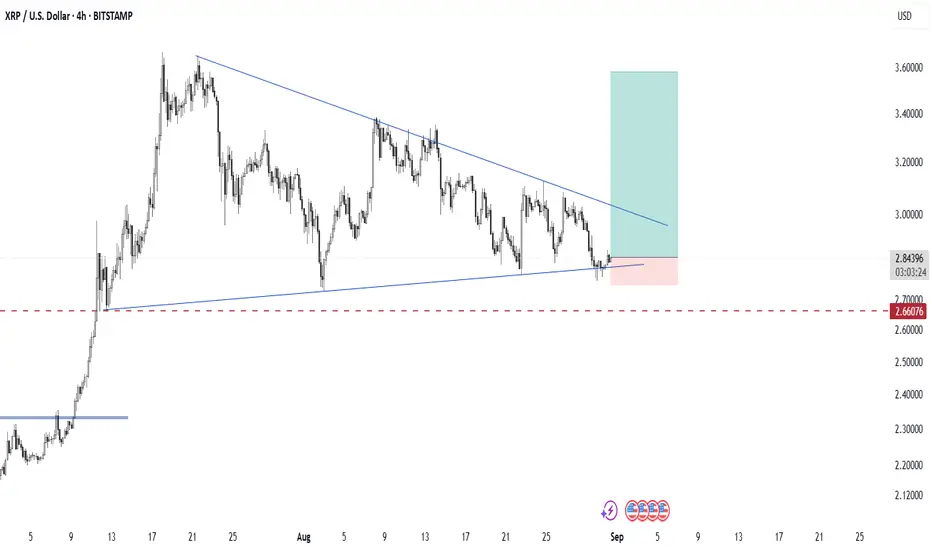
XRP 4H PatternXRP is currently consolidating within a symmetrical triangle pattern, with price action forming lower highs and higher lows. This indicates a period of compression where volatility is decreasing, and a potential breakout could be approaching.
At the moment, the price is testing the lower boundary of the triangle, showing signs of support. As long as XRP holds above the $2.66 support level (highlighted by the dashed red line), the bullish scenario remains valid.
Pattern: Symmetrical Triangle (continuation/neutral pattern)
Entry Zone: Current support trendline near $2.18–$2.20
Stop Loss: Below $2.66 support zone
Target Zone: $3.40 – $3.60 (upper projection of the triangle)
📌 A confirmed breakout above the descending trendline could trigger strong bullish momentum, while a breakdown below $2.66 would invalidate this setup and open the door for deeper correction.
Ripple ( $XRP ) is literally the reflection of 2017The current wave movements of XRP appear to be a reflection of the period from 2013 to 2017. We are in a re-accumulation phase before the next major upward wave.

XRP/USD: Potential Bullish BreakoutXRP/USD is currently in a consolidation phase, holding strong above the support level at $2.75. We have also observed a positive divergence on the RSI, which is holding within a similar consolidation pattern. This suggests a potential shift in momentum.
Trade Plan:
Support: $2.75
Target: $3.80
Entry Options:
Aggressive Entry: A buy entry can be considered around $2.80.
Safe Entry: For a more conservative trade, wait for a confirmed breakout and retest above $3.01.
This is not financial advice. Always do your own research before trading.

XRP intra? + Vs AI
HI,
Since it broke 3.00000
It only shows weakness n further weakness.
My AI model says:
When it shows strength 2.91-95 we whack
Down till 2.70
BUt, when there's a good bearish pattern. ACT!
Good managemnt pls
All the best
Not a guru

tripple correction for xrplet's see how this play's out it looks that we are in the final correction swing abc impuls move to the downside for completing the tripple correction in label z.

XRP LABOR DAY SALEXRP HIT A CRITICAL SUPPORT ZONE BETWEEN $2.80-$2.76
Xrp can head back towards $3 to test resistance. If xrp breaks $3 it can head to $3.50 and breakout towards $5 on the weekly charting
This is not financial advice. Good luck!
-R2C

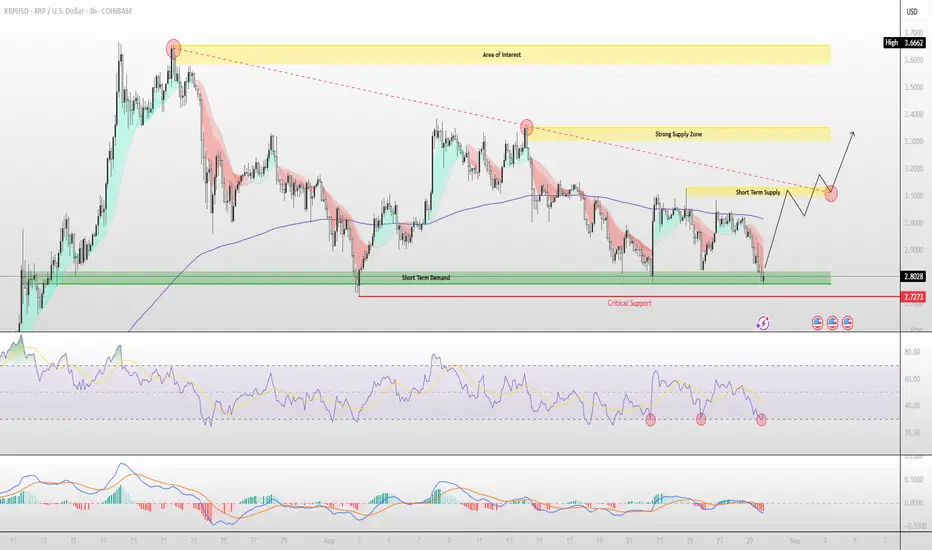
XRP Outlook Heading Into Labor Day WeekendMacro and Market Sentiment
As markets head into the Labor Day weekend, overall risk sentiment remains cautious. Macro uncertainty around inflation, rate policy, and global growth continues to weigh on broader assets, but crypto has shown relative resilience. While Bitcoin remains the primary driver of sentiment, XRP has attracted attention due to its technical positioning at a critical demand zone. Traders appear to be watching closely for whether this level can act as a base for a potential rebound.
Technical Landscape
On the 3H chart, XRP is currently trading around the $2.79-$2.80 zone , sitting directly on top of a well-defined short-term demand area. Below lies a critical support level at $2.72 , which, if lost, could open the door to further downside toward $2.66. On the upside, supply zones remain layered—first around $3.05-$3.10 , then again at $3.30-$3.40 , with a broader area of interest near $3.60-$3.70 .
Indicators and Momentum
RSI is showing signs of bottoming within oversold territory, while MACD momentum suggests selling pressure is slowing. This aligns with prior instances where XRP has built bases before staging a recovery rally. However, the descending trendline resistance continues to cap upside momentum, meaning any rebound will need to reclaim the short-term supply zone to confirm strength.
Outlook and Scenarios
Bullish Case: Holding above $2.72 could set the stage for a move back toward $3.10, followed by potential extension into $3.30-$3.40. A breakout through this zone could re-ignite momentum toward the high $3.60s.
Bearish Case: A decisive break below $2.72 would invalidate near-term demand and expose XRP to a retest of $2.66 or lower, with sentiment turning defensive.
Conclusion
Heading into a holiday weekend, XRP sits at a make-or-break level. A rebound from current demand zones would favor bullish continuation into September, while a loss of support could lead to a deeper retracement. Traders should monitor price action closely around $2.72 as the key pivot level shaping near-term direction.
Happy Labor Day weekend everybody!
- STACK$

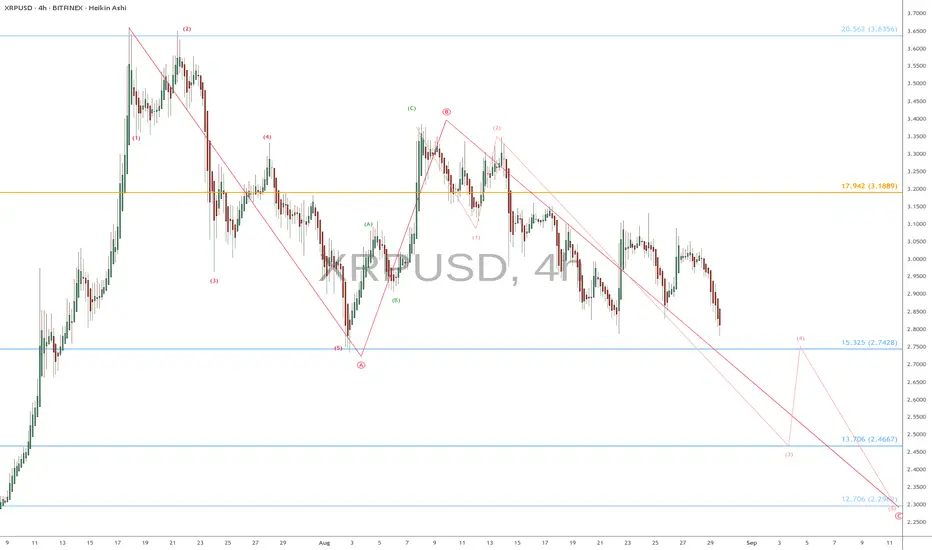
XRP h4 with EW: paints the clearest example of a Market-Wide TOPMany assets classes are showing topping patterns again.
XRP is perhaps the clearest example amongst the cryptos.
EW wise: 5wave (A), 3wave (B), with 5wave (C) to come?
$ 3.1889 Golden fib is the invalidation level
$ 2.4667 should be a fast drop before bounce.
$ 2.2962 is the minimum expected length of (c)
$ 2.0206 sister Golden fib that is always a target.
Of course, this could be totally wrong given the clear FOMO.
Markets have already killed a series of topping patterns.
But IF there is a top anywhere near here, then THIS is it.
.
Other assets at possible tops are below:
ETH
NVDA
META
Gold (XAU.usd)
Hit BOOST and FOLLOW for more such PRECISE and TIMELY charts
========================================================
.
EDU-Series 101 | Candles & Ranges contwhere price is in relation to the range will determine what type of label we will name the levels in that range.
When price is below a distribution range, we call the first candle a Break Level. When price reaches this break level it will be acting as resistance holding price down. When Price breaks over it, the distribution cycle has ended and Accumulation ranges will need to created, otherwise, price will fail its accumulation trend and distribute more.
Price below distribution range:
1st candle = distribution cycle start, break level.
last candle = Shield. Price needs to get above this candle if it wants to try to test the break level. If price gains this level, it shields it from distribution further.... since price gains this level and gets above it... we need to re-label it.
Price above distribution range:
1st candle = this is the Back-side of the range, Backside Hold level, (BS for short)
last candle = This is the front-side of the range, Frontside hold level, (FS for short)
The same is true for accumulation ranges but we add the label "inverted" to it since its the same as distribution but inverted...

$XRP: Ripple’s Rocket – Ready to Soar or Facing Turbulence?(1/9)
Good evening, everyone! 🌙 CRYPTOCAP:XRP : Ripple’s Rocket – Ready to Soar or Facing Turbulence?
CRYPTOCAP:XRP ’s up 8.4% despite a crypto crash, with SEC rumors fueling hope—but will adoption or regulation steer this rocket? Let’s dive in! 🔍
(2/9) – PRICE PERFORMANCE 📊
• Recent Trend: Gained 8.4% despite a crypto market down 20.57% in Feb, per U.Today 📈
• 2025 Context: Speculation of SEC appeal dismissal boosts sentiment 📏
• Sector Trend: Crypto market down, but CRYPTOCAP:XRP bucks the trend 🌟
It’s a fighter, shaking off the bears! ⚙️
(3/9) – MARKET POSITION 📈
• Ranking: Remains a top 10 cryptocurrency, per CoinMarketCap 🏆
• Use Case: Leading in cross-border payments with RippleNet ⏰
• Trend: Regulatory clarity hopes rise, potentially unlocking more adoption 🎯
Firm, a key player in the altcoin arena! 🚀
(4/9) – KEY DEVELOPMENTS 🔑
• SEC Case: Closed-door meeting Feb 27 fuels dismissal talk, per Ripple CEO’s X post 🔄
• Adoption: RippleNet partnerships expand, with new banks joining for faster payments 🌍
• Market Reaction: Up 8.4% amid market turmoil, showing resilience 📋
Adapting, with legal and adoption catalysts! 💡
(5/9) – RISKS IN FOCUS ⚡
• Regulation: SEC case uncertainty persists, appeal process ongoing 🕳️
• Market Volatility: Crypto market’s unpredictable swings can hit hard ❄️
• Competition: Other blockchain platforms vying for cross-border payment dominance ⚖️
Tough, but risks are part of the game! 🛑
(6/9) – SWOT: STRENGTHS 💪
• Resilience: Up 8.4% when others fall, showing strong investor confidence 🥇
• Utility: RippleNet’s fast cross-border payments attract banks and institutions 📊
• Community: Robust support from holders and Ripple’s strategic partnerships 🔧
Got fuel in the tank! 🏦
(7/9) – SWOT: WEAKNESSES & OPPORTUNITIES ⚖️
• Weaknesses: SEC case not fully resolved, adoption slower than hoped 📉
• Opportunities: Potential ETF approval, expanding CBDC projects, and new partnerships 📈
Can it break free and soar? 🤔
(8/9) – 📢 CRYPTOCAP:XRP ’s up 8.4% despite market crash, SEC buzz grows, your take? 🗳️
• Bullish: $3+ soon, legal win sparks rally 🐂
• Neutral: Steady, risks balance ⚖️
• Bearish: Below $2, regulation stalls 🐻
Chime in below! 👇
(9/9) – FINAL TAKEAWAY 🎯
CRYPTOCAP:XRP ’s resilience amid a market crash shows its mettle 📈, but SEC uncertainty and competition pose challenges 🌿. Volatility’s our friend—dips are DCA gold 💰. Grab ‘em low, climb like pros! Gem or bust? S

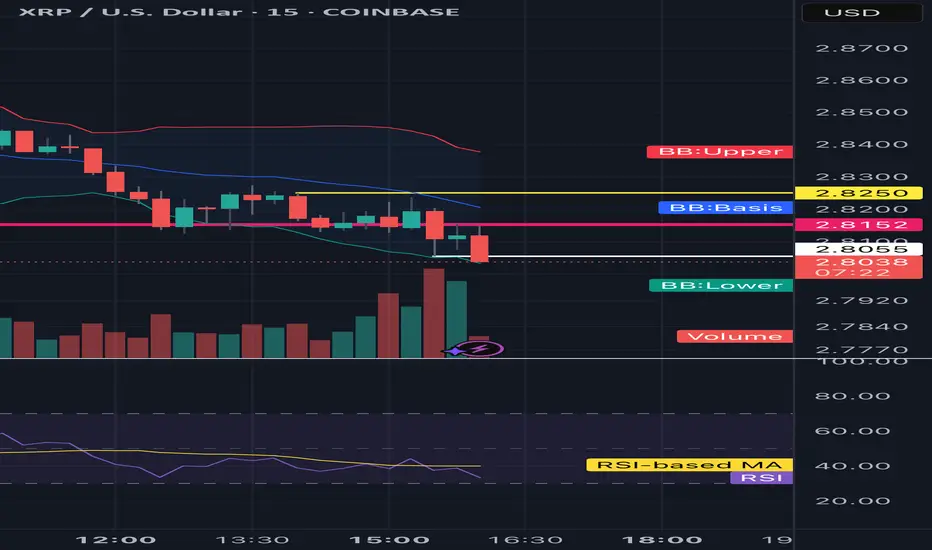
XRPUSD – Short Setup. Tread carefullyXRP Update (Short-term idea):
Price is in a clear downtrend, riding the lower Bollinger Bands across all timeframes. RSI is below 40 and still pointing down → momentum remains bearish. Volume confirms selling pressure.
📉 Setup leans short:
• Entry zone: $2.92–2.93
• TP: $2.90 → $2.87
• SL: Above $2.95
⚠️ Bullish reversal only if $2.90 support holds with strong bounce + RSI divergence. For now, bears remain in control.
It could flip bullish very easily tread carefully

XRP to $5.50XRP is in its 5th wave, and based on this weekly bull flag, it could reach $5.50 after breaking the resistance line.

H4 Gap Manipulation Here we have a four hour gap that we tapped into, but never expanded out of it and instead accumulated what comes next is manipulation and finally distribution. I anticipate a sweep on the liquidity to then displace higher.

Xrp/USD Test Trade With New IndicatorXrp/USD Test Trade With New Indicator
Trend identify - LJ/LL means down trend
LTF shows - sell
MTF shows - sell
Volume - Down Side Increase
expiry will happen after some time and there is also some news at 6 o'clock, so let's see what impact it has on behavior of this indicator
time - 5:15 PM Now

Daily XRP updateNot much has changed since my last update on the daily chart yesterday. Still waiting for the market to decide the bigger move here. I’m still leaning bearish
Trend & Price Action
• Price is sitting at $2.995, slightly under the $3.00 psychological level.
• The candles are consolidating between the descending trendline (blue) acting as resistance and an ascending short-term trendline acting as support, forming a symmetrical triangle.
• A decisive break either way (above $3.05 or below $2.95) could trigger the next move.
Bollinger Bands
• The bands are narrowing, which usually signals a volatility squeeze → big move incoming.
• Price is hovering near the basis (middle band) around $3.00, showing indecision.
• Upper BB = ~3.30, Lower BB = ~2.70, giving the near-term range.
RSI
• RSI is sitting just under 50, slightly bearish, but not oversold.
• Momentum is weak; RSI has been rejected around 50 multiple times, which shows bulls are struggling to take control.
• If RSI breaks above 50 with strength, that could support a bullish breakout.
Key Levels
• Resistance: $3.05 (triangle breakout), $3.30 (upper BB), $3.50–3.70 (previous highs).
• Support: $2.95 (triangle breakdown), $2.70 (lower BB), $2.50 (next horizontal support).
Will up date on lower time frames and see if there is a opportunity to make a short term trade

Xrp - I was wrongFor the first time in the last 50+ charts I was wrong about (initial) direction. I believed Xrp would hit my bullish (take profit) target 1st... then hit my beasrish T2 target. But the opposite occured. I like to keep stats on my calls and be transparent when I wrong. Errors can always be a learning opportunity.
The upshot is that my support and resistance were spot on (and profits were taken within less than 1% of my take profit target). TA works!
Published yesterday (Aug 25th):
May the trends be with you.
Xrp long trade completeSo we hit all 3 spot I outlined as possible places to take profits. I ended up closing my trade just under 3.05 for a 62% realized PNL.
And we saw it hit 3.08 before a strong rejection.
Will update later on!
Thanks for following

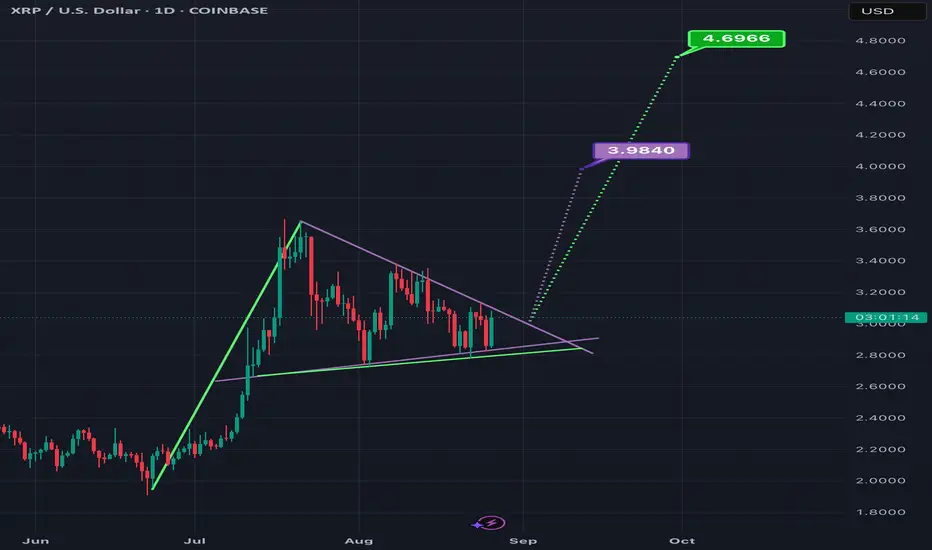
Symmetrical Triangle/ Bull Pennant on XRPUSD Nearing its ApexThe bottom trendline of this triangle definitely seems to have finally been narrowed down to this purple line and green line with multiple touch points to back that up. *not financial advice*