XRP in bearish territory XRP 95-Day Bearish Case (Target $2.45)
1. Current Setup (Day 0 – Now at $2.97)
• Struggling under the $3.00–$3.05 resistance zone.
• RSI downtrend → loss of bullish momentum.
• 50 SMA flattening → sideways/downward bias.
• Lower highs forming → sellers remain in control.
⸻
2. Short-Term (0–30 days → into late September)
• Likely rejection at $3.00 → drifting lower.
• First support test: $2.75–$2.70.
• If weakness continues → wick down to $2.50–$2.45 before bounce.
⸻
3. Long-Term (60–95 days → November)
• XRP retests $2.50–$2.75 support zone.
• Consolidation as sellers fade.
• Buyers begin stepping in → pushing XRP back toward $3.00.
⸻
Macro Outlook Beyond 95 Days
• 200 Days Out (≈ April 2026)
XRP establishes a medium price range, likely between $2.80–$3.20.
Market consolidates → creating a base for accumulation.
• +30 Days Later (≈ March 2026)
XRP blasts off into its final leg of the bullrun.
Historically, altcoin cycles peak after extended consolidation → this lines up with a March 2026 macro-top thesis.
⸻
📉 Short-term: XRP likely weakens to $2.45 before recovery.
📈 Long-term: Base formation leads to a parabolic move in early 2026.
XRPUSD.P trade ideas

XRP heading towards ATH $3.66Price Action: The current price (3.0435) is within a consolidation range, with a recent upward movement. The chart shows a potential resistance zone around 3.0435–3.24, where previous highs were tested, and a support level near 3.031, aligning with the 50-period Simple Moving Average (SMA 50) close.
Bullish 🚀

XRP BULLISH CONTINUATION ! XRP has been consolidated between the areas of $3.30 and $2.82. The SEC has finally concluded its appeal and settled on a fine on Ripples end. Immediately after, about 7 ETF’s were filed on behalf of XRP, as well as SWIFT announcing the introduction of XRP and HBAR in cross border payments. As mentioned in recent posts, XRP should be headed above the resistance at $3.31 and break towards $4, $5 and possibly above. I believe this will be a quick and solid crypto season, before a possible exhaustion in this next wave.
This is not financial advice.
Good luck! -R2C

xrp shortXrp continuation short after news event. I am looking for a further pull back to continue over the next few days
XRP BREAKOUT TO $5In daily timeframe there is bullish penant pattern that has potential to bring the price of xrp to $5 in the near future

SELL XRPThe market show good seller demand at the bottom so I gonna sell it here , the previous trend line is broken by a strong buyer so now the market must be go down to take some liquidity

XRP to $4 dollars 🔎 Chart Observations
1. Current Price: $3.07
2. Pattern: symmetrical triangle (consolidation before a breakout.)
3. Support: Around $2.98- $3.00
4. Resistance: Descending trendline near $3.20 – $3.33
5. Projected Move: Orange arrow shows breakout toward all time highs and reaching $4.20–$4.40 for the first wave 🌊
Bullish elephant bar 🐘 🚀

XRP SwingsThe July 2025 surge was fueled by a technical breakout, Bitcoin’s broader rally, Trump’s pro-crypto stance, Ripple’s SEC settlement, renewed institutional interest, and bullish trading forecasts.
Now, after the sharp move, XRP is consolidating in a triangle pattern and defining new territory. If no major news arrives, expect price to bounce inside the formation.
Setup: Buy near $2.80, take profit at $3.00, stop loss at $2.60. Suitable for short swing plays while range holds.


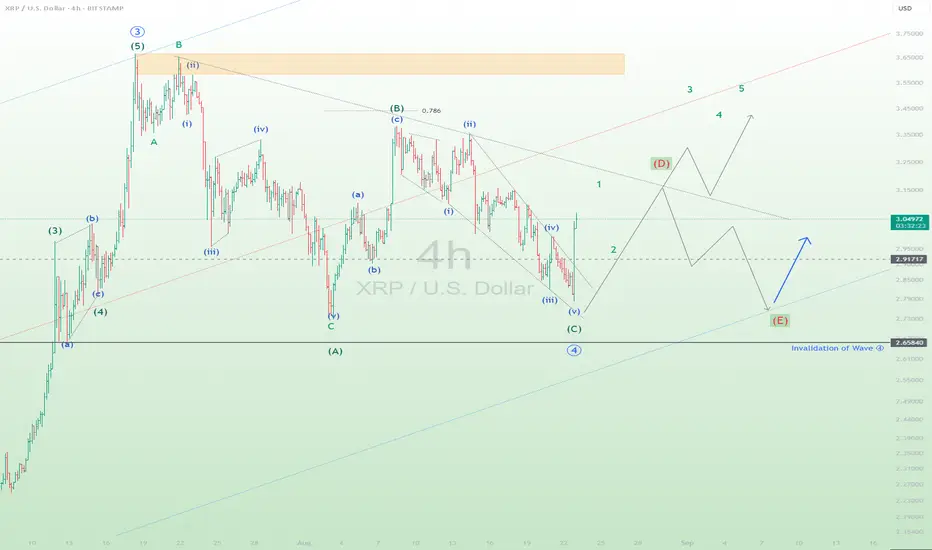
XRPUSD Wave C of Wave 4Trend: Correction within wave 4.
As of now, XRPUSD seems to have completed the wave (C) of wave 4 in the blue circle.
Now XRPUSD is making sub-wave 1 of wave 5 in the blue circle. Let the big trader complete wave 1 first.
If wave 4 in the blue circle is going to make a triangle, we can expect that she will reject the downtrend line at point (D). Let's see the next move.
This prediction is only my opinion. Only showing the EW counting and looking for trends. No trade recommendation.
XRP heading to $4 in 5 waves 🔎 Technical Analysis
1. Price Action
• XRP is currently around $2.85–2.86.
• There’s a visible descending trendline showing lower highs, but price is consolidating sideways near horizontal support (~$2.85).
2. Support & Resistance
• Strong support: around $2.80–2.85 (tested multiple times).
• Immediate resistance: around $2.90–2.95, where the descending trendline aligns.
• Major upside target: around $3.05–3.10, if resistance breaks.
3. Indicators
• SMA 50: Price is hovering just below the moving average, suggesting sellers still in control but losing momentum.
• Williams %R: Currently at -66.44, sitting in the bearish zone but close to oversold. This signals downside momentum is weakening.
4. Chart Projection
• The black arrow drawn shows a potential bullish reversal: bounce from support → break trendline → run toward $3.05 and heading towards all time highs and price discovery of $4 plus.
• This would only confirm if XRP breaks and holds above the descending trendline (~$2.90–2.95).
✅ Bullish Scenario
• Hold support at $2.80–2.85.
• Break above $2.95, leading to a push toward $3.05–3.10.
❌ Bearish Scenario
• If $2.80 support fails, price could revisit $2.70 or lower.

XRPUSD continues to declineXRPUSD continues to decline
XRPUSD has been trading within a descending channel since August 11. The asset trades below the SMA200 on hourly timeframe, breaking through and then retesting the support levels. Currently, the price trades below the SMA50 and has recently retested the former 3.00000 support level. MACD on 1- h timeframe has crossed into the red zone. The further decline towards 2.72000 is expected.

Long!! I opened a leverage long position over the weekend. I am planning to take profit at $4, $4.50 and $5. Stop loss is at $2.7
Reasons for a long position:
1) The price has pulled back and found a clear support at Fib .5 and EMA55.
2)The current chart set up is very similar to that in Jan 2025 (see green vertical line in the chart).
3) RSI is consolidating in the bull zone.
4) MACD lines are bunched up together and moving horizontally. However, the lines are in the bull zone and MACD histogram shows bear momentum is waning. It might be safer to wait for MACD lines to cross to the upside, but there are enough confluences for bullish bias.
5) The daily candle is now moving above Fib 0.236. Fib 0.236 often works as the last line of defence for the bear and if it is breached, it is very likely to move to the upside.

XRP - a note about pivotsShe's gonna bounce around in this area until the end of the month. Squeeze them new daily pivots and then rip.
Pivots are a marker for the average price of open orders, both to buy (S1-5) and sell (R1-5). The pivot itself is the most common price of the two right smack in the middle, a very powerful pull. They change based on the time frame you're in. The larger the time frame the stronger the pull.
Once a new time cycle starts, new pivots are issued. They will expand and contract as orders push the price quick or slow. If they become closer together the move out will be explosive, and you'll have to use other indicators to tell which way she'll break.
You'll often see pivots line up within supply and demand zones. (Again areas of open orders). Give them a watch for a while and see how it plays.
Follow for more
possible movepossible further move to the downside, then move back up toward the resistance area. Hopefully, all will be well in the world, and we will make some money! LOL Just an idea.

XRP Holds $2.80 Support as Bulls Target BreakoutXRP has pulled back into the $2.80 support zone, a region reinforced by the 50-day moving average and the value area high. Strong buying volume suggests this retest could fuel a move toward new highs.
XRP’s correction has settled into a critical support area that has so far absorbed selling pressure effectively. The $2.80 zone, supported by the 50-day moving average and the value area high, has provided stability for price action in recent sessions. This confluence of technical levels gives buyers a strong foundation to defend, increasing the probability of continuation if the level holds.
The importance of this region lies not only in its structural strength but also in its volume profile. The overlap between high-time frame support and a high-volume trading area suggests that demand is concentrated here. Such zones are often treated as accumulation ranges, where long-term buyers absorb supply and prepare for a new leg upward.
Key Technical Points:
- $2.80 High-Time Frame Support: Aligned with both the 50-day moving average and the value area high.
- Bullish Retest Developing: Current reaction shows resilience, keeping the higher-highs and - higher-lows structure intact.
- Volume Confirmation: Above-average buying volume signals strong demand at this level.
Structurally, XRP continues to respect its bullish market trajectory. Since reclaiming the point of control earlier in the year, the asset has moved in a steady rhythm of higher highs and higher lows. The current bounce from $2.80 underlines that the broader bullish trend remains intact despite short-term volatility.
Volume trends further strengthen the case for continuation. The presence of above-average bullish inflows suggests that the current retest is less a breakdown and more a validation of support. This level of participation shows that market participants are prepared to accumulate XRP at higher price zones, a sign of confidence that often precedes impulsive upside moves.
It is also worth noting that XRP does not need an immediate breakout to remain constructive. Consolidation above $2.80 would serve as a healthy base, helping to stabilize the market while flushing out weak hands. Periods of sideways price action often act as launchpads for stronger moves when buyers eventually regain momentum.
What to Expect in the Coming Price Action
As long as XRP sustains multiple daily closes above $2.80, the bullish case remains intact. Continued strong volume will reinforce the likelihood of an advance beyond the swing high, opening the path toward new all-time highs. The current retest represents a pivotal juncture, and if buyers maintain control, XRP could soon resume its bullish expansion into uncharted territory.

XRP at Channel Support – Bounce or Breakdown?XRP is trading inside a clear descending channel on the 4H timeframe, with price now sitting near the bottom support zone around $2.85–$2.89. RSI is in oversold territory and curling upward, suggesting a possible short-term bounce.
Key levels to watch:
• Support: $2.85 (channel bottom).
• Resistance: $2.95–$3.00 (channel midline), then $3.05–$3.06 (channel top / EMA).
📈 If XRP breaks above $3.06 with strong volume, it would confirm a potential bullish breakout toward $3.15–$3.20.
📉 But if $2.85 fails, the next downside targets are $2.82 and $2.75.
For now, this looks like a possible bounce inside a bearish channel — reversal confirmation only comes on a breakout.
⸻
Tags:
#XRP #Crypto #TechnicalAnalysis #RSI #Trading

SHORT | XRPUSDCOINBASE:XRPUSD
XRPUSD Daily – Bearish Continuation in Play
Trend Structure
Market printed a Higher High near 3.66 but failed to sustain momentum.
Recent price action has shifted into a sequence of Lower Highs, confirming bearish control.
Current structure shows LH → LL pressure, with momentum pointing lower.
EMA Context
Price is already below the 9 EMA, confirming short-term weakness.
The 35 EMA has failed to hold as support.
The 100 EMA aligns with demand and marks a critical inflection point.
Fib + Key Levels
38.2% retracement at 2.995 has been broken — bearish confirmation.
50% retracement at 2.788 is the near-term magnet.
61.8% retracement at 2.580 is a strong support cluster with EMA + demand zone.
Targets
TP1: 2.247 (aligns with 78% retracement + demand)
TP2: 1.909 (major liquidity zone and deeper correction target)
Invalidation
A daily close above 3.25–3.30 would weaken the bearish thesis and shift focus back to range consolidation.
Bias
Short-term to mid-term bearish. Expecting continuation toward 2.78 → 2.58 first, with potential extension into 2.24 and 1.90 if supports fail.

XRP next 50 day analysis 🔎 Current Market Context is Bullish 🐂
• Price: ~$2.92 (as shown on your chart).
• Trend: Currently retracing after a sharp run-up, consolidating near support.
• Support Zone: Around $2.70- $2.80.
• 50-day SMA: Sloping upward, acting as dynamic support.
• RSI (7 close): Looks like it’s cooling off from an overbought region.
📉 Short-Term (next 10–15 days)
• If XRP holds above the horizontal support & 50-day SMA, buyers may step in.
• Expect sideways to slight upward action → potential retest of ~$3.27 - $3.35
📈 Medium-Term (15–30 days)
• Based on the bullish projection sketched:
• A rally could push XRP toward $3.80–$4.20.
• Likely stair-step pattern: higher highs & higher lows (as drawn).
• If volume increases, a breakout above $4 could attract momentum traders.
🚀 Long-Term (30–50 days)
• Strong bullish case: After a 20 percent pullback to previous resistance of $3.35 it will wave towards $5.
🐻 Bearish case - none of this will happen if the $2.70 support zone is broken downwards.

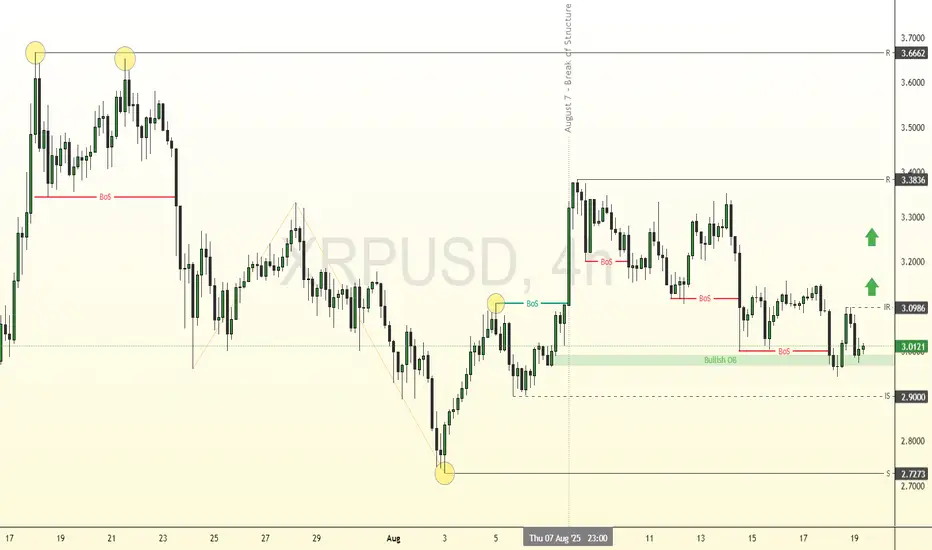
XRP: Key Support at $2.72 Holds Bullish OutlookFenzoFx—XRP (Ripple) broke its bearish structure with a strong engulfing pattern on August 7 and is now consolidating near $3.00. This level is supported by a bullish order block, with immediate support at $2.90.
The 4-hour chart shows equal highs at $3.66, marking a liquidity target. Immediate resistance lies at $3.09, and a close above this level could resume the uptrend.
Xrp 4 hr Have a look at the RSI, I have noticed a correlation between price movement and time frame.
What do you think?

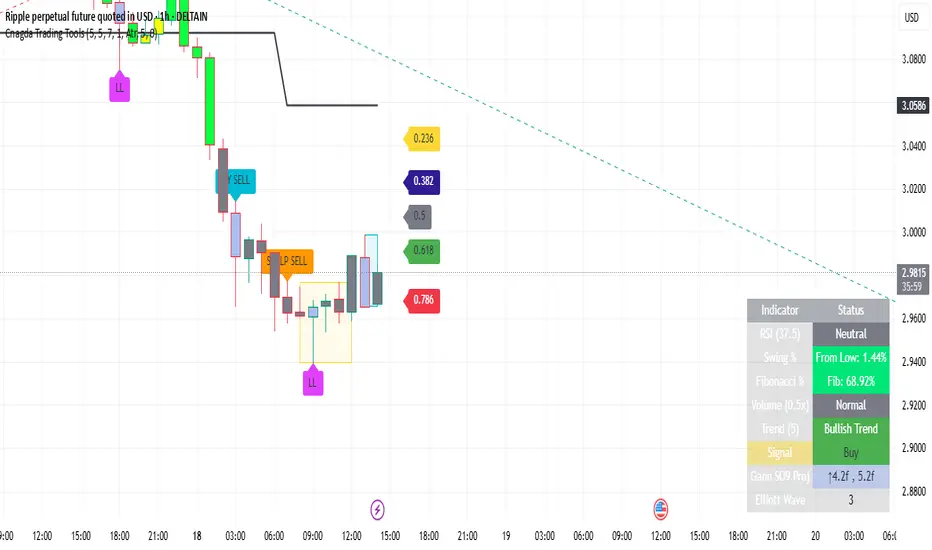
Xrp on Retracement ZoneThe price is currently under the retracement zone in 1 hour time frame, a bullish movement can come from here, the price is around 2.97 and from here our first target will be 3.04 and after that we will trail.
Apart from this, the support zone of 7 August is also here and POC is also present here, so we are getting double confirmation that we can predict long from here
And also if we look at the Elliot wave indicator of cnagda trading tool, then it is also showing phase 3, so definitely a bullish movement should come from here
Our Sl will be 2.95 and risk:reward = 1:4
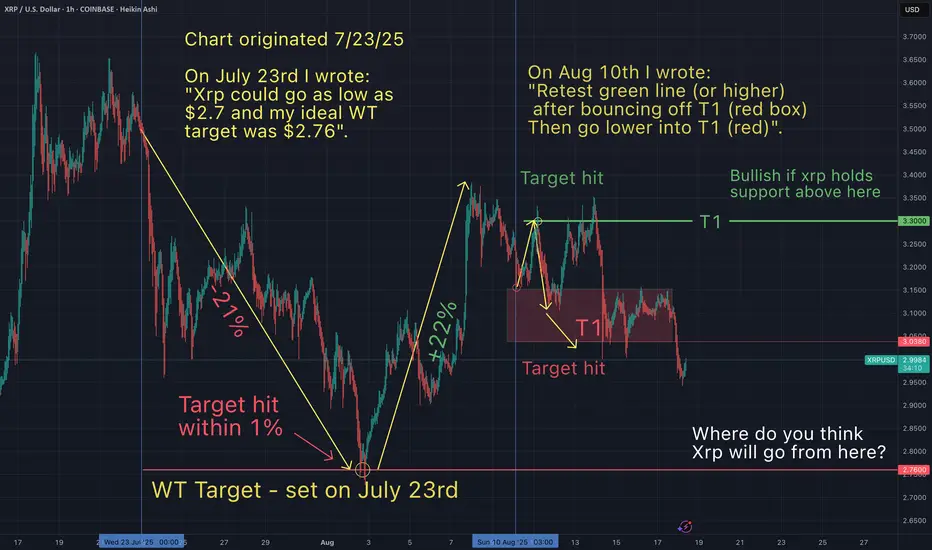
You continue to ask "how did he know Xrp would do that"?I like to keep stats on my predictions, and so should you. How else can you tell if someone is worth following? So, here's a recap since my first Xrp post ever, made on July 23rd 2025.
July 23rd- I suggested Xrp could go as low as $2.7 (a -25% dump from that day).
July 28th- As Xrp approached $2.7 I refined my predicition to a WT target of $2.76
Aug 2nd- My $2.76 WT target was hit (within 1%). See below
Aug 7th- I expected a big bounce from my WT target (20+%) and I followed up with a post, as we started to get close to that next top.
Aug 10- I called "the top was in", and I suggested that Xrp would drop to my support range of $3.03-$3.15 within 1-3 days. That target was hit 1.5 days later. I also suggested Xrp would bounce from my red T1 box and retrace up to my T1 green line...and then go lower into my red box. My calls on direction and target for each of these 3 moves were confirmed. See below.
Aug 11th- Xrp went lower into my red box as anticipated.
Notice in all of my charts, I do not simply offer support and resistance zones (as some influencers do). I anticipate the direction the asset will take as it travels through these zones. Simply identifying support and resistance is not enough to execute profitable trades. I hope that my accuracy in determining directionality and precise targets has been of benefit to you. I would like to see us all succeed.
Please note, I'm not sure how much longer I will continue to chart at this pace, being that it takes a lot of time & effort to bring you these free gold nuggets. Let me know if you want me to show you how I draw these maps to the gold mine.