You continue to ask "how did he know Xrp would do that"?I like to keep stats on my predictions, and so should you. How else can you tell if someone is worth following? So, here's a recap since my first Xrp post ever, made on July 23rd 2025.
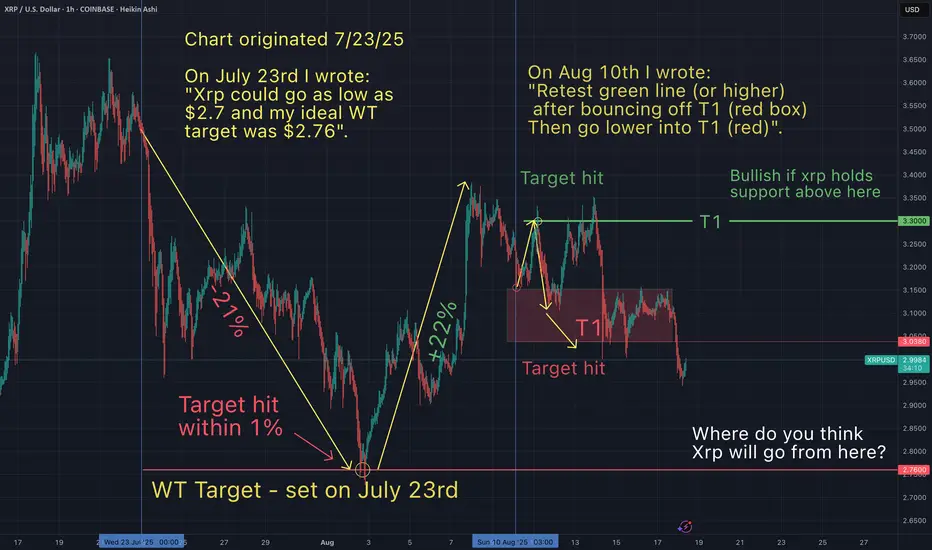
July 23rd- I suggested Xrp could go as low as $2.7 (a -25% dump from that day).
July 28th- As Xrp approached $2.7 I refined my predicition to a WT target of $2.76
Aug 2nd- My $2.76 WT target was hit (within 1%). See below
Aug 7th- I expected a big bounce from my WT target (20+%) and I followed up with a post, as we started to get close to that next top.
Aug 10- I called "the top was in", and I suggested that Xrp would drop to my support range of $3.03-$3.15 within 1-3 days. That target was hit 1.5 days later. I also suggested Xrp would bounce from my red T1 box and retrace up to my T1 green line...and then go lower into my red box. My calls on direction and target for each of these 3 moves were confirmed. See below.
Aug 11th- Xrp went lower into my red box as anticipated.
Notice in all of my charts, I do not simply offer support and resistance zones (as some influencers do). I anticipate the direction the asset will take as it travels through these zones. Simply identifying support and resistance is not enough to execute profitable trades. I hope that my accuracy in determining directionality and precise targets has been of benefit to you. I would like to see us all succeed.
Please note, I'm not sure how much longer I will continue to chart at this pace, being that it takes a lot of time & effort to bring you these free gold nuggets. Let me know if you want me to show you how I draw these maps to the gold mine.
XRPUSD.P trade ideas

XRP Weekly ChartPrice starting to move down, see if it breaks out of this range as clean traffic below.

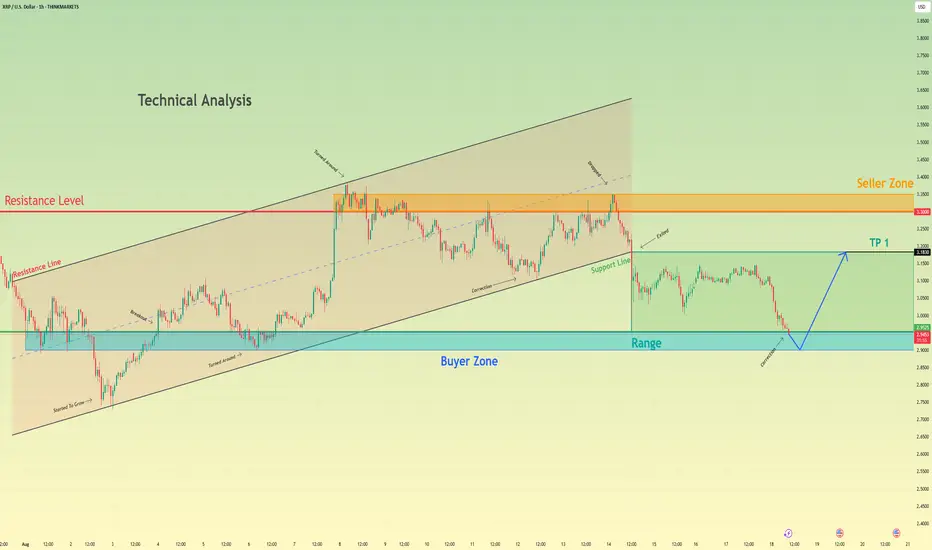
Ripple may bounce up from buyer zone to top part of rangeHello traders, I want share with you my opinion about Ripple. The market for Ripple has undergone a significant structural shift, with the prior upward channel giving way to a new phase of horizontal consolidation following a decisive breakdown. This event signaled a pause in the strong bullish momentum and established a new trading range, with the major buyer zone around the 2.9525 support level now acting as the foundational floor for the price. After the initial drop, the price has been trading within this new, more contained range, undergoing a series of corrective movements. Currently, the asset is in another downward leg, heading towards the critical buyer zone for what could be a decisive test of this support. The primary working hypothesis is a long scenario, based on the expectation that demand will overcome supply within this 2.9525 - 2.9000 area. A confirmed and strong rebound from this key support would indicate that the corrective phase is over and that buyers are ready to initiate a new rotation to the upside. Therefore, the TP for this range-based play is logically set at the 3.1830 level. This target corresponds with the top of the current consolidation range and represents the most probable objective for a bullish swing originating from the established support base. Please share this idea with your friends and click Boost 🚀
Disclaimer: As part of ThinkMarkets’ Influencer Program, I am sponsored to share and publish their charts in my analysis.
Classic Masonic Symbol setup on XRP /sJust trolling... But noticed a Masonic symbol in the XRP chart. Thought it was weird and should share for all the tinfoil hat types... haha

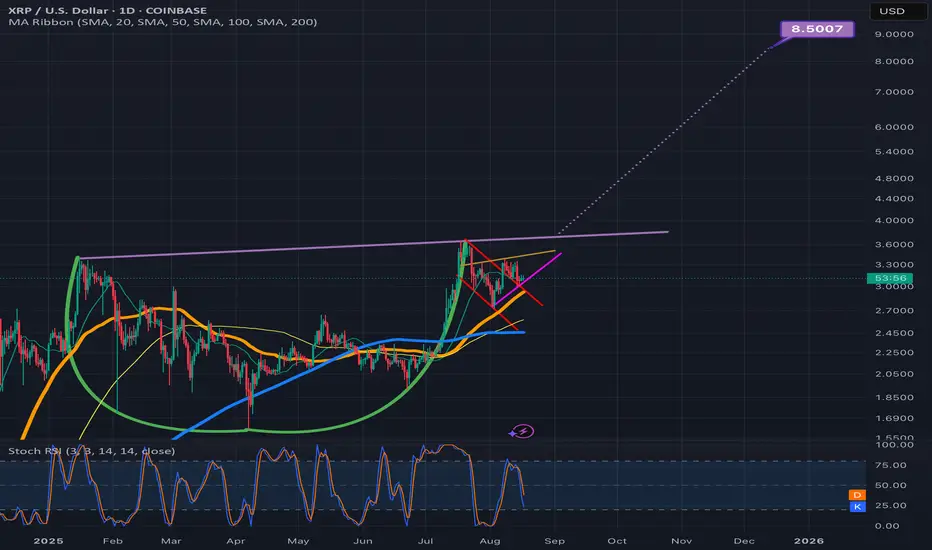
Log chart c&h patternThis one has an $8.50 target. This is the daily time frame, logarithmic scale. *not financial advice*
XRP Target Is 120$Ripple's target is $120 to $120 based on the middle of the triangle and the second leg.

XRP getting rdythere is not much to say.... its just pattern the same I saw many yrs ago somewhere .... XRP is preparing for blow yr minds just only

XRPUSD : Wave 4 possibly not yet completed.As of today, I see a new price pattern in XRPUSD.
The counting that is completed as of now seems like wave (A) and wave (B).
The price probably will go to wave (C) in 5 waves if it's going to be a flat pattern (3-3-5).
The other possibilities of wave 4 in the blue circle could be a triangle (ABCDE) or a double zigzag (complex).
I may be wrong. Please make your own analysis prior to placing any trade.

Minimum risk Maximum profit on XRP this weekI am anticipating a rapid growth in XRP in the next 30days. I enter low risk and keep going risk-free if the trade plays out well.
entry : 3.1
Sl : 3.03
Tp : 3.5, 4.0, 5.0 ath
my strategy is BE at every trigger.
Goodluck

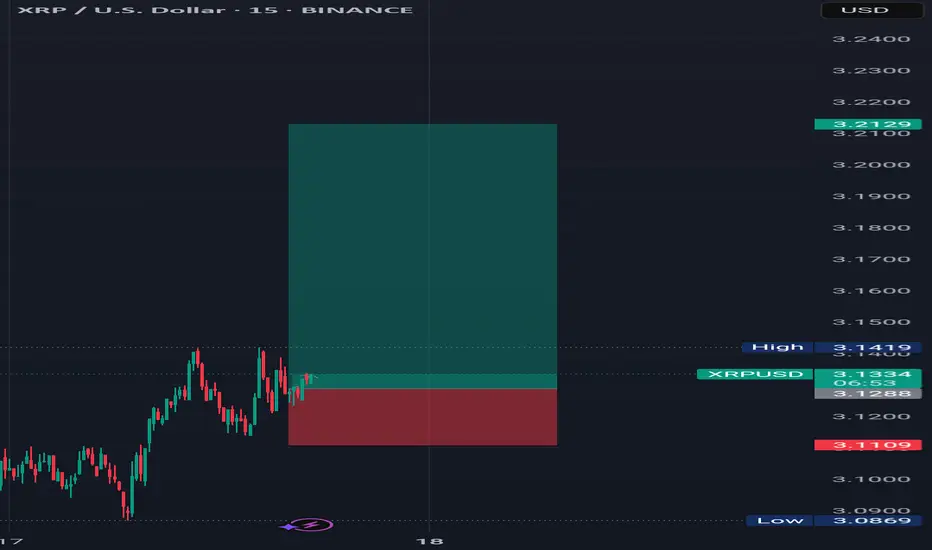
XRP?
Hi
3.14 seems to be strong resistance.
So far its doing it,,, resist
What if it breaks?
Shall we see higher prints...
That pattern; some call H&Shoulders, some call jumanji, starwars,, etc etc
:)
The point is it name doesn't matter. As long the pattern prints higher prices and follow it's path.
If not, we ll call it smthg else
All the best.
Not a guru

$XRPUSD: Limits of Expansion🏛️ Research Notes
Documenting interconnections where historic area and coordinates of formations are used to express geometry of ongoing cycle.
If we scale out the chart back starting from roughly 2016, we can see more pretext like how the price was wired before decisive breakout from triangle.
Integrating fib channel to the angle of growth phase of the previous super-cycle, so that frequency of reversals match structural narrative.

XRP?
Hi,
Did some adjustment.
1st didn't work as smooth.
Will monitor & trade accordingly.
Out of range 3.18
Cautiously watching BTC, didn't expect it trade below bullish levels. 118200 (my2c)
When it broke 120k (bye bye 120).. I thought 130k will be smooth.
Anyways. We'll see how
Progress in crypto space.
All the best
Not a guru

buy I will take entry after the breakout of small time frame trendline ,In my analyses market have to go on up

XRP 4hr ChartHave a look at the lines I have drawn on the Chart, RSI and the Momentum indicator.
Looks like a W pattern on all levels. I'm not guarenting that Price hit's another ATH but, I wouldn't be Bearish on Xrp right now. This is the second wave down to retest $3.
Look on the brownish line on the price chart to see where price was the last time Momentum, Rsi relative to price. $1.90 V. $3 today Aug 15th

Xrp - It all comes down to this!🚀Xrp ( CRYPTO:XRPUSD ) has to break structure:
🔎Analysis summary:
After Xrp created the previous all time high in 2018, we have been seeing a consolidation ever since. With the recent all time high retest however, Xrp is clearly showing some considerable strength. It all comes down to bulls being able to push price higher, above the massive horizontal structure.
📝Levels to watch:
$3.0
SwingTraderPhil
SwingTrading.Simplified. | Investing.Simplified. | #LONGTERMVISION

XRP Price Poised for at Least 30% Growth or DeclineA look at the XRP price shows that if it breaks the $3.2 resistance level, it could surge to at least $4. Conversely, if negative news emerges and the $2.9 support level breaks, it could plunge to around $2.

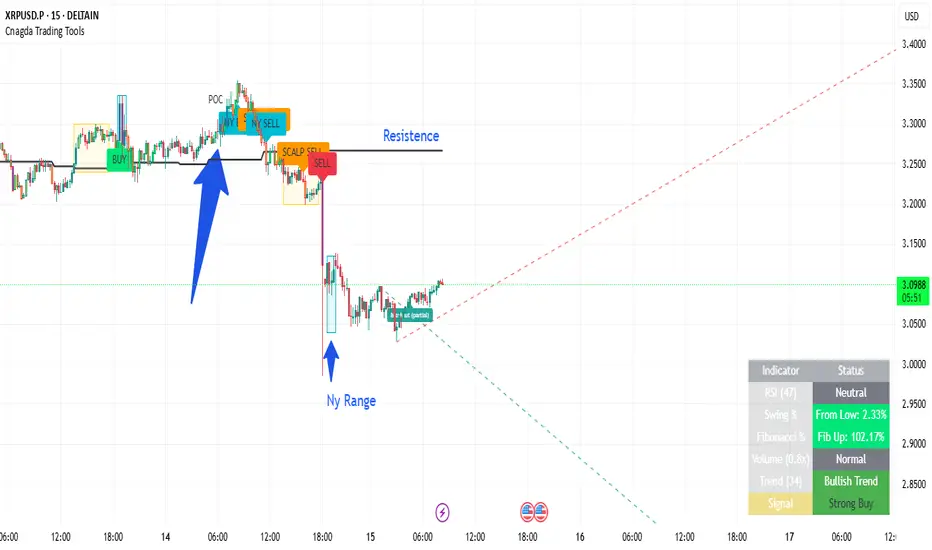
what happened with Xrp/UsdXRP/USD has been stuck in a range since last night. There was a huge drop when the price broke out of the range in the London session.
The Point of Control (POC) is above the price and the price has moved well below the resistance line. So, we can expect the price to test the resistance zone.
What can we do from here? DELTAIN:XRPUSD.P
We can do the following steps from here to confirm our long/short entry.
1. - First of all we should wait for the formation of Point of Control at any point from here (Point of Control is the place where there is a lot of volume or pending orders, this is RSI based)
1.1 - If the price breaks the high of POC candle and sustains and the resistance zone is far away then we will first look for a short scalp trade from here and later if the trendline breakout or NY session break happens and double confirmation is received then we will again look for swing.
1.2 - Now if we look for short entry then because POC and resistance are already formed and price is stuck in NY range then if NY range breaks then we can make a short entry after the confirmation candle
Note -- If price has just broken London or NY session box High or Low with volume, and RSI confirmation —
→ a big bullish move/trending movement is expected.
If the break is up (“BUY” signal/label) — price will move up with stability.
If the break is down (“SELL” signal/label) — fast selling is possible.
According to Scalp MA logic —
After a pullback, on fresh buy or sell signal, especially when scalp_state goes to “BUY” or “SELL” — a few candles will continue the trend in momentum.
RSI Trend:
If 34 RSI > 70 — overbought, upward slowdown or consolidation, risk of major downtrend.
If 34 RSI < 30 — oversold, short covering or reversal possible.
But if the trend-score (e_trendScore) > 3 or < -3 — Strong Buy/Sell will be formed.
Trendline breakout:
If confirmed breakout happens from TL (ATR/stdev/linreg) then strong market movement is possible after that.
Actual probability (Generalized):
The current trend will depend only on the margins of triggers (BUY/SELL Labels) and dashboard analytics.
Trend change will come only when —
Price breaks the session box, And the indicator confirms (volume, RSI, MA crossover).
Entry only on getting strong signal, otherwise avoid scalping in range and whipsaw.
This is for only education purpose before entry please research properly
XRP recap & current ?
Hi,
I hope you are safe.
Follow your style and R:R
If you don't, and you bang everything on a horse. You might get unlucky.
Split it... gap it.. let feel what's good.
You are off for a marathon.
Yest : Trade on a 1h/30 flag = Loss
Today : Trade on trendline & Double bott ?
If in the moneii.. lets trail
All the best
Not a guru.

Xrp - Is it time to panic sell?It's never a good idea for me to sell out of fear. Understanding how price action moves and why, helps me navigate my emotions. A confluence of factors lead me to believe that Xrp will soon bounce up to my target

$13 Breakout Measured Move$13 seems to be the 1st stop for this measured move.
$27 XRP could STILL be in the cards.

XRP Elliott Wave Forecast: Wave 5 Eyes $3.88 TargetXRPUSD’s bullish cycle, starting from the April 7, 2025 low, unfolds as a five-wave impulse. Wave 1 peaked at $2.655. Pullback in wave 2 ended at $1.9112. Wave 3 surged to $3.66. Wave 4 found support at $2.736. Now, XRPUSD advances in wave 5, targeting $3.88, based on the 123.6% inverse retracement of wave 4. A break above $3.66 is needed to rule out a double correction and confirm the bullish trend.
Within wave 5, a lower-degree impulse is forming. Wave (i) hit $3.105. Dip in wave (ii) ended at $2.9033. Wave (iii) reached $3.382. Wave (iv) corrected to $3.1053. XRPUSD should rally in wave (v) to complete wave ((i)). A corrective wave ((ii)) will likely follow, adjusting the cycle from the August 3, 2025 low. Afterward, the uptrend should resume. As long as the $2.736 pivot holds, dips will likely find support in a 3, 7, or 11-swing structure, supporting further upside.
