XRPUSD : Wave 4 possibly not yet completed.As of today, I see a new price pattern in XRPUSD.
The counting that is completed as of now seems like wave (A) and wave (B).
The price probably will go to wave (C) in 5 waves if it's going to be a flat pattern (3-3-5).
The other possibilities of wave 4 in the blue circle could be a triangle (ABCDE) or a double zigzag (complex).
I may be wrong. Please make your own analysis prior to placing any trade.
XRPUSD.P trade ideas

Minimum risk Maximum profit on XRP this weekI am anticipating a rapid growth in XRP in the next 30days. I enter low risk and keep going risk-free if the trade plays out well.
entry : 3.1
Sl : 3.03
Tp : 3.5, 4.0, 5.0 ath
my strategy is BE at every trigger.
Goodluck

XRP?
Hi
3.14 seems to be strong resistance.
So far its doing it,,, resist
What if it breaks?
Shall we see higher prints...
That pattern; some call H&Shoulders, some call jumanji, starwars,, etc etc
:)
The point is it name doesn't matter. As long the pattern prints higher prices and follow it's path.
If not, we ll call it smthg else
All the best.
Not a guru

$XRPUSD: Limits of Expansion🏛️ Research Notes
Documenting interconnections where historic area and coordinates of formations are used to express geometry of ongoing cycle.
If we scale out the chart back starting from roughly 2016, we can see more pretext like how the price was wired before decisive breakout from triangle.
Integrating fib channel to the angle of growth phase of the previous super-cycle, so that frequency of reversals match structural narrative.

XRP?
Hi,
Did some adjustment.
1st didn't work as smooth.
Will monitor & trade accordingly.
Out of range 3.18
Cautiously watching BTC, didn't expect it trade below bullish levels. 118200 (my2c)
When it broke 120k (bye bye 120).. I thought 130k will be smooth.
Anyways. We'll see how
Progress in crypto space.
All the best
Not a guru

buy I will take entry after the breakout of small time frame trendline ,In my analyses market have to go on up

XRP 4hr ChartHave a look at the lines I have drawn on the Chart, RSI and the Momentum indicator.
Looks like a W pattern on all levels. I'm not guarenting that Price hit's another ATH but, I wouldn't be Bearish on Xrp right now. This is the second wave down to retest $3.
Look on the brownish line on the price chart to see where price was the last time Momentum, Rsi relative to price. $1.90 V. $3 today Aug 15th

Xrp - It all comes down to this!🚀Xrp ( CRYPTO:XRPUSD ) has to break structure:
🔎Analysis summary:
After Xrp created the previous all time high in 2018, we have been seeing a consolidation ever since. With the recent all time high retest however, Xrp is clearly showing some considerable strength. It all comes down to bulls being able to push price higher, above the massive horizontal structure.
📝Levels to watch:
$3.0
SwingTraderPhil
SwingTrading.Simplified. | Investing.Simplified. | #LONGTERMVISION

XRP Price Poised for at Least 30% Growth or DeclineA look at the XRP price shows that if it breaks the $3.2 resistance level, it could surge to at least $4. Conversely, if negative news emerges and the $2.9 support level breaks, it could plunge to around $2.

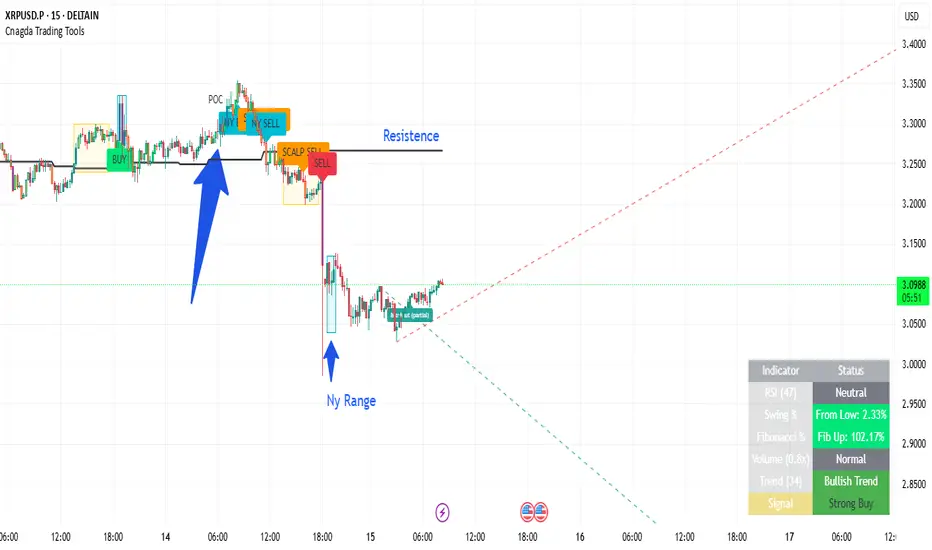
what happened with Xrp/UsdXRP/USD has been stuck in a range since last night. There was a huge drop when the price broke out of the range in the London session.
The Point of Control (POC) is above the price and the price has moved well below the resistance line. So, we can expect the price to test the resistance zone.
What can we do from here? DELTAIN:XRPUSD.P
We can do the following steps from here to confirm our long/short entry.
1. - First of all we should wait for the formation of Point of Control at any point from here (Point of Control is the place where there is a lot of volume or pending orders, this is RSI based)
1.1 - If the price breaks the high of POC candle and sustains and the resistance zone is far away then we will first look for a short scalp trade from here and later if the trendline breakout or NY session break happens and double confirmation is received then we will again look for swing.
1.2 - Now if we look for short entry then because POC and resistance are already formed and price is stuck in NY range then if NY range breaks then we can make a short entry after the confirmation candle
Note -- If price has just broken London or NY session box High or Low with volume, and RSI confirmation —
→ a big bullish move/trending movement is expected.
If the break is up (“BUY” signal/label) — price will move up with stability.
If the break is down (“SELL” signal/label) — fast selling is possible.
According to Scalp MA logic —
After a pullback, on fresh buy or sell signal, especially when scalp_state goes to “BUY” or “SELL” — a few candles will continue the trend in momentum.
RSI Trend:
If 34 RSI > 70 — overbought, upward slowdown or consolidation, risk of major downtrend.
If 34 RSI < 30 — oversold, short covering or reversal possible.
But if the trend-score (e_trendScore) > 3 or < -3 — Strong Buy/Sell will be formed.
Trendline breakout:
If confirmed breakout happens from TL (ATR/stdev/linreg) then strong market movement is possible after that.
Actual probability (Generalized):
The current trend will depend only on the margins of triggers (BUY/SELL Labels) and dashboard analytics.
Trend change will come only when —
Price breaks the session box, And the indicator confirms (volume, RSI, MA crossover).
Entry only on getting strong signal, otherwise avoid scalping in range and whipsaw.
This is for only education purpose before entry please research properly
XRP recap & current ?
Hi,
I hope you are safe.
Follow your style and R:R
If you don't, and you bang everything on a horse. You might get unlucky.
Split it... gap it.. let feel what's good.
You are off for a marathon.
Yest : Trade on a 1h/30 flag = Loss
Today : Trade on trendline & Double bott ?
If in the moneii.. lets trail
All the best
Not a guru.

Xrp - Is it time to panic sell?It's never a good idea for me to sell out of fear. Understanding how price action moves and why, helps me navigate my emotions. A confluence of factors lead me to believe that Xrp will soon bounce up to my target

$13 Breakout Measured Move$13 seems to be the 1st stop for this measured move.
$27 XRP could STILL be in the cards.

XRP Elliott Wave Forecast: Wave 5 Eyes $3.88 TargetXRPUSD’s bullish cycle, starting from the April 7, 2025 low, unfolds as a five-wave impulse. Wave 1 peaked at $2.655. Pullback in wave 2 ended at $1.9112. Wave 3 surged to $3.66. Wave 4 found support at $2.736. Now, XRPUSD advances in wave 5, targeting $3.88, based on the 123.6% inverse retracement of wave 4. A break above $3.66 is needed to rule out a double correction and confirm the bullish trend.
Within wave 5, a lower-degree impulse is forming. Wave (i) hit $3.105. Dip in wave (ii) ended at $2.9033. Wave (iii) reached $3.382. Wave (iv) corrected to $3.1053. XRPUSD should rally in wave (v) to complete wave ((i)). A corrective wave ((ii)) will likely follow, adjusting the cycle from the August 3, 2025 low. Afterward, the uptrend should resume. As long as the $2.736 pivot holds, dips will likely find support in a 3, 7, or 11-swing structure, supporting further upside.

XRP I don’t want to jump the jump but last time BTC broke aths XRP had a massive pump to the upside thinking the lil pop we get at the end around October
Just a thesis

XRP? Let's dream
Hi,
Hahaha
From previous cycles.
IF it's bullish mode ( it's the same- theoritically)
in 10 days it will reach 4.70
in ULTRA bullish 6.60
Wohooo... :)
Well.. hope your dream comes true and wishing you the best.
Not a guru
From Sunshine Malaysia

XRP? readyyy...
Hi
From pattern looks heavy likely.
The only nega. is reaction before moving (drama...)
So it might go down to 3.26-25 before real move.
The thing with trading, agility. Your account, risk calculation
I only wish the best for you.
Go go XRP.
Not a guru.

XRP Long Execution Looking at XRP's current situation, here are some compelling reasons why it could see significant price movement:
Regulatory Clarity:
XRP recently gained major clarity from its legal battle with the SEC, with courts ruling that XRP itself isn't necessarily a security in retail sales. This removes a major overhang that kept institutional investors away for years.
Utility Focus:
Unlike Bitcoin which is primarily a store of value, XRP was designed for actual utility - specifically cross-border payments and remittances. If Ripple's partnerships with banks and financial institutions gain real traction, this could drive substantial demand.
Institutional Adoption: With regulatory clarity, traditional financial institutions may finally feel comfortable integrating XRP for international transfers, potentially creating large-scale demand.
Supply Dynamics:
A significant portion of XRP supply is held in escrow by Ripple, creating controlled release schedules that could support price if demand increases.
However, it's worth noting why XRP hasn't followed Bitcoin's recent surge:
Bitcoin benefits from being seen as "digital gold" and a hedge against inflation
XRP's utility-focused model means its value is more tied to actual adoption rather than speculation
The crypto market often moves in waves, with Bitcoin leading and altcoins following later
Institutional money has historically flowed to Bitcoin first before diversifying
The key question is whether XRP's utility value proposition will translate into real-world adoption at scale. If it does, the combination of institutional use cases and retail speculation could create significant price pressure. But remember, crypto markets are highly volatile and unpredictable - past performance doesn't guarantee future results.
Based on recent market data, here's why Bitcoin has surged while XRP has remained relatively stagnant:
Bitcoin's Recent Performance:
Bitcoin hit new record highs near $112,000 in May 2025, driven by increased institutional adoption and smart money inflows CNBCCointribune. Trump's re-election boosted crypto confidence, and his March 2025 executive order to establish a strategic Bitcoin reserve further strengthened BTC's position Bitcoin forecast 2025: trends, scenarios and expert opinions — Bitpanda Academy.
XRP's Different Story:
As of August 3, 2025, XRP was trading around $2.77 Ripple XRP/USD price history Aug 3, 2025| Statista, and XRP declined 8% in 24 hours recently, falling from $3.17 to $2.94 due to intense sell pressure XRP Price News: What Next as Ripple Falls 8% Below $3 After Hitting Resistance. Even with some positive momentum from legal clarity, XRP shows bullish signs but is still working toward retesting its all-time high of $3.65 XRP Price Prediction 2025: XRP Forecast for 2025,2026,2027 - 2030.
Key Differences.
Institutional Focus: Bitcoin has captured massive institutional investment as a "digital gold" store of value, while XRP is still primarily seen as a utility token for payments.
Market Position: Bitcoin leads crypto market cycles - when institutions and retail investors want crypto exposure, they typically buy Bitcoin first.
Regulatory Status: While XRP gained some legal clarity, Bitcoin has always had clearer regulatory treatment as a commodity.
Use Case Perception: Bitcoin is viewed as an inflation hedge and portfolio diversifier, while XRP's value is tied to actual adoption of its payment technology - which takes longer to materialize.

This XRP/USD chart is screaming bullish momentum.
We’ve got a clean Elliott Wave structure in play; already completing Waves (1) and (2), with Wave (3) unfolding and looking strong. The bullish flag breakout confirms continuation, and the Fibonacci extensions point to a potential blast toward $3.41 for Wave (3), followed by a final Wave (5) target above $3.70.
On top of that, RSI divergence has flipped bullish again, suggesting momentum is building. The price is holding above the 0.5 Fib retracement, showing buyers are defending key support.
If this wave count plays out, XRP isn’t just going up… it’s gearing up for a parabolic run. Bulls are in control! The next leg could be the one that makes headlines.

Scalping $XRP – Road to $3.4222Scalping CRYPTOCAP:XRP – Road to $3.4222 🚀
XRP is knocking on the $3.31 gate — a breakout here unlocks clean air to $3.38–$3.42.
🎯 Target: $3.4222 (next liquidity cluster from last impulse high).
For the move:
✅ 1H close > $3.31 w/ vol
✅ Clean body closes (no long rejection wicks)
Risk:
⚠️ Fail to hold $3.31 = trap & fade to $3.22–$3.18
⚠️ Weak vol = fake out zone
Smart Play:
🎯 Entry: 1H close > $3.31
🛑 Invalidation: < $3.25
📌 Bonus: Strong $3.4222 hit could fuel $3.45–$3.48
Patience > FOMO. The breakout candle will tell the story. 🗝️

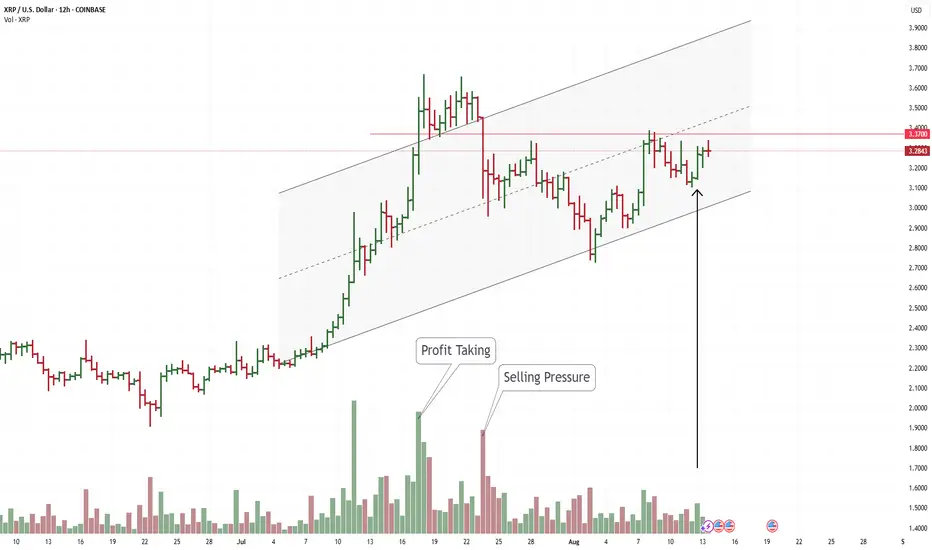
XRP Price Prediction: Why the $3.37 Level is KeyUntil early July, the price of Ripple was range-bound without clear momentum, drifting aimlessly like a sailboat in calm seas. However, everything changed at the beginning of July. A series of higher highs and higher lows has indicated bullish market sentiment, forming a channel where the upper boundary indicates overbought conditions and the lower boundary signals oversold territory. The channel's median, where the price sometimes consolidates, represents a short-term balance point reflecting Ripple's perceived intrinsic value.
The upward slope of the median is a positive sign for the coin, but buying right here and now doesn't guarantee a profit. How might events unfold from here? The base case scenario is a continuation of the upward momentum within this highly volatile ascending channel. And right now, the price is in a very interesting position—just below the $3.37 level. This is a key resistance, and the next two facts confirm why this is the case:
As soon as the price rose above $3.37 in mid-July, we saw a sharp spike in volume. The candle's body shrank, and the close was far from the highs. This indicates that "smart money" was taking profits by selling their previously bought coins to the late-arriving "FOMO" crowd. The fact that the price failed to continue its ascent in the following days confirms this underlying selling pressure.
On July 23rd, the price dropped on a wide bearish candle with huge volume. This was direct market selling. There is no more eloquent evidence of weakness than this.
Together, these two facts suggest that in July, "smart money" was confident that $3.37 was too high a price for Ripple. But that doesn't mean they hold the same opinion in August.
The relatively wide bullish candle on August 12th, with increasing volume and a strong close, gives hope to the bulls. This is evidence of demand activation, and how serious this demand is will be revealed by the test of strength it faces at the $3.37 level.
If we see weak price action here (e.g., bearish engulfing patterns or upthrusts), it would be an argument that "smart money" is still ready to offload their coins.
On the other hand, a breakout to the upside on increasing volume would be a clear sign of demand strength. As of August 13th, the situation looks slightly more bearish in my opinion, as if the buyers' enthusiasm is waning and they are growing timid as they approach this key level. In an optimistic scenario, this level would flip its role to support; a bullish news catalyst would be very helpful for this to happen.
For now, it seems to me that the bulls are not ready for an aggressive assault. Therefore, I am cautiously setting a neutral-to-bearish forecast for the next month, based on this volume analysis. However, I am ready to change my opinion quickly if the market proves me wrong.
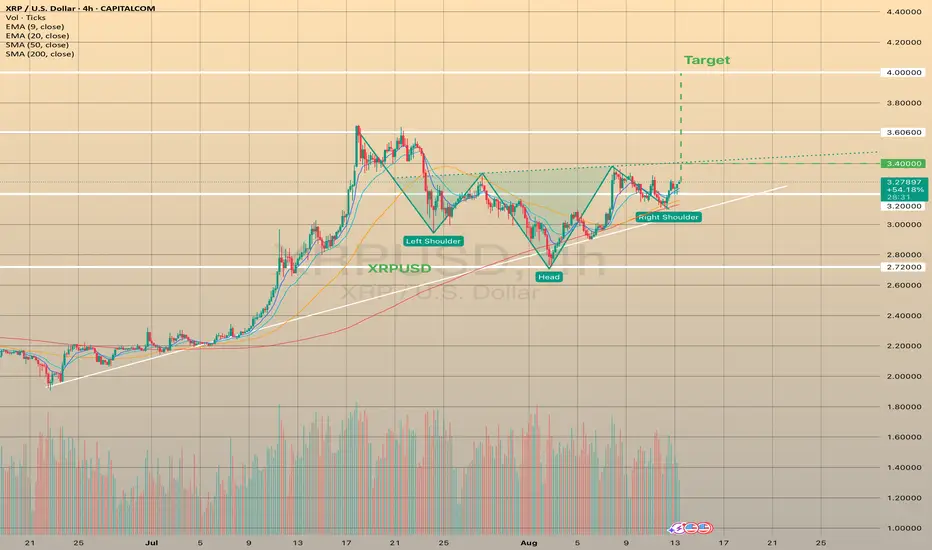
XRPUSD may form a reversal Head and Shoulders patternXRPUSD may form a reversal Head and Shoulders pattern
XRPUSD has been trading sideways since the end of July. Recently the asset found support at sma200 and started to form reversal Head and Shoulders pattern. The neckline right now is situated at 3.40000. If the price breaks above this level, then the final target could be around 4.0000. Besides this, the asset firmly holds the trendline, which is a good sign for mid-term buyers.