XRP 4hr chartMonthly timeframe Pink
Weekly = Grey
Daily = Red
4hr = Orange
1hr = Yellow
15min = Blue
5min = Green
4 candles, 6 Levels, & MarketMeta
A Range = 2 or more candles in the same direction, either Accumulation ranges, Distribution ranges or Single candles which are ranges on lower timeframes.
the 4 candles are:
2 from the Distribution Range - BackSide (BS) which is the first distribution candle in the range. It has an expectation to have a strong influence on price when price is above it. If price is below the BS level, price enters the distribution range and the BackSide level acts as resistance to keep price down in a distribution trend.
The FrontSide candle (FS) is the last distribution candle is the range. the bottom side wick is the swingLow level and distribution range boundary. A FrontSide candle has an expectation to create an accumulation trend and keep price above the swingLow.
The other 2 candles are in the accumulation range and the exact opposite of the BS & FS level so they are labeled Inverse BackSide (Inv.BS) & Inverse FrontSide (Inv.FS)
XRPUSD.PI trade ideas

Ripple (XRP)XRP is on a Bearish PHASE 📉
Let's be guided, this is my point of view on the Ripple XRP market direction

Xrp - The path remains bullish!🔔Xrp ( CRYPTO:XRPUSD ) will still head higher:
🔎Analysis summary:
Looking at the overall picture, Xrp has still been consolidating for the past eight years. This does not mean however, that Xrp cannot break out and head much higher in the future. It simply all just comes down to an all time high breakout, together with the potential bullish triangle breakout.
📝Levels to watch:
$3.0, $1,7
SwingTraderPhil
SwingTrading.Simplified. | Investing.Simplified. | #LONGTERMVISION

XRP/USD – Breaks Down Below $2.82🔴 SHORT under $2.82 – target $2.75
XRP trades at $2.81, sharply below SMA200 ($2.96). Resistance: $2.99, support: $2.75. RSI at 33, weak and trending down. Momentum favors sellers unless $2.85+ recovery.
📖 Keywords: #XRPUSD #Ripple #CryptoBreakdown #AltcoinWatch

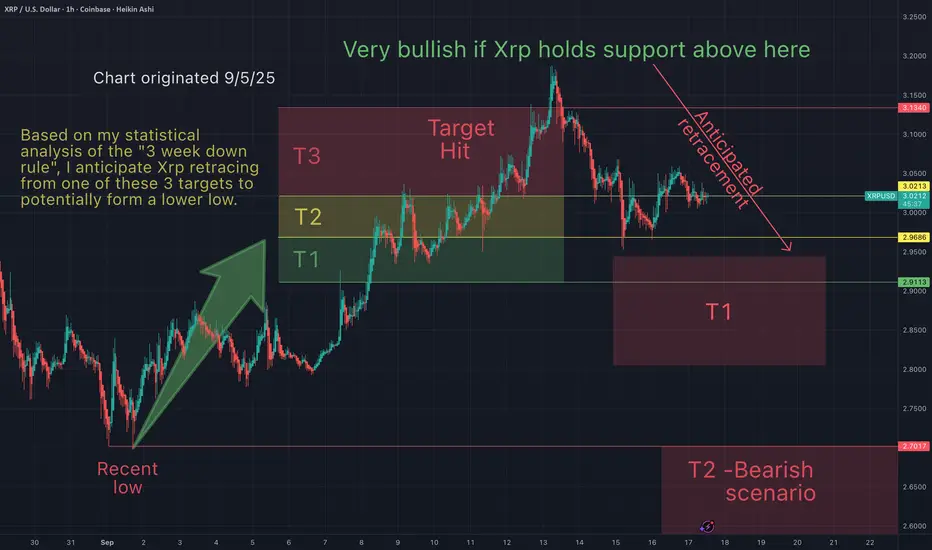
Is Xrp going lower?On Sept 5th I suggested that Xrp was bullish and heading up towards my take profit (T1-T3), then retrace.
Things are going according to what I was expecting. Congratulation to everyone who has made some gains here based on everything suggested on my charts. The most important thing is a trading strategy. And these strategies have made incedible gains over time.
Question remains, will Xrp bounce off my T1 red target or make a lower low? What do you think?
I'd like to hear form you to gauge sentiment.
May the trends (continue to) be with you.
XRPUSD 1D chart review1. Trend and lines
• We had a clear downward trend (orange trend falling line).
• The price broke this line and came out of the top - this is usually a signal of changing the sentiment to a more bullish.
2. Support and resistance
• The next support: approx. 2,93–2.92 USD (Red Zone + SMA).
• Another strong support: approx. USD 2.76 (below, heavily tested earlier).
• The nearest resistance: approx. USD 3.12 (green line).
• Another resistance above: approx. 3,35-3.36 USD - very important, because breaking this level can open the road to $ 3.50 and higher.
3. Medium walking (SMA)
• Red SMA (shorter) slowly turns up.
• Green SMA (longer) is still slightly inheritance, but the price is already lasting.
• This is a positive signal - the beginning of the trend change may suggest.
4. MacD (at the bottom of the chart)
• The blue line (MacD) cut the orange (Signal) from below - this is a buy signal.
• The histogram begins to grow green → Momentum tilts to the bull side.
5. RSI
• RSI is around 55–60, i.e. in the neutral zone, not yet noticed.
• There is a place for further growth before it enters the purchase zone (> 70).
⸻
✅ Summary for you (straight)
• Breaking the inheritance trend, buy signal on MacD, RSI not too high yet.
• Key resistance now: USD 3.12 → If it pierces, the target is USD 3.35.
• Key support: USD 2.92 → If it drops below, possible exit to USD 2.76.

XRPUSD: Buy the Dips Above 2.90, Target the ATHAfter printing a new all-time high at the end of July, COINBASE:XRPUSD entered a correction phase that bottomed in early September around 2.70.
From there, the rebound was strong: price broke above the falling trendline and, even more importantly, reclaimed the 3.00 psychological level.
Looking at the broader chart structure since June, the picture is constructive and it’s reasonable to expect further upside — potentially a retest of the previous ATH, or even the making of a fresh one.
📈 Bias: I remain bullish on XRP as long as price holds above 2.90.
🎯 Trading Plan: The strategy here is to buy dips, with the old ATH as the first big target.

XRP RATE CUTSBe ready for heavy volatility. ETF drop and Rate cuts. Its going to be a wave of movement just waiting what to do.
I believe its going to make a ATH then Crash back down and slowly get bought back up by institutions.
My guess long term bullish short term manipulation.

XRPUSD TRADE IDEA, 30 SEPT 2025.The Ripple seems to be moving in the same direction like the Eth, cause the analytical framework seems identical and looks the same, but the for four most stable leading coins follow each other as the take lead from the over ring leader bitcoin, all the four stable coins are still on a short retracement downward but the question is if the movement downward would hold.

XRP 1:4 RRwhat the hell is going on with XRP , ain't no regulation the price is still ranging between 2.75 and 3 maximum does someone have an idea ?

Will Ripple (XRP) continue to sell XRP – Distribution Pattern & Elliott Wave Roadmap
We’ve now tapped this support line five times. The structure looks like another Lower High (LH) forming inside a distribution pattern.
• Bullish scenario: If price breaks above the LH structure, we could see continuation toward a new all-time high.
• Bearish scenario: If lower highs persist, I don’t expect a sixth touch of this support. Instead, a decisive break lower would confirm the top of Wave (5) and start a larger correction.
That correction should complete as a 3-wave structure, setting up the Super Cycle Wave (1) top. From there, leg 2 develops before a true leg 3 rally begins. Based on my count, that rally zone could emerge from $0.05 – $0.14.
This chart is part of my overall Elliott Wave view (see my first post). I’ll update that main chart when a minor leg one within this corrective phase is confirmed.
⚠️ CRYPTO:XRPUSD Stay tuned—updates will follow as CRYPTO:XRPUSD defines its path.

XRP CAN YOU SEE THROUGH ITthis is my new set up for XRP, the key levels are very important , as it's a bit shown that we are ranging between the 2.70 and 3.3 dollars , this set up is bullish of course

XRP Daily ChartBreaking below this support see if it fills this wick to the left or clean range below.

awaiting confirmationim mainly looking for buys while trying to make the most of the pair by also looking for shorts. im hoping for 38 but only charts will tell.

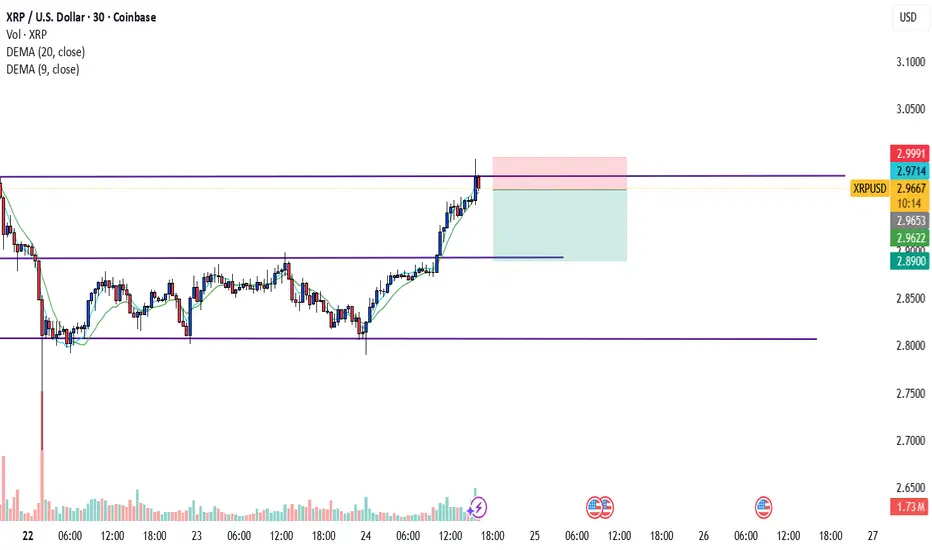
Sol IS TESTING ZONES and XRP IS FOLLOWINGlet's take our entree at 2.9663 as a key zone , waiting for the retracement and let's follow the market structure is its seems to go downwords
XRP Hits Fragile Support AgainFenzoFx—XRP dipped to $2.727 for the third time, weakening support. Due to the liquidity grab and profit booking below $2.727, we expect consolidation toward resistance at $2.943 and the breaker block mean threshold at $3.056.
The market remains bearish below these levels. Traders should monitor them for selling strategies. If resistance holds, XRP may resume its bearish trajectory, targeting the bullish fair value gap with support at $2.663.

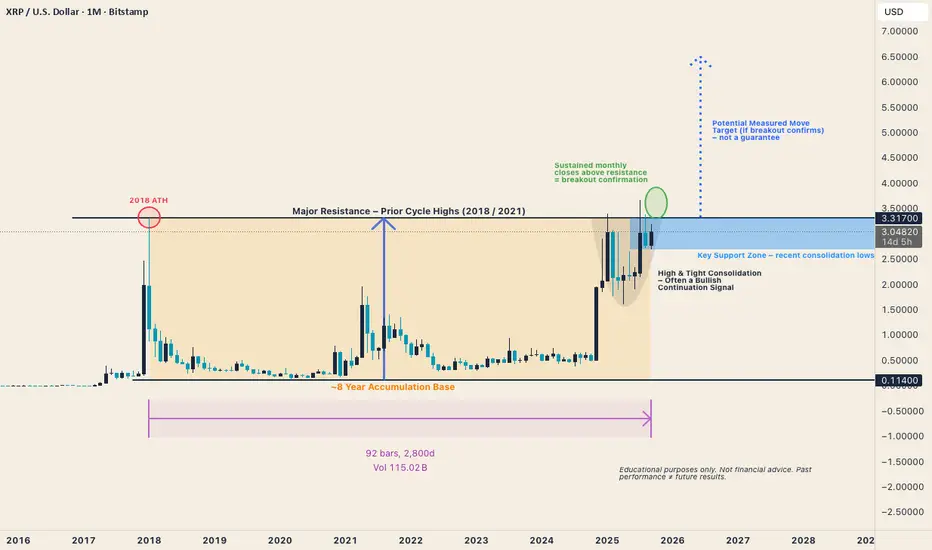
XRP Monthly – Watching an 8-Year BaseXRP is testing major resistance from prior cycle highs (2018 & 2021).
Structure: ~8-year accumulation base
Behavior: High & tight consolidation on the right side of the base (often bullish continuation)
Confirmation: Sustained monthly closes above $3.30 = breakout confirmation
Projection: Potential measured move points toward ~$6.50 (educational framework only, not a guarantee)
Key takeaway: This is one of the most significant long-term structures XRP has ever formed. Traders should watch closely for confirmation in the coming months.
XRP Long Price broke out of a descending wedge, making a HH / HL on the 4h. 1h double bottom & testing .382 and .5 fib levels, this was my entry area.
Stop loss below the low's, first TP at 3.3 second at all time high's.

Ripple Finished A Correction Within Bullish TrendRipple Finished A Correction Within Bullish Trend, as we see it recovering in an impulsive fashion, which can extend the rally from technical perspective and by Elliott wave model.
Ripple with ticker XRPUSD is waking up from projected support after an ABC correction in wave IV, so bulls could be back, as we see it breaking above channel resistance line and important 3.08 level. So after current short-term pullback, we may see more gains and another push toward all-time highs for wave V, possibly to the 4-5 area.

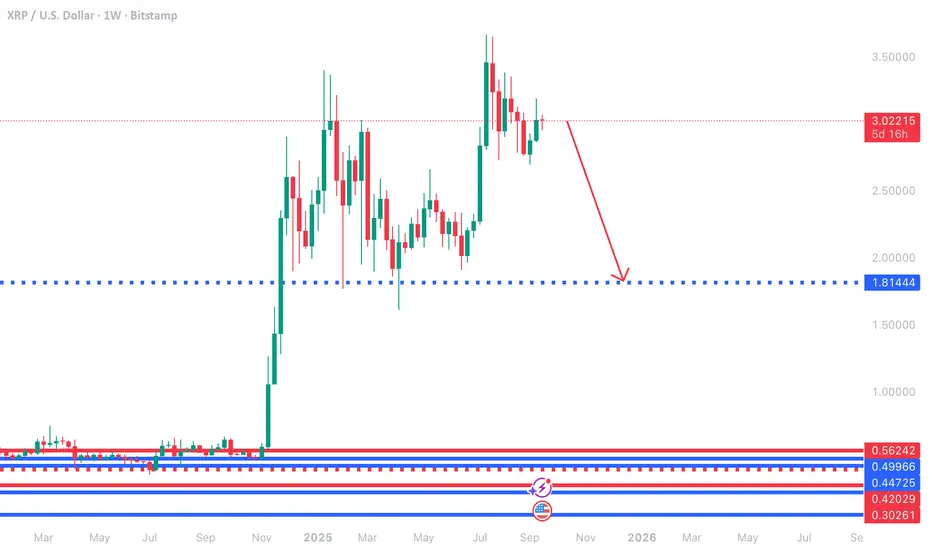
XRP WILL CRASH TO 1.8114$ IN LINE WITH BTC CRASH!XRP has seen one of the most meteoric rises in crypto this past year.
There have been some holding the bag since 2019 to see this occur. Don't wipe out all your gains...... HODL is always the best tactic, but this market is so cyclical that sometimes it's better to be In USDT and weather the storm and buy back at lower prices.
If you go to our page, you'll realise that we are predicting massive financial crashes across the board in all financial markets that we cover, and this is just in line with what we expect.
a lot of people will disagree with me and say there is a lot more upside potential, but they aren't seeing what I am seeing.
Something from somewhere will trigger the biggest sell off since 2008, let's wait for trump to open his mouth and the technicals will follow - somehow, my TA is always inline with real life events.
XRP Bullish $3.38 run up 🔎 Technical Setup
1. Ascending Channel – Price is respecting the upward channel, currently bouncing near the lower trendline after a correction.
2. Support Zone – Around $2.95 – $3.00, confluence of the SMA200 and trendline support. Buyers are stepping in here.
3. Resistance Levels –
• First test: $3.10 (black line marked on your chart).
• Major resistance: $3.30 – $3.38 zone (previous highs + chart target).
4. RSI (14) – Cooling off from near overbought; sitting mid-range (~39). This suggests there’s room for upside momentum to build again.
📈 Bullish Scenario to $3.38
• If XRP holds the $2.95 – $3.00 support, expect a bounce toward $3.10 (first resistance).
• A breakout above $3.10 should confirm strength, sending price toward $3.30.
• Final bullish push can test $3.38, which aligns with your marked target and prior resistance area.
✅ Bullish Confirmation Signals
• Strong bounce on current support with volume pickup.

XRP | Strong buy - Let it rip Strategy: Impulse Correction
Direction: Bullish
Moving Average: Blue above Red
Fib Retracement: 38.2 reached
MACD > 0
Support: Should the weekly close above the green support level, we could see XRP moving higher in the coming weeks. As it stands it has bounced of the moving average which acts as confluence.
Entry: 3.04
SL: 2.84
Lots: 0.1 (Plan to pyramid into this one)
1st Target = 3.66
2nd Target = 4.12
3rd Target = 4.71
Trade 6/20
#Trading #Technicals #MovingAverages #FibRetracements #Crypto #XRP

The XRP debacle?This coin and Blockchain may be great in the future, but definitely a bad investment compared to most of the majors. In my opinion. I am pretty sure with this pattern that I have mapped out we will see at least $.14 and probably five cents in the future, where banks and institutions will actually accumulate this coin and weak hands will sell. This looks to me as if it is a week off long-term reaccumulation pattern after the first initial takeoff in 2017 that being said if my prediction is right, five cent will be the spring to set off its next bull cycle. If we make it there, I will definitely buy a decent amount while everybody is panic selling.
