STRONG BUY | XRPStrategy: Impulse Correction
Direction: Bullish
Moving Average: Blue above Red
Fib Retracement: 38.2 reached
Support : Finding additional confluence, as the weekly bounces off a massive support structure
MACD > 0
1st Target = 3.66
2nd Target = 4.12
3rd Target = 4.71
Entry: 3.27
SL: 3.12
Lots: 0.08 (Plan to pyramid into this one)
Trade 5/20
XRPUSD.PI trade ideas

XPRUSD moves to wave 3Trend: Uptrend
I believe wave 4 has already completed and price already moved to subwave 3 of wave 5.
This is only my view. Not a buy or sell recommendation.

XRP/USDT ANYLASIS After a successive breakout of the ascending triangle, we happened to have retest which was also successive bouncing back from the support zone, which was initially the resistance zone of the ascending triangle with good volume. Now from here hoping that the price pushes to some higher levels, let's wait and see

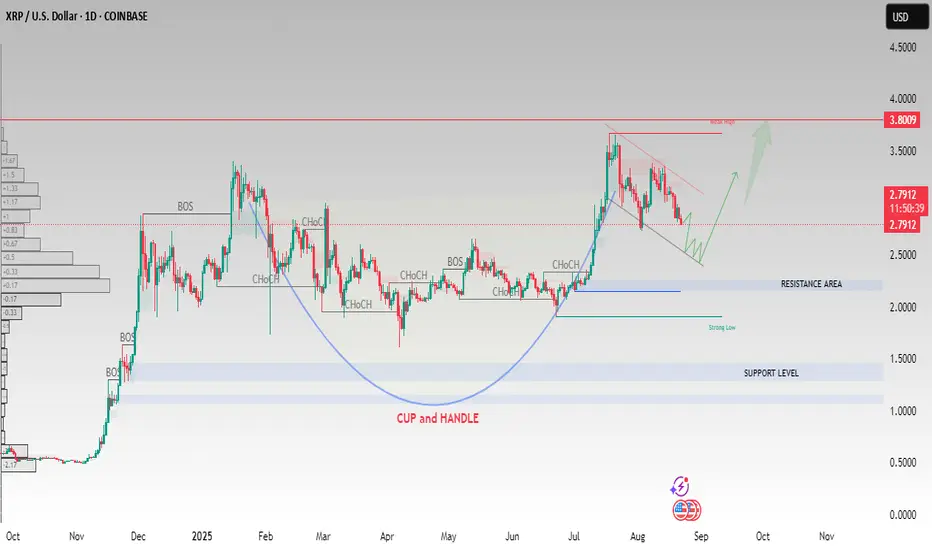
XRP Cup & Handle – Testing a Key Breakout ZoneXRP has built a textbook cup & handle formation on the daily timeframe, a pattern that often signals continuation when confirmed.
Cup Formation: The rounded base extended across several months in 2025, absorbing selling pressure and establishing support.
Handle Development: A descending wedge formed as the handle, pulling price back into prior resistance.
Breakout Test: Price is now pressing against the neckline (~$3). Sustained closes above this area are critical for confirming a breakout.
Measured Move Projection (example, not a guarantee): A typical cup & handle breakout can project a move equal to the depth of the cup. In this case, that points toward the ~$4.20 region.
Key Levels to Watch
Support: ~$2.80 (handle low / prior consolidation zone)
Breakout Level: ~$3.00 neckline
Potential Projection: ~$4.20 if breakout confirms
Takeaway
The setup is clear: XRP needs to confirm the breakout with sustained closes above the neckline and rising volume. Without confirmation, the pattern risks invalidation.
This is an educational chart only - not financial advice. Market movements are unpredictable, and past performance is not indicative of future results.

The big move UP is comingHave published this one in the mind section fews times.
Now you can keep track ot it.
The fractal is working quite well. Combined with the parallel channel you get a better picture of the key levels. Also my custom EMA indicator is confirming the downside shorterms with a good opportunity to buy around 2.5 level.
Good luck all.

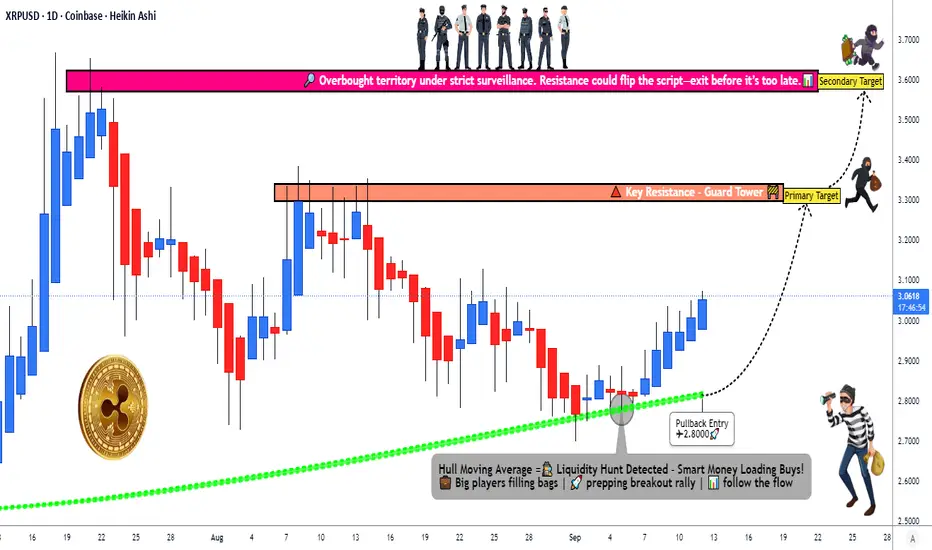
XRP/USD Analysis | Smart Entry, Risk, and Exit Plan🚨 XRP/USD: The Great Crypto Heist Plan (Swing/Day Trade) 🤑💰
Asset: XRP/USD (Ripple vs. U.S. Dollar)
Vibe: Bullish Bandit Mode
😎Plan: Steal the profits with a slick swing/day trade setup using the Thief Layering Strategy! The Hull Moving Average (HMA) is flashing green 📈, signaling a buy trend, and institutional players are sneaking in. Time to execute the heist! 🕵️♂️
📜 The Heist Plan: Key Details
🎯 Entry (The Sneaky Break-In):Deploy the Thief Layering Strategy with multiple buy limit orders to maximize your loot:
🪜 Layer 1: $2.9000
🪜 Layer 2: $2.9500
🪜 Layer 3: $3.0000
🪜 Layer 4: $3.0500
Pro Tip: Stack more layers based on your risk appetite and market conditions. Be the slickest thief in the crypto game! 😏
🛑 Stop Loss (The Getaway Car):Set your escape plan at $2.8000 after the breakout confirms. Dear Ladies & Gentlemen (Thief OGs), tweak your SL based on your strategy and risk tolerance. This is your heist, so protect your loot! 🚗💨
Note: I’m not your financial consigliere—set your SL wisely to avoid getting caught! ⚠️
🎉 Targets (The Big Score):Watch out for the police barricade (resistance + overbought zones + traps)! 🕴️
💰 Primary Target: $3.3000 — Grab your profits and slip away.
💎 Secondary Target: $3.6000 — For the bold thieves aiming for the jackpot!
Note: Don’t get greedy, Thief OGs! These are my suggested TPs, but take profits at your own risk and style. 💸
🔍 Related Pairs to Watch 👀
📊 BTC/USD: Bitcoin often leads the crypto market. If BTC pumps, XRP might follow the bullish vibe.
🦄 ETH/USD: Ethereum’s moves can influence altcoins like XRP. Watch for similar bullish signals.
🧩 ADA/USD: Cardano’s price action often correlates with XRP due to similar market dynamics.
Why Watch These?These pairs can act as your lookout crew. If BTC or ETH shows strength, it could boost XRP’s breakout potential. Conversely, if they tank, be ready to pivot your getaway plan! 🚨
🧠 Key Points & Correlations
📈 Hull Moving Average (HMA): The HMA is our trusty lookout, confirming the bullish trend with its smooth, low-lag signals.
💼 Institutional Flow: Big players are entering, adding fuel to XRP’s upward momentum. Follow the smart money!
🌊 Market Correlation: XRP often dances in sync with BTC and ETH. A rising tide in crypto could lift XRP to our targets faster.
⚖️ Risk Management: The Thief Layering Strategy spreads your entries to reduce risk, but always adjust SL/TP based on your own heist style.
🚨 Risk Disclaimer
Dear Thief OGs, this is a high-stakes crypto heist! I’m sharing my setup, but you’re the mastermind of your trades. Set your SL and TP based on your risk tolerance, and never bet the farm. Trade smart, stay sharp, and escape with profits! 😎
✨ “If you find value in my analysis, a 👍 and 🚀 boost is much appreciated — it helps me share more setups with the community!”
#XRPUSD #CryptoTrading #SwingTrading #DayTrading #ThiefStrategy #Bullish
XRP/USD – Cup and Handle Formation Suggests Bullish ContinuationXRP has recently completed a Cup and Handle pattern, which is a strong bullish continuation signal often seen before major upward moves.
Key technical insights:
✅ Cup and Handle structure formed successfully.
✅ Price is currently consolidating inside a falling channel (handle).
✅ A breakout above the handle could trigger bullish momentum toward the $3.80 resistance area.
📈 If buyers sustain momentum, XRP may extend gains toward the psychological $4.00 level.
On the downside, if price fails to hold, support can be found around $2.50–$2.00 levels.
This setup suggests XRP may be gearing up for the next bullish leg if it manages to break and sustain above the handle resistance.
This analysis is for educational purposes only and should not be considered financial advice. Always manage risk properly before entering trades.

XRPTechnical Analysis is broken down into 4 parts:
Mental Analysis, Comparative Analysis, Risk Analysis, & Procedural Analysis.
M.A. - Why learn about candle charts and markets? Are you ready to be disciplined to manage money as well as emotions?
The markets always know what they are doing, can you see it or not, that's the real question and can you handle being wrong more than once?
C.A. - What have the markets done in the past? where is the money / liquidity? what is the direction of trade or market sentiment? These clues are strategically left behind in the 4 candles and 6 levels they leave behind. From a High timeframe to a lower timeframe, these breadcrumbs are left behind. Train the eyes to see them first and develop a theory with personal "MarketMeta" journal practice or publish of ideas on tradingview
R.A. - Risk, the only real edge to any traders plan. measuring risk & reward before a trade and waiting for that trade to happen take patience. What are the signs candles leave behind showing respect or disrespect for a level? wicks vs body of candle.
P.A. - How to proceed when a trade is entered. How to read price action in real time. Candle formation and countdown timer between timeframes. scaling up from scalp to swing or investment trades.

XRPPossible trade setup opportunity in XRP based on:
1-Price action
2-Volumen action
3-Moving averages and momentum
4-General market conditions

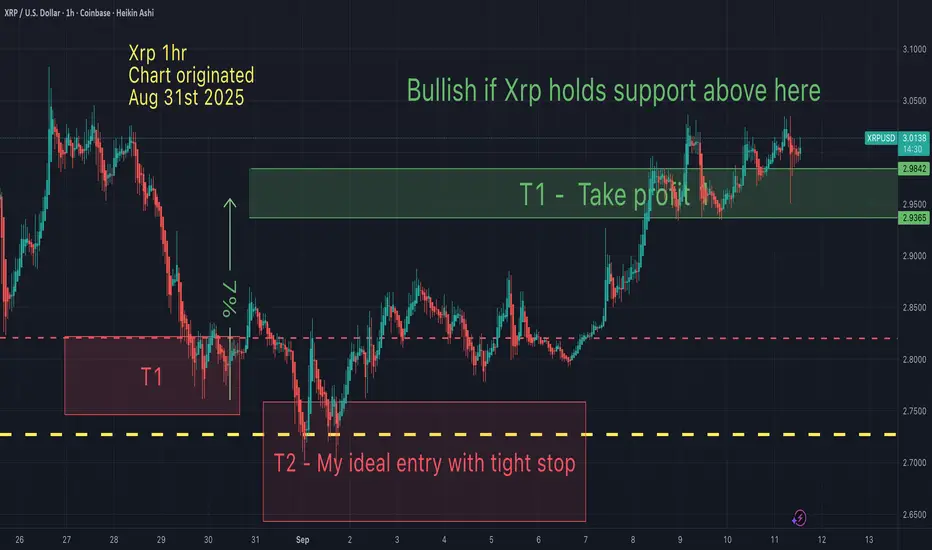
Xrp - Take profit targetsOn Sept 5th I suggested that Xrp would bounce to 1 of my 3 take profit targets. Target 2 has now been hit and I am trailing stops up towards T3.
Can Xrp go higher...sure. But my strategy is to take the highest probability trades so I will win way more than I lose. I don't need to ride alts to the moon, I just need to be in profit week after week, so I can keep playing this game and afford to travel the world at will.
May the trends be with you.

XRP - Take profit targets On Aug 31st I suggested that Xrp would drop lower (to T2) then bounce to my 1st take profit. That played out perfectly. Now the question remains, what next?
Taking some profits at this level is not a bad idea, although I do have 2 other targets slightly higher where I anticipate taking all profits. Until the 3 week down rule plays out, I continue to remain cautious.
I will post these 2 other targets in a chart to follow soon.
May the trends be with you.
XRP uptrend with signal MACD and OBVXRP will continue its uptrend, as can be seen from the green MACD bar line and there is a slow increase and the OBV signal is rising.

XRP/USD – Capped at $3.04🔴 SHORT below $3.04 – target $2.99
XRP trades at $3.01, rejected from $3.04 resistance. SMA200 sits at $2.98, acting as support. RSI dropped from 59 → 52, showing weakening momentum. Bears favored unless $3.04 breaks.
📖 Keywords: #XRPUSD #Ripple #CryptoReversal #BearishSetup #AltcoinWatch

Uptrend with MACDXRP will continue its uptrend, as can be seen from the green MACD bar line and there is a slow increase.

XRP Forms Head and Shoulders At PremiumFenzoFx—Ripple (XRP) displaced above $2.900, confirming a bullish trend. It now trades around $2.978, filling a bearish fair value gap and forming a head and shoulders pattern. On the 4-hour chart, equal lows at $2.934 and a liquidity void at $2.912 suggest a potential downside move.
Please note that $2.912 remains in the premium zone, however, it could trigger a bullish wave targeting $3.037. A break below $2.912 may extend the decline toward the fair value gap at $2.837. Traders should monitor these levels closely for bullish setups.

XRP $17The Target 3 moon mission is preparing for launch.
The #Huntvolatility funnel is well underway.
Targets 1 and 2 have already been achieved and honoured.
In my humble opinion, we are poised to exceed many people's dream level of $10.
It's important to manage your risk as we ascend...
T3 may very well be exceeded.
However, it's crucial to adhere to your own trading strategy and financial objectives.
As we all know, the crypto market is extremely volatile.
Wishing everyone good luck.

XRPOur last trade hit the SL. Now new trade was open and it already hit TP1 at 1:2 RR. Lets see how it plays out until the end.

XRP possible shortXRP could by my analysis have a short position around 2.9370 level.
P.S. That is my first post so i hope it will help anyone. I will try to share my ideas and parts of my trading journey.

1day xrp bullish pennantHard to tell which of these trendlines is the most valid top trendline and bottom trendline of this triangle/pennant so I have to include them all since any can potentially be. *not financial advice*

XRPUSD - Monthly Not Done Yet XRPUSD is looking for more with this nice almost like flag structure signaling a further breakout on the Monthly
This can be seen on the RSI in the green circles. Two peaks are created as price moves up. This pattern is repeating itself.
Very bullish, probably even leading alts into altszn

XRPUSD is following our projectionThe red pressure line is broken.
After dabbling with the L-MLH, price decided to jump back into the fork, projecting a potential huge move ahead.
But not so fast!
The slope of the white fork is super steep.
In such situations I like to throw a Modified-Shiff-Fork, or a Shiff-Fork on the chart too. This gives me often more realistic profit targets.
The trade could be managed by using the light-grey fork's centerline as PTG1 and the rest of the position aims for the white mooning centerline §8-)
A second steak of the position could be loaded, after the yellow CIB-Line is broken. I like to wait for a test of it after the crack and jump-above. It's the same like a test/retest of a Medianline-Parallel if price broke out of it.
Let's have fun here §8-)

#XRPUSDT_H4With the completion of the corrective wave (WXY) at the end of wave (IV) and in the price range of $2.60 to $2.70, an upward movement of wave (V) is likely for initial targets of $4.60 to $5.00.
