XRP | Looking for All-Time HighsXRP | Looking for All-Time Highs
📊 Market Sentiment
Overall sentiment remains bullish, supported by expectations of a 0.25% rate cut in the upcoming FOMC meeting. A weakening USD and increasing global risk appetite are creating favorable conditions for further upside in crypto assets.
📈 Technical Analysis
Price ran liquidity at $2.81 and closed above with a strong reaction.
A 4H demand zone formed after the break of structure, and price found support there.
Currently, price is moving towards the bearish trendline.
If price breaks and closes above this bearish trendline, I will be looking for long entries targeting new highs.
📌 Game Plan
I will wait for price to break and close above the bearish trendline.
Then, I will look for a retest and bounce slightly below or at the trendline before entering.
🎯 Setup Trigger
A 1H market structure shift will be my confirmation for entry.
📋 Trade Management
Stoploss: 1H swing low confirming the BOS
Targets: TP1: $3.14 | TP2: $3.38
💬 Like, follow, and comment if you find this setup valuable!
⚠️ Disclaimer: This content is for informational and educational purposes only and does not constitute financial, investment, or trading advice. Always do your own research before making any financial decisions.
Trade ideas

XRPUSDTI’m short on XRPUSDT — price and Lagging Span are both below the Kijun, keeping bias bearish.
CCI(50) + Bears Power confirm downside stretch and seller control, while RVI + Awesome Oscillator line up with conviction and continuation.
👉 Targeting the 2.37 zone, stops above 3.08.
⚠️ Not financial advice, just my trade plan.

XRP Bearish Breakout XRP has just broken below the triangle and has just recently retested the support level with ema confirmation. and the original candle that broke out of the triangle having high volume this could set the tone for a new down trend for XRP.

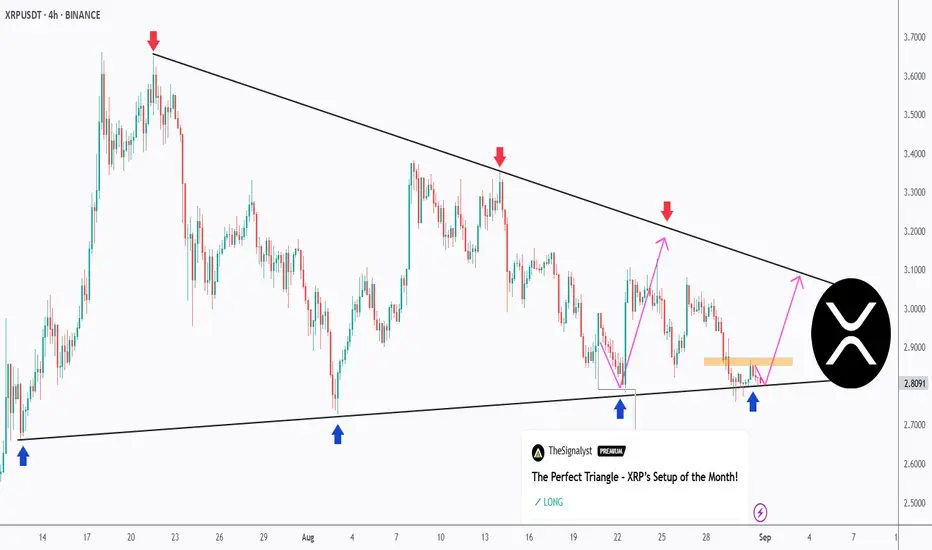
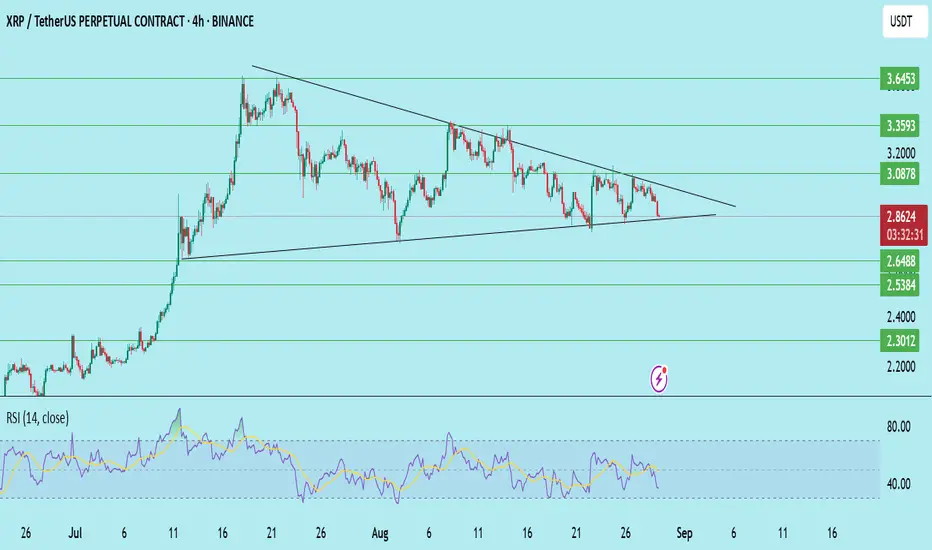
Let’s Do It Again – XRP Retests the Triangle Support!XRP continues to coil inside a textbook symmetrical triangle on the 4H timeframe.
🔻 Sellers remain active at the descending trendline (red arrows).
🔹 Buyers are once again stepping in at the rising support (blue arrows).
📉 Price is now retesting the lower bound of the structure. As long as this zone holds, we can anticipate another potential bounce toward the upper boundary.
🚀 For the bulls to take full control, a break above the last high marked in orange is needed. A confirmed breakout from this triangle will likely define XRP’s next major move — either continuation higher or a bearish breakdown.
This clean and well-defined triangle keeps XRP among the most exciting setups to watch right now!
⚠️ Disclaimer: This is not financial advice. Always do your own research and manage risk properly.
📚 Stick to your trading plan regarding entries, risk management, and trade execution.
Good luck!
All Strategies Are Good; If Managed Properly!
~Richard Nasr
XRPUSDT XRPUSDT 1 hours time frame CHOCH formed and after that It's taking retest
price is on demand zone
on lower time frame 5 minutes choch and bos is formed
I am taking 1 percent risk and reward ratio is 1.5 or 2
lets hope for the best

XRPUSDTBINANCE:XRPUSDT
Previous signal completion
Profit limit lines added
Don't forget to take profit in save position

XRPUSDTBINANCE:XRPUSDT
Given the order block limits on the 4-hour and 1-hour time frames, we can enter the position like this, but wait for liquidity to form and see the reversal candle.

Xrp back in wedge!Long back in wedge, will take % profit towards the upper range of wedge, will save some in case of upward break of wedge.

XRP short! Break of wedge to downside.Retest of the wedge opening short to 2.665,
Will close most of the trade, leaving 20% for lower.

Fliped long XRP! W formation and break of downward trend.Canceled short for small profit and flipped long because of the invalidation of the downward trend line and nice W formation, I believe we will go back into the wedge, to hopfilly break to the upside.

Meme Coin Victims Keep Growing, Illusion of Overnight WealthCan you really turn zero into millions overnight?
What makes people throw all their savings into an unknown meme coin?
And if profits are rare, then who is the real winner in this psychological game?
Hello✌️
Spend 2 minutes ⏰ reading this educational material.
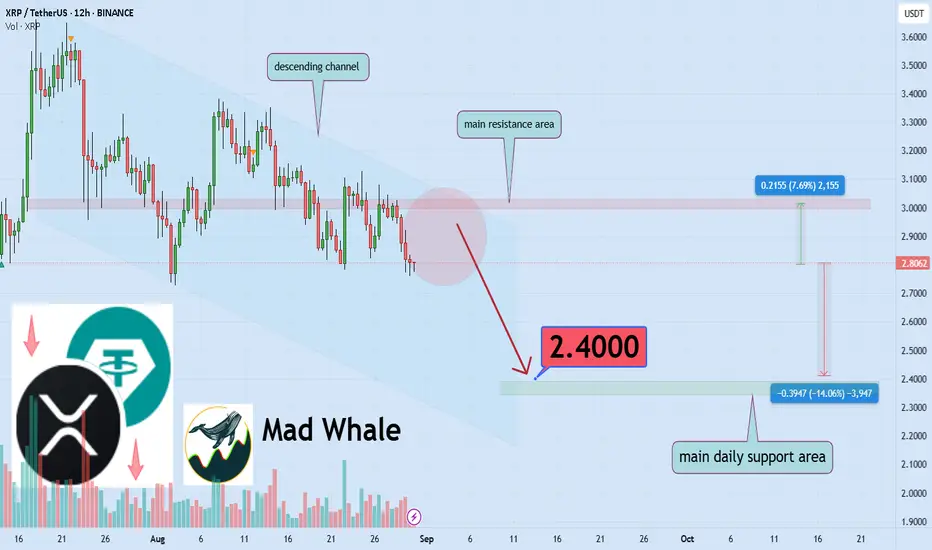
🎯 Analytical Insight on Ripple:
BINANCE:XRPUSDT is currently trading within a clearly defined descending channel 📉, facing strong daily resistance. A pullback of at least 14% is likely, with a target near 2.40💰.
Now , let's dive into the educational section ,
🔄 The Repeating Psychological Cycle
Meme coins always follow the same emotional cycle.
It begins with excitement: a few posts in social media (viral posts), and sudden buzz spark positive energy. Then comes greed: people start buying without logic, dreaming of instant riches. After that, the stage of social proof takes over, when friends, influencers, and media shout about the “golden opportunity,” creating fear of being left out. This is when newcomers pile in with full force.
Right here, whales quietly start selling, and the market shifts into collapse. Prices fall sharply, triggering panic. Small traders, desperate to save what’s left, sell at heavy losses. Finally, the capitulation phase arrives — where everyone admits defeat, swearing never to touch the market again.
The bitter twist? At capitulation, whales buy back cheap, restarting the cycle from the ground up. This pattern has repeated so many times that it has become a psychological law of meme coin trading. Recognizing it allows traders to step away from being victims and instead use the cycle to their advantage.
🚀 The Temptation of Fast Wealth
Nothing seduces the human mind like the promise of 1000% gains in a single night. At that moment, greed replaces logic and even experienced traders break their own rules. The dream of instant financial freedom is so powerful that nobody pays attention to the thousands of hidden losers only the lucky screenshots of oversized wallets make it to social media, fueling the next wave of victims.
🐋 The Whale’s Game
Whales are masters of illusion. They buy in large chunks, pump the price, spread rumors, and once the crowd rushes in, they quietly dump their bags. It’s a pure psychological war: retail traders fear being left behind, convinced they’ve spotted a once-in-a-lifetime opportunity. The truth is whales never trust hype they create it.
😱 The Fear of Missing Out
FOMO is the silent killer of traders. The thought that “everyone else is getting rich except me” drives people into reckless entries. The irony is that most of these entries happen at the exact top of the chart. When the crash comes, it not only drains capital but also crushes the trader’s mental stability. Many beginners quit altogether after one devastating loss.
🛡 Security or the Illusion of Security
Believing a meme coin is safe because it pumped 1000% in a week is one of the biggest traps. Real security comes only through risk management. Putting all your money in one meme coin is like driving blindfolded on a highway you might survive for a while, but the crash is inevitable.
📊 TradingView Indicators and Tools
1. Volume Profile
This tool shows where the highest trading volume has taken place. In meme coins, concentrated volume at specific price levels usually indicates whales playing their game.
2. Relative Strength Index (RSI)
RSI reveals overbought and oversold zones. When a meme coin pumps too quickly, RSI often spikes above 70 a sign of extreme greed taking over.
3. Fear and Greed Index
This index captures overall market sentiment. High readings reflect collective greed, while low readings show panic and fear. Overlaying it on your chart gives a psychological mirror of the crowd.
4. Combining the Tools
The real edge comes from using them together. Imagine Volume Profile shows strong accumulation at a level, RSI flashes overbought, and Fear and Greed signals extreme greed chances are high a sell-off is near. Using tools this way transforms hype-driven trading into informed decision-making.
🎯 Summary
Meme coins are less of a financial opportunity and more of a psychological battlefield. Understanding the emotional cycle and applying TradingView tools can be the difference between being a survivor or a casualty.
🔑 Five Practical Tips for Traders
Always set take-profit and stop-loss levels let strategy, not emotions, manage your trades.
Never enter a position without a tested trading plan you trust.
Invest only what you can afford to lose meme coins are highly speculative.
Remember: news and hype only show the glamorous half; always do your own research.
Protect your peace of mind if a trade causes overwhelming stress, exit immediately.
✨ Need a little love!
We pour love into every post your support keeps us inspired! 💛 Don’t be shy, we’d love to hear from you on comments. Big thanks , Mad Whale 🐋
📜Please make sure to do your own research before investing, and review the disclaimer provided at the end of each post.
XRP/USDT Wave 5 Target 4.50-5BINANCE:XRPUSDT 2.60 wave 4 should complete with wave 5 target around 4.50-5

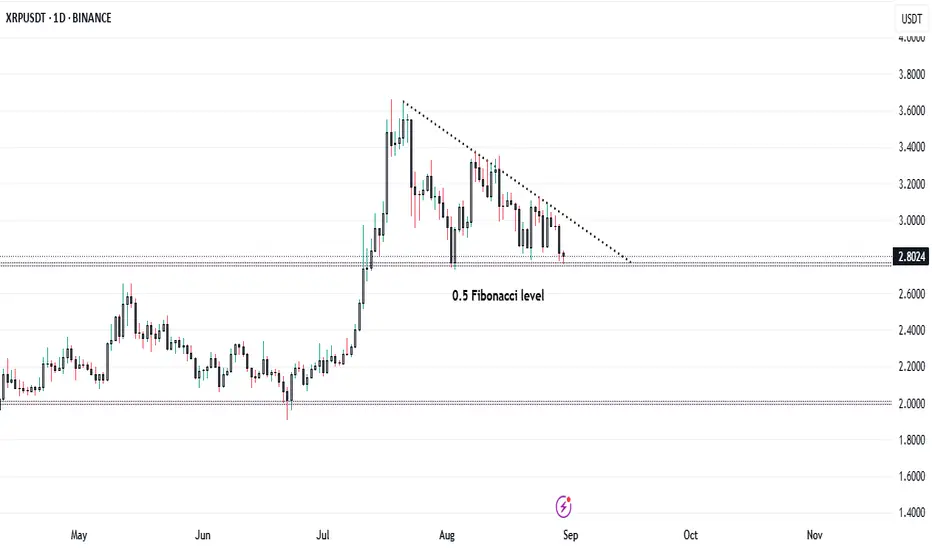
Descending Triangle Showdown: XRP Bulls vs Bears at $2.80..!XRP is currently hovering around the $2.80 level, sitting precisely at the 0.5 Fibonacci retracement zone, which has been acting as a strong support level in recent sessions.
📉 Technical Structure:
* Price action has formed a descending triangle pattern, indicating a period of consolidation following the sharp rally in July.
* The 0.5 Fibonacci level ($2.80) is a critical zone to watch; a strong bounce here could signal renewed bullish momentum.
* A break below $2.80 could open the doors for a retest of the 0.618 Fibonacci level ($2.60) or even deeper support near $2.00.
* On the upside, a breakout above the descending trendline would be the first sign of strength, potentially driving XRP back towards $3.40–$3.80 resistance levels.
⚠️ Key Takeaway:
XRP is at a make-or-break level. Bulls must defend $2.80 to keep the broader uptrend intact, while bears are eyeing a decisive breakdown to extend the correction phase. Traders should stay alert for a confirmed breakout or breakdown from this tight consolidation range.
💡 Strategy Watch:
* Aggressive traders may look for long entries near $2.80 support with tight stops.
* Conservative traders can wait for confirmation: a break above the trendline for bullish momentum or a clean break below $2.80 for bearish continuation.
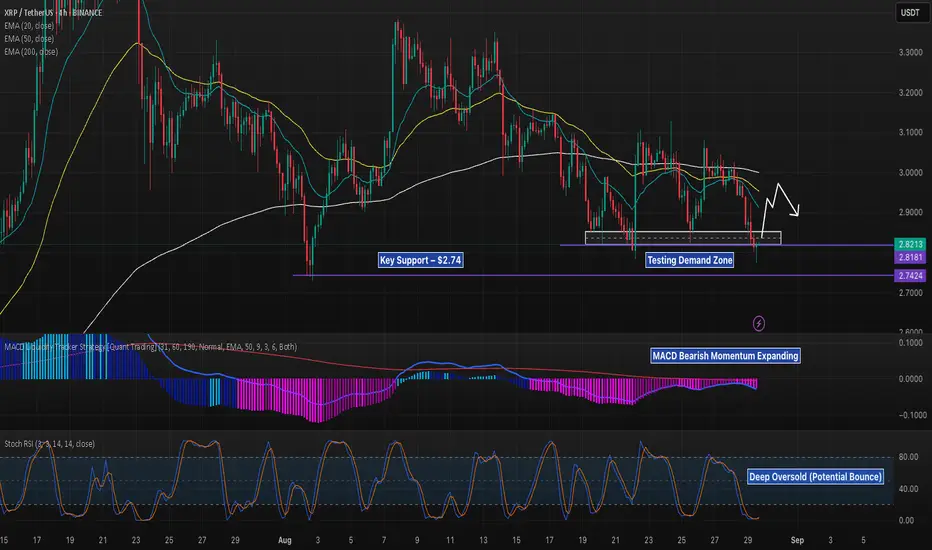
XRP 4H Testing Demand Zone at $2.82, Will $2.74 Hold as Support?XRP is under pressure on the 4H timeframe, retesting the $2.82 demand zone after breaking below the EMA cluster (20/50/200). This area has acted as support several times in August, making it a crucial line in the sand for bulls.
EMA Cluster: With all three EMAs now trending above price ($2.91–$2.99), they’ve flipped into overhead resistance. Until reclaimed, momentum favors sellers.
Support Zones: The grey box at $2.82–$2.85 is the first layer of defense. A clean break below here exposes the purple support at $2.74, which aligns with a strong historical reaction point.
MACD: Histogram momentum continues to expand in the bearish zone, signaling increasing downside pressure.
Stoch RSI: Currently in deep oversold territory, opening the door for a potential relief bounce if buyers step in at support.
Key Scenarios:
Bullish Case: A hold above $2.82 followed by a reclaim of the EMA cluster could fuel recovery toward $3.00–$3.10.
Bearish Case: A breakdown below $2.82 risks acceleration into $2.74. If $2.74 fails, a larger retracement into the $2.60–$2.65 zone may follow.
XRP sits at a pivotal demand zone. Traders should monitor whether $2.82 holds as a springboard, or if sellers drive price into deeper retracement levels.
XRP will retest the support line ┆ HolderStatBINANCE:XRPUSDT on the daily chart shows a consolidation breakout, now retesting the 3.26 resistance. A false break scenario may fuel bullish continuation toward 3.50–3.80. Strong support remains near 2.80, keeping the higher-low structure intact.

XRP Price Struggles Below $3 As Outflows Reach 9-Month HighAt the time of writing, BINANCE:XRPUSDT trades at $2.87, remaining stuck under the $2.95 resistance level. The altcoin has attempted to reclaim the $3.00 threshold for the past two weeks but has repeatedly failed to close above it, highlighting the weakness in bullish momentum.
The Chaikin Money Flow (CMF), a metric tracking capital inflows and outflows, has dropped to a nine-month low. This decline confirms that outflows are currently overwhelming inflows, a bearish sign for XRP's short-term outlook .
Given these conditions, BINANCE:XRPUSDT could face further declines. A drop toward $2.74 remains likely if selling pressure continues, with the asset consolidating above this zone.
If investor sentiment shifts, BINANCE:XRPUSDT could attempt recovery. Reclaiming $2.95 as support would provide momentum to test higher levels. A successful breakout above $3.07 and later $3.12 would invalidate the bearish thesis.

XRP/USDT – Breakdown & RetestCRYPTOCAP:XRP recently broke below its key trendline and has now retested the level, showing rejection — a strong bearish continuation signal.
Structure
Breakdown of the ascending trendline
Retest rejection confirms selling pressure
Supports stacked below at key levels
Trade Plan
Entry: After rejection near the trendline retest
Stop Loss: Above broken trendline
Targets: 0.3540 → 0.3422 → 0.3310 → 0.3240
Bias
Bearish unless XRP reclaims the trendline with a strong close. If reclaimed, the short setup is invalid.
Trading Insight
This is a classic breakdown + retest setup, often signaling continuation to lower support zones. Manage risk with SL.
DYOR | Not Financial Advice
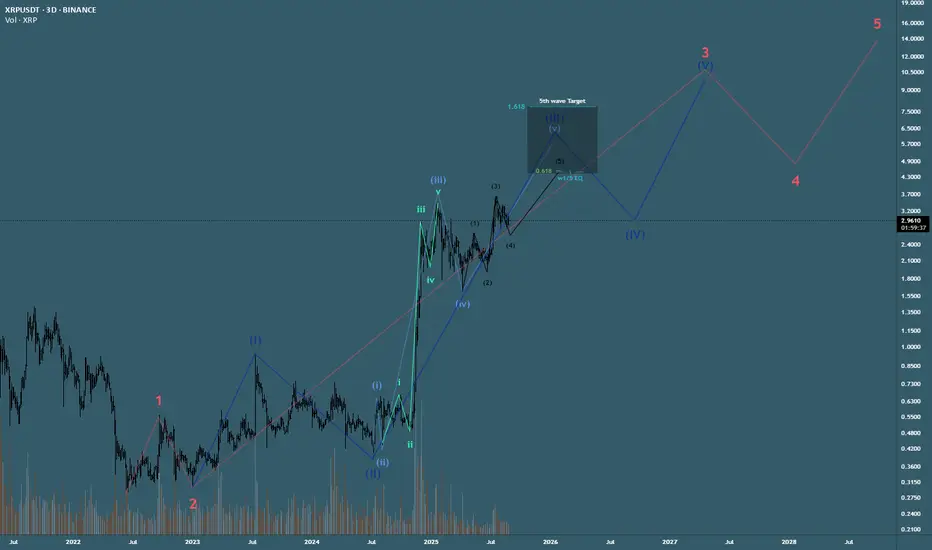
XRP/USDT – Wave 4 Consolidation Before Wave 5?✅ Wave 1 & 2 complete
✅ Strong Wave 3 impulse above $3.6 zone
🔄 Now retracing in Wave 4, contained in a falling wedge
Wave 4 has respected the 0.618 retrace at $2.72, lining up with prior structure support. As long as bulls defend this zone, the setup favors a Wave 5 push toward new highs.
📌 Key Levels
Wave 4 support: $2.7 zone, FVG
$2.20 demand zone
Wave 5 targets: Above or equal prior highs zone
Bias: Wave 4 accumulation → watching for breakout confirmation into Wave 5.

XRP 4X PotetialCRYPTOCAP:XRP did a clean 400% move after breaking out last time.
It just broke out again—same structure, same setup.
$12 XRP isn’t a dream—it’s a target.

Elliot wave A,B,CI think that we are going to A B C and then pop 5 or 6 bucks still waiting for BTC dom to get to 50% or around there

Super Bullish! HTF XRP Elliott Wave Count - Triple 1,2 ImpulseHere is my most bullish scenario for XRP, all rules followed, higher probability than the diagonal playing out. Expecting a choppy grinding 4,5 structure to finish out the pattern similar to the beginning 1,2 1,2 pattern
XRP - LONG SET-UP (SUPER BULLISH)BINANCE:XRPUSDT
Looking Good To Long Between 2.39 - 2.49
With SL Below 2.24
Safe Target 2.56 , 2.8++
Low Lev only as per your risk capacity
JUST FOR EDUCATIONAL PURPOSE

XRP is moving inside the triangle ┆ HolderStatBINANCE:XRPUSDT on the 16h chart shows a triangle formation developing after a recent high at 3.48. The market is compressing between support and resistance, building energy for the next move. Holding above 2.80 keeps the bullish structure intact, with 3.30 as the breakout level to watch.
